
Natural vs. Human Forcing

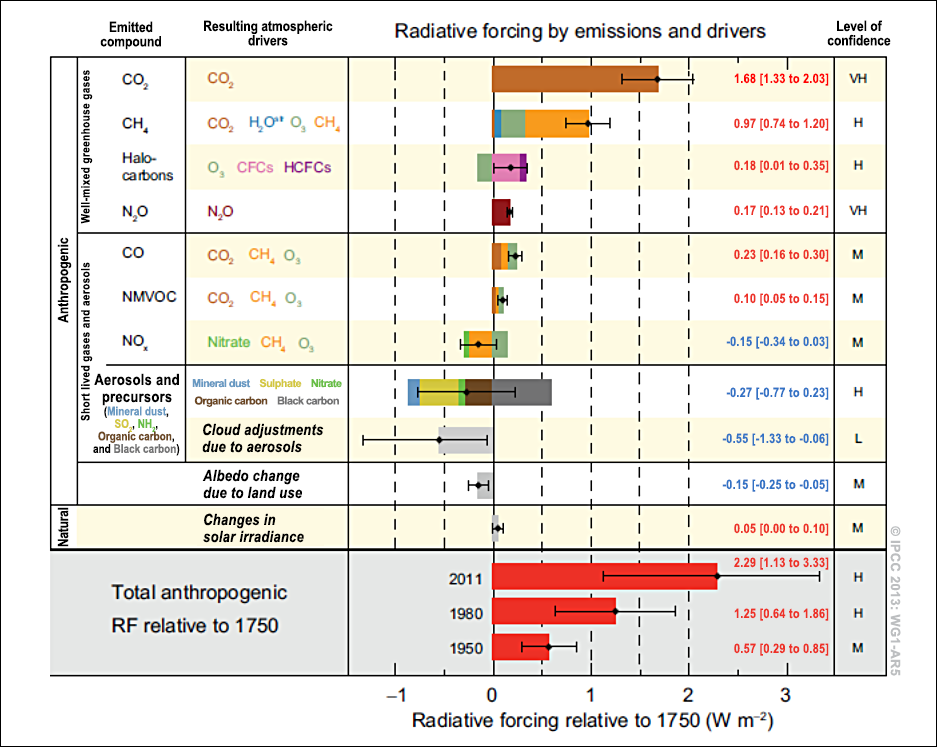
Let us consider more closely the above figure (Figure 1.12) from the IPCC Summary for Policy Makers . There is a lot of information packed in this figure. Figure 1.12 summarizes the relative impacts of various natural and human forcing factors on the Earth's climate. Later on in the course, we will look at how these forcing factors are likely to have impacted global mean temperature trends over the past century. In the meantime, we can make some rough assessment of the relative importance of the different factors as gauged by their estimated radiative forcing — measured by the energy per unit time that a given forcing factor exerts per square meter of the Earth's surface. The first thing to pay attention to is whether the indicated forcing factor is a warming factor (black dot to the right of zero) or cooling factor (black dot to the left of zero). The next thing to take note of is how high or low the forcing associated with that factor is, as indicated by the length of the bar. Finally, take note of the error bars (these are shown as the horizontal "barbell" symbols) indicating whether the factor in question is relatively well known, or relatively uncertain.
The forcings are separated into two fundamentally different categories: anthropogenic (that is, human-caused) and natural. You may be surprised to learn that while greenhouse gases are the primary anthropogenic forcing, there are other notable anthropogenic forcing contributions. Indeed, if one computes the net effect of anthropogenic aerosols (primarily sulfate) produced by industrial activity, adding together the direct and indirect effects of these aerosols, the total negative global radiative forcing (roughly -0.8 W/m2) is nearly half as large as the positive radiative forcing (roughly 1.7 W/m2) due to human-caused CO2 concentration increases (though the uncertainty associated with the most recent estimate of aerosol forcing is quite large). As we will see in later lectures, the cooling effect of these aerosols offset a substantial fraction of anthropogenic greenhouse warming over the past century.
One important historical natural forcing of climate is not shown in this diagram. This is the cooling effect of volcanic eruptions due to reflective aerosol injected into the stratosphere. Unlike other forcings, this volcanic forcing is episodic, rather than continuous in nature. Explosive volcanic eruptions may have a cooling effect on climate for several years. If there is a large number of eruptions over a sustained period of time, this can have an overall cooling impact on climate. We will revisit this issue in Lesson 4.
Feedback Mechanisms
The response of the climate to forcing, whether natural or human-caused, would be far more modest than it is, were it not for the influence of feedback mechanisms. Feedback mechanisms are mechanisms within the climate system that act to either attenuate (negative feedback) or amplify (positive feedback) the response to a given forcing. On balance, the feedbacks are believed to be positive in the sense that the response of the climate system to a positive forcing is greater than one would expect from the forcing alone, because of the net warming effect arising from these responses.
The principle feedback mechanisms, relevant to climate change on historical timescales, are:
- The water vapor feedback. Warming atmosphere can hold larger amounts of water vapor. Since water vapor is a greenhouse gas, this leads to further warming: a Positive Feedback
- The ice-albedo feedback. Surface of the Earth has less snow/ice as it warms, leading to less reflection and greater absorption of incoming solar radiation: a Positive Feedback
- The cloud radiative feedbacks. There are different competing effects:
- Warmer atmosphere produces more low clouds. The primary impact of more low clouds would be to reflect more solar radiation out to space: a Negative Feedback
- Warmer atmosphere produces more high clouds, like cirrus. The primary impact of such thin, high clouds is to increase the greenhouse effect due to their ability to trap much of the outgoing longwave terrestrial radiation while remaining largely transparent to incoming shortwave solar radiation: a Positive Feedback
On balance, it has been believed that the negative cloud radiative feedbacks win over the positive cloud radiative feedbacks - though the low cloud feedbacks are quite uncertain, and the overall cloud radiative feedback could very well be positive.
The net effect of all these feedbacks is positive and serves to increase the warming due a particular external forcing (be it increased greenhouse gas concentrations due to fossil fuel emissions, increased solar output, or some other external forcing) beyond what would be expected purely from that factor alone. For example, a doubling of CO2 concentrations relative to pre-industrial levels would, in the absence of feedbacks, lead to roughly 1.25°C warming. However, our best estimates indicate that the positive water vapor feedback would add about 2.5°C additional warming, while the positive ice albedo feedback adds about 0.6°C warming. While substantially more uncertain, the negative cloud radiative feedback could lead to just under 2°C cooling. Add up the numbers, and the total comes to about 2.5°C warming (actually, current generation climate models average closer to 3°C).
This quantity--how much we expect the Earth to warm once it equilibrates to a doubling of greenhouse gas concentrations--is known as the equilibrium climate sensitivity. We will explore this key concept in more detail in subsequent lectures.
The Carbon Cycle
The traditional concept of climate sensitivity envisions the concentration of CO2 and other greenhouse gases as specified (i.e., doubled from some initial level), and calculates the expected warming. This construction is somewhat artificial, however, because activities, such as fossil fuel burning, do not directly regulate the concentration of CO2 or other greenhouse gases, but instead govern the atmospheric emissions, which can interact with the climate system. For example, life on land and in the ocean can both take up and give off CO2: CO2 is taken up during photosynthesis — production of organic matter by green plants, and given off during respiration (or remineralization) — a reverse process during which organic matter is decomposed. As climate becomes warmer, the living organisms are affected by the change, e.g., green plants might consume more CO2 because the growing season becomes longer and the plants have more time for photosynthesis; or, on the other hand, warmer temperatures might induce bacterial activity and the rates of decay of organic matter, causing an increase in the CO2 emissions. In general, the Earth system processes of chemical, physical, or biological origin that emit CO2 to the atmosphere are referred to as carbon sources, while those that take up CO2 from the atmosphere are referred to as carbon sinks or losses. Climate change affects the characteristics of living things, as well as other components of the climate system, such as, for example, the overturning ocean circulation (which helps to sequester atmospheric carbon in the deep ocean), and therefore can influence various carbon sources and sinks that exist within the Earth system.
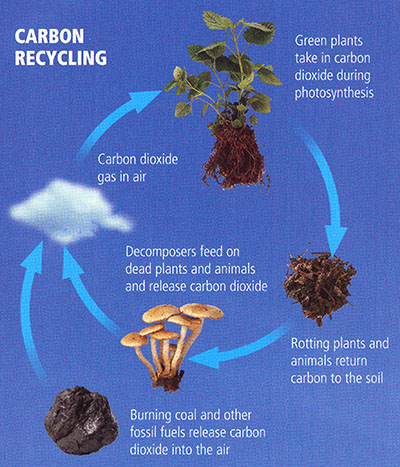
- Burning coal and other fossil fuels release carbon dioxide into the air
- Carbon dioxide gas in air
- Green plants take in carbon dioxide during photosynthesis
- Rotting plants and animals return carbon to the soil
- Decomposers feed on dead plants and animals and release carbon dioxide (Repeats/Return to step 1)
© 2015 Pearson Education, Inc.
We refer to the amount of emitted CO2 that actually stays in the atmosphere as the airborne fraction of CO2. So far, only roughly half of our carbon emissions remain airborne. The other half has been absorbed by carbon sinks. The primary carbon sink is the upper ocean, which has absorbed roughly 25-30% of the CO2, while the terrestrial biosphere has absorbed another 15-20% of the CO2.
These sinks are not constant over time, however. Numerous studies indicate that both the upper ocean and terrestrial biosphere are likely to become less able to absorb and hold additional CO2 as the globe warms. Were this to happen, the airborne fraction of CO2 in the atmosphere would increase, and CO2 would accumulate in the atmosphere more quickly for a given rate of emissions. Such responses are known as the carbon cycle feedbacks, because they have the ability to influence the accumulation of CO2 in the atmosphere.
The existence of carbon cycle feedbacks forces us to reconsider the concept of climate sensitivity discussed earlier. Consider for example, the accumulated carbon emissions that we might calculate would lead to a doubling of CO2 in the atmosphere in the absence of carbon cycle feedbacks. As the climate warms, the positive carbon cycle feedbacks discussed above would cause the airborne fraction to increase. As a result, the final increase in atmospheric CO2 would be greater than the originally calculated doubling. Accordingly, there would be even more warming than one would estimate from applying the standard concept of equilibrium climate sensitivity to the original estimated slug of carbon emissions.
Such complications lead to the more general notion of the Earth System sensitivity. We will revisit these concepts later in the course.