Tracking the recorded PV installation, the International Energy Agency (IEA) found that by 2014, the world had added PV with total global capacity that overtook 150 (GW). That is enough to power the entire country of Germany. To understand the bigger, global picture, it is enough to power over 50 developing countries the size of Costa Rica. More recently, the global installed capacity of PV solar exceeded 609 GW according to IEA 2019 solar energy report and the US. Let's move to the United States, according to an SEIA research market insight report in 2022, the total PV installations surpassed 149 GW. According to the "IEA PV roadmap published in 2014," by 2050, PV will provide 16 percent of the world’s global electricity production. We believe all these predictions will happen much sooner.
For most of us, the reasons behind the exponential growth in the PV capacity in the U.S. in the last decade is still not clear. In order for us to understand the reasons behind this fast implementation, we need to track the PV technology prices and investigate how the market is affected by price changes.
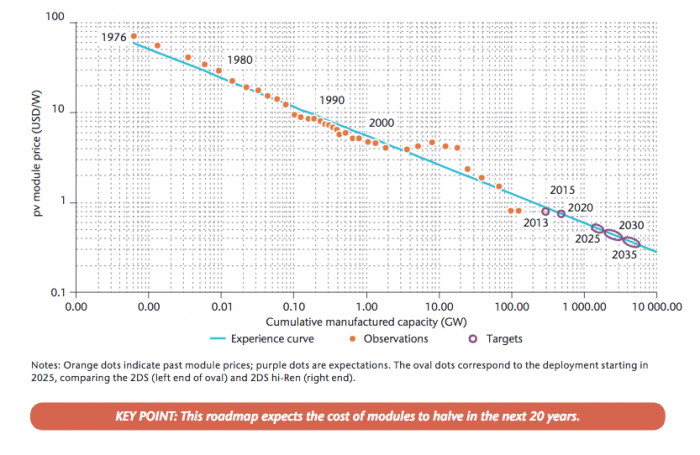
If we consider the time period between 1976 and 2035 on a logarithmic scale and draw the PV module prices versus the cumulative manufactured capacity in (GW), we can see that PV module prices have dropped significantly since the early 1970s. As illustrated in Figure 1.3, it can be seen that the price has dropped from close to 100 dollars per watt of handmade technology in the 1970s to less than 50 cents per watt these days. SEIA market insight report has the most up-to-date module and cell prices. Readers are encouraged to visit their website for more information.
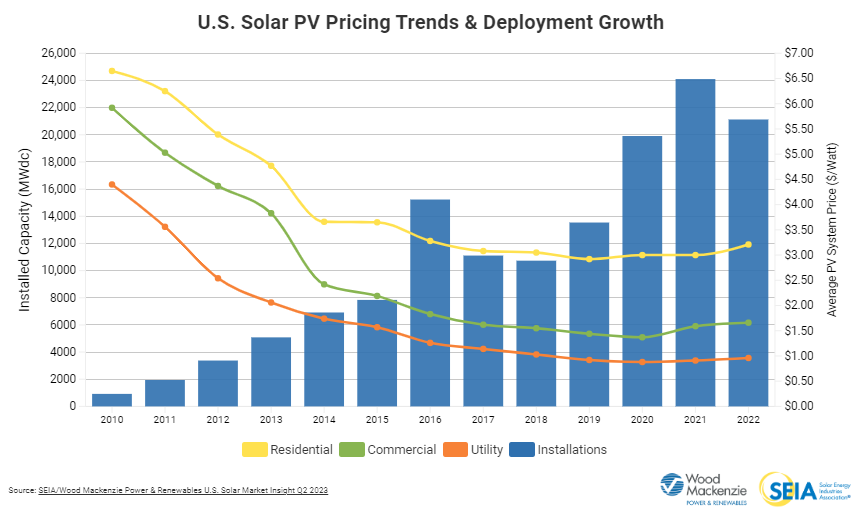
Another factor that plays a large role in PV module prices is installation capacity. Observing the relationship between blended average PV price per watt and PV installed capacity in (MW) within the period between 2010 and 2022, we can see (in Figure 1.4) that PV prices are directly influenced by growth in installation capacity so that the installation cost dropped more than 70% since 2010. According to the IEA PV roadmap published in 2014, PV LCOE reached a level below retail electricity in some countries while it is approaching grid parity, and that makes perfect economical sense for investors.
Review
To learn more about LCOE, please refer to "EME 810 (Economic Figures of Merit - LCOE)." (Note: link is also located on the Review page of this Lesson.)
In addition to the technology being more affordable, in most countries, the incentives programs have a huge impact on pushing installations forward, which is thoroughly discussed in EME 810's Lesson 9 content -- Energy Portfolio Standards and Government Incentives. To highlight some initiatives as an example, the U.S. Department of Energy's "SunShot Initiative", launched in 2011, supports innovation in manufacturing to help attract new facilities to reduce system cost. In order to make solar electricity cost-competitive, the soft cost needs to reach the targets of the Sunshot Initiative by 2020: USD 0.65/W for residential systems and USD 0.44/W for commercial systems. When all system costs are reduced, SunShot's cost target was put to reach LCOE of $0.06 per kilowatt-hour for utility scale PV, and by the end of 2017, the goal was achieved. The U.S. Department of Energy Solar Energy Technologies Office (SETO) is working toward a levelized cost of $0.02 per kilowatt-hour (kWh) for utility-scale solar photovoltaics, $0.04 per kWh for commercial PV systems, and $0.05 per kWh for residential rooftop PV systems by 2030.