So what is that fundamental change that solar adds to the daily demand profile?
The effect that solar power has on the daily profile is referred to as the "Duck Curve" or "Duck Chart." This change in the load shape of the daily curve starts to look like a duck. If we look at solar from the grid point of view, the additional solar looks like a load reduction and that is at the same time unpredictable and uncontrollable. In other words, the solar disturbs the operation of the bulk power plants such as coal by lowering the base load demand, as seen in Figure 12.2.
As said earlier, there are key characteristics to this daily demand profile, such as the two daily peaks and then a base load demand. Usually loads don’t fall below a certain value, as we see on the 2012 curve provided by the California Independent System Operators (ISO) as shown in Figure 12.2.
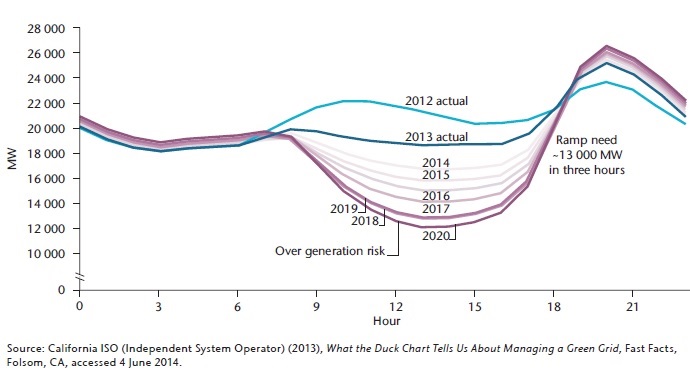
We can see some greater challenges as solar becomes larger in capacity. The load demand can fall down to closer to very small demand value, which means the massive base power plants need to shut down, and that is not an easy task since starting a traditional power plant requires hours, and the process is slow and might not meet the steep ramp demand in the evening after the solar is gone. This can result in a serious stability issue and power outages. For this reason, solar is sometimes viewed as a disruptive technology to the grid and utilities. A prediction of the duck effect on the daily demand curves can also be seen on the 2020 prediction for the daily profile in Figure 12.2.
Proposed Solutions to Duck Effect
Solar arrays may produce more solar energy than the grid needs. When such oversupply exists, there are two main scenarios to propose solutions from the grid point of view - the grid operator side and the load side.
Grid Operator Side
- Utility operators can manually "curtail" solar production, cutting some solar capacity off from the grid. As a result, this wastes the energy produced from the sun, but it saves the grid. This is considered a short term solution.
- Another solution is interconnection with other electricity networks, such as the Texas and western interconnection at the transmission level to expand the capacity of the grid so it can handle more PV capacity. As it sounds, this is a long term solution and usually it takes a long time to expand the grid.
Note:
You may wish to read "Continental U.S. power transmission grid" in the recommended resources on the Overview page for more information about the U.S. grid interconnection.
Load Side or Demand Side Management (DSM)
- The first DSM strategy refers to Demand Response (DR) including storage systems. This can shift the peak to other times during the day, which is usually done either through incentivizing the customers to use electricity when it is cheaper or by storing the electricity for later use. However, this might require more capital investment at the customer side due to the additional storage systems cost.
- The other type of DSM is the Energy Efficiency that lowers the total demand in general. This strategy has great potential, as our peak demand keeps growing due to additional appliances and devices connected to the grid.
Note:
More solutions are being researched to come up with the best scenarios to solve this technical issue. You are encouraged to keep yourselves updated with the new solutions in the market.