Lessons
This is the course outline.
Lesson 1: Solar Electricity Generation in the US and Global Market
Overview
WAIT!
Did you complete the Course Orientation [1]? Before you begin this course, make sure you have completed the Course Orientation (see the Orientation menu). You'll need to read over this material carefully and then successfully complete a quiz on it in Canvas.
Energy is one of the hot topics today. The industry trend is moving toward switching from traditional fossil fuel sources to renewable sources that are cleaner and becoming more competitive in the global market. If you intend to build a coal plant to generate electricity, you would struggle to find the land, capital funds, and expertise and patience to build it. In contrast, electricity from solar is available at different scales with multiple incentives and simple and fast implementation processes.
Note:
We will begin each lesson with a scenario that will place you in a real-world situation. These scenarios will put you in situations where you have to analyze, evaluate, and make decisions when it comes to designing a solar system. We have made sure that these scenarios cover almost all cases you may encounter in real-world solar roles. To take advantage of them, try to immerse yourself in the environment of each scenario.
Lesson 1 Scenario
You work for an electric utility company that is adding a new department for solar energy. During a general meeting, it as announced that you have been chosen to lead that department. Fortunately, you happened to come across the AE 868 Commercial Solar Electric Systems course as part of the Intercollege Master of Professional Studies in Renewable Energy and Sustainability Systems program portfolio at the Penn State World Campus, where you can learn all about the solar "ins and outs."
Your first assignment with the department is to study the solar energy market and see opportunities for different solar energy conversion systems (SECS) for electricity generation in order to choose the most suitable technology to invest in. Then you will study that specific technology's market sectors to understand where to tap into the solar industry and who are the main players. Furthermore, you can find information on basic terminologies and system types and components to understand what solar systems consist of and what components are needed.
This lesson will take you through a journey (in both time and space domains) to learn what you need in order to grasp main topics in the solar industry so that you can lead the solar department with confidence. Furthermore, you may be interested in starting your own solar business. Lesson 1 is the right place to learn the basics.
Learning Outcomes
At the successful completion of this lesson, students should be able to:
- Recognize main types of SECS and their applications for electricity generation including PV, CPV and STE/CSP.
- Identify PV market indicators and main factors driving the development of the PV technology.
- Categorize solar PV system as residential, non-residential and utility scale grid-tied PV systems and their share in the PV market.
- Discuss PV system configurations (grid-connected, stand-alone, bimodal, and hybrid) and their components and various types of energy sources that can be coupled with PV systems.
- Explain the roles of various segments of the PV industry and how they interact with one another.
What is due for Lesson 1?
Lesson 1 will take us one week to complete. Please refer to the Calendar in Canvas for specific time frames and due dates. Specific directions for the assignments below can be found within this lesson and/or in Canvas.
Complete the following Lesson Assignments:
- Complete the Course Orientation [2]
- Read through the Lesson Content
- Complete the Required Reading Assignments:
- Chapter 1, Photovoltaic Systems by James P. Dunlop (text)
- Look over the Recommended Readings:
- Solar Enegy: Mapping the road ahead (IEA 2019) [3]
- SEAI Research, US Solar Market Insight Report [4] & SEIA solar industry research data [5]
- Major Solar Projects in the United States Operating, Under Construction, or Under Development Updated [6]
- International Renewable Energy Agency (IRENA) Annual Review [7]
- Shared Solar: NREL page [8]
- Download simulations and complete the ungraded exercise
- Participate in the Lesson 1 Discussion
- Take the Lesson 1 Quiz in Canvas
Questions?
If you have lesson specific questions, please feel free to post to the Lesson 1 Questions discussion forum in Canvas. While you are there, feel free to post your own responses if you, too, are able to help a classmate with a question. If you have questions about the overall course or wish to share and discuss any "extra" course related commentary (interesting articles, etc.), please feel free to post to the General Questions and Discussion forum.
Review
Some of the content in AE 868 is directly related to topics that are already discussed in other courses. However, these topics are essential building blocks on what we will cover in AE 868. Many lessons will begin with a list that links out to these relevant topics. Please take the time to review the topics here or where noted throughout the lesson.
- EME 810 (Solar: the Response to Energy Constraints) [9]
- EME 810 (Frameworks for Including SECS) [10]
- EME 810 (The Power Grid System) [11]
- EME 810 (Economic Figures of Merit - LCOE) [12]
- EME 812 (1.1 Solar Energy Conversion - Overview) [13]
- EME 812 (1.3 Utility Scale Power) [14]
- EME 812 (5.1. What are concentrating photovoltaics?) [15]
- EME 812 (5.4. CPV Market overview) [16]
- EME 812 (Lesson 6.2. Main components of the PV systems) [17]
- EME 812 (7.1 Introducing Concentrating Solar Power) [18]
SECS and Solar Electricity Systems
Sun is an abundant source of energy that is capable of supplying sustainable energy to all of humanity. After you have familiarized yourself with the material in the "Review" section of this lesson, you can see that Solar energy can be used for different types of applications that range from a basic solar cooker to photovoltaic technology. A summary of the most common usages of solar energy is shown in Figure 1.1.
Solar Energy Technologies/usages
There are various applications of solar energy conversion systems. The first is seen in conjunction with photovoltaic technology and directly converts solar radiation into electricity. The second converts solar energy into heat for such applications as solar hot water, passive solar heating, solar space heating or cooling, and solar cooking. Finally, there is the conversion of heat into electricity, or solar thermal electricity, which utilizes concentrating solar power (CSP) devices such as reflectors and concentrators.
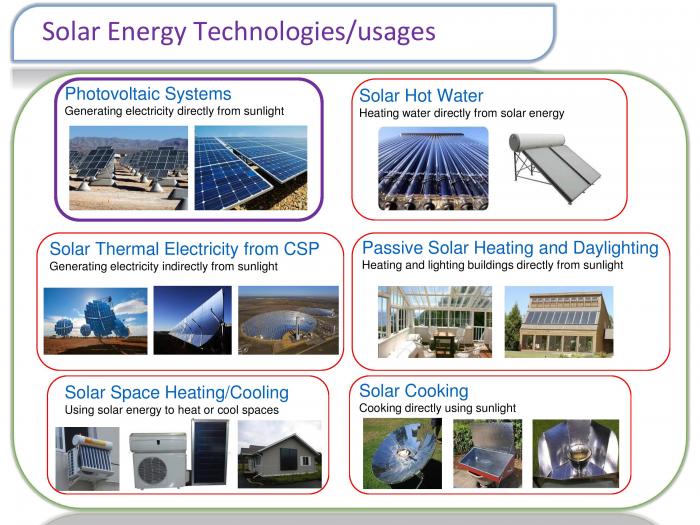
Photovoltaic Systems
Generating electricity directly from sunlight
Solar Hot Water
Heating water directly from solar energy
Solar Thermal Electricity from CSP
Generating electricity indirectly from sunlight
Passive Solar Heating and Daylighting
Heating and lighting buildings directly from sunlight
Solar Space Heating/Cooling
Using solar energy to heat or cool spaces
Solar Cooking
Cooking directly using sunlight
Since solar energy seems to be a valid option for most of our everyday needs, why don’t we use solar to electrify the entire world?
Although solar energy is abundant, a list of historical factors played a huge role in the development and implementation of solar conversion systems that are not the focus of this class. However, recently there has been exponential growth in research, development, and implementation of different SECS worldwide.
As can be seen from Figure 1.1, Photovoltaic (PV) and Solar Thermal Electricity (STE) are the main technologies that are widely used to generate electricity from the sun and which utilize receivers and concentrators, as discussed earlier in other classes found via the Review page in this course. STE uses Concentrating Solar Power technologies (CSP) to focus direct light and convert it into thermal energy and then finally convert it to a usable Electrical Energy, while Solar Photovoltaic systems (PV) directly convert solar radiation (both direct and indirect) into electricity. Finally, there is a new trend in PV utilizing lenses to concentrate solar radiation for higher efficiency while using more advanced PV technology to convert sunlight into electricity. That technology is referred to as Concentrating Photovoltaic, or CPV for short.
Review
To learn more about the CPV and CSP please refer to "EME 812 (5.1. What are concentrating photovoltaics?) [15] and EME 812 (7.1 Introducing Concentrating Solar Power) [18]." (Note: links are also located on the Review page of this Lesson.)
Let's return to the question, "Is solar energy considered a valid option for electricity generation?"
In order for us to answer that question, we need to take a look at some data gathered by the International Energy Agency (IEA). In their Photovoltaic roadmap and Solar Thermal Electricity roadmap in 2014 (links available under "Required Readings" on the first page of the lesson), IEA discussed the potential for electricity generation from solar energy in large scale. Recently there has been a significant increase in the share of solar electricity installations that contribute to the global electricity grid. Some countries are more progressive and others are trying to follow the lead. For the purpose of this class, we will start with some facts about one of the fast growing and emerging solar markets in the world, which is the US market, and the factors that affect the development of such new technology in the energy market. But why are we saying solar in the U.S. is a growing market?
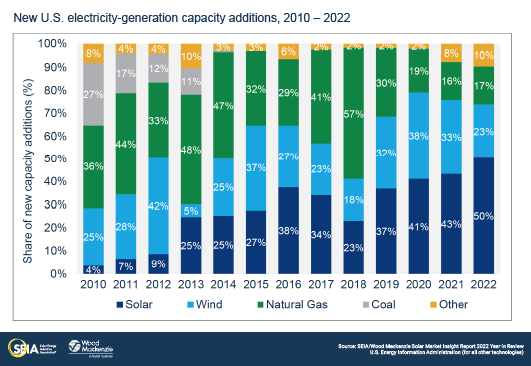
Observing the added capacity percentage of different energy sources within the period from 2010 to 2022 in the US, we can see that Solar is gaining more of a percentage share (an increase from 4 percent in 2010 to 50 percent in 2022) when compared to traditional fossil fuel sources, such as coal or natural gas, as illustrated in Figure 1.2. The promising news about renewable energy and Solar in particular is that the majority of the recently added electricity comes from renewable resources, including Solar. Recently, most utilities are retiring their coal plants and more are interested in Solar power. As we can tell That said, the next few years will witness more solar installations, and the target expected by the IEA by 2050 can be achieved.
Readers are encouraged to read more about the market insights from the SEIA Research website linked below the figure.
PV Market in the US and Worldwide
Tracking the recorded PV installation, the International Energy Agency (IEA) found that by 2014, the world had added PV with total global capacity that overtook 150 (GW). That is enough to power the entire country of Germany. To understand the bigger, global picture, it is enough to power over 50 developing countries the size of Costa Rica. More recently, the global installed capacity of PV solar exceeded 609 GW according to IEA 2019 solar energy report and the US. Let's move to the United States, according to an SEIA research market insight report in 2022, the total PV installations surpassed 149 GW. According to the "IEA PV roadmap published in 2014," by 2050, PV will provide 16 percent of the world’s global electricity production. We believe all these predictions will happen much sooner.
For most of us, the reasons behind the exponential growth in the PV capacity in the U.S. in the last decade is still not clear. In order for us to understand the reasons behind this fast implementation, we need to track the PV technology prices and investigate how the market is affected by price changes.
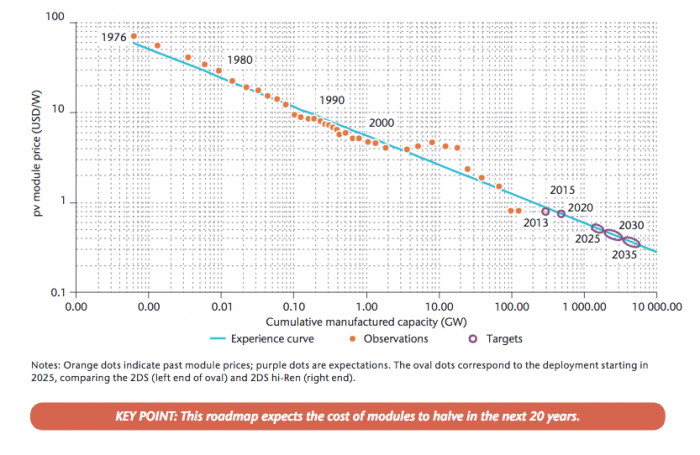
If we consider the time period between 1976 and 2035 on a logarithmic scale and draw the PV module prices versus the cumulative manufactured capacity in (GW), we can see that PV module prices have dropped significantly since the early 1970s. As illustrated in Figure 1.3, it can be seen that the price has dropped from close to 100 dollars per watt of handmade technology in the 1970s to less than 50 cents per watt these days. SEIA market insight report has the most up-to-date module and cell prices. Readers are encouraged to visit their website for more information.
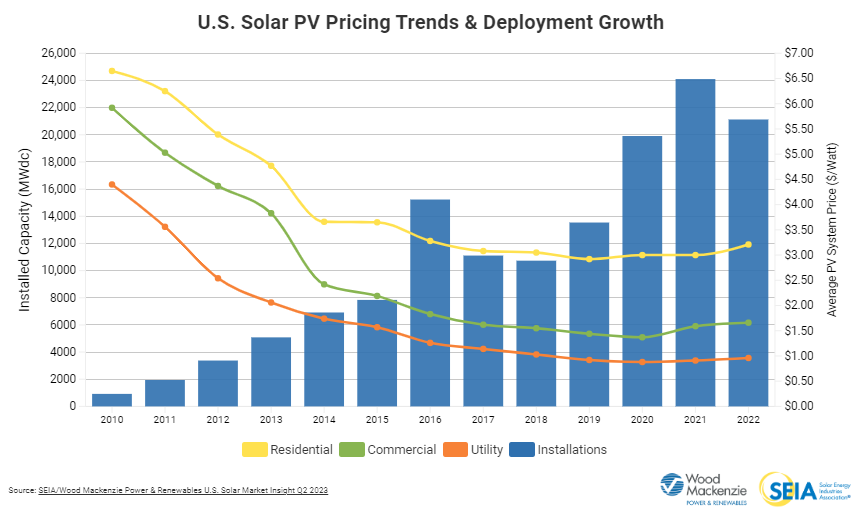
Another factor that plays a large role in PV module prices is installation capacity. Observing the relationship between blended average PV price per watt and PV installed capacity in (MW) within the period between 2010 and 2022, we can see (in Figure 1.4) that PV prices are directly influenced by growth in installation capacity so that the installation cost dropped more than 70% since 2010. According to the IEA PV roadmap published in 2014, PV LCOE reached a level below retail electricity in some countries while it is approaching grid parity, and that makes perfect economical sense for investors.
Review
To learn more about LCOE, please refer to "EME 810 (Economic Figures of Merit - LCOE) [12]." (Note: link is also located on the Review page of this Lesson.)
In addition to the technology being more affordable, in most countries, the incentives programs have a huge impact on pushing installations forward, which is thoroughly discussed in EME 810's Lesson 9 content -- Energy Portfolio Standards and Government Incentives. To highlight some initiatives as an example, the U.S. Department of Energy's "SunShot Initiative", launched in 2011, supports innovation in manufacturing to help attract new facilities to reduce system cost. In order to make solar electricity cost-competitive, the soft cost needs to reach the targets of the Sunshot Initiative by 2020: USD 0.65/W for residential systems and USD 0.44/W for commercial systems. When all system costs are reduced, SunShot's cost target was put to reach LCOE of $0.06 per kilowatt-hour for utility scale PV, and by the end of 2017, the goal was achieved. The U.S. Department of Energy Solar Energy Technologies Office (SETO) [22] is working toward a levelized cost of $0.02 per kilowatt-hour (kWh) for utility-scale solar photovoltaics, $0.04 per kWh for commercial PV systems, and $0.05 per kWh for residential rooftop PV systems by 2030.
PV Market Segments
After we established that the predominant solar energy technology is mainly Photovoltaic (PV) technology, it is important to understand how PV installations are classified. PV can be classified into three main segments:
- Residential
- Non-residential (including Commercial and Community Shared solar)
- Utility scale
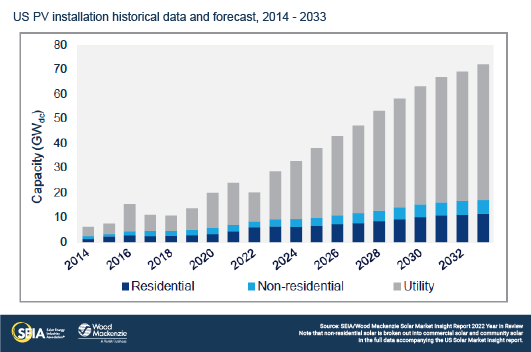
Each of these sectors has its targeted market, but it helps to understand the market share of each sector. If we track annual PV installation capacity for different solar PV sectors from 2014 to 2022, we can see, in Figure 1.5, that the PV utility scale sector has the biggest share in the PV market since 2014 and is second when it comes to the residential PV sector. We can see that the non-residential sector has leveled for several years, while both residential and utility scale installation demands are soaring.
Moving to the PV installations by state, you can see that some northeast states are big on Residential and Commercial (non-utility) PV while California, Texas, and Florida, for example, have mainly Utility scale PV installations. The question remains: why? Is utility scale solar better than residential?
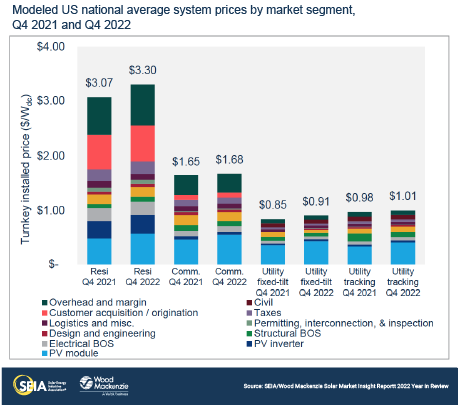
If we compare turnkey-installed PV cost per watt for different market sectors, we can see that utility scale PV installations have the lowest cost. Due to economy of scale, non-residential installations are second lowest. It can also be seen that residential installations have the highest soft costs when compared to the rest of the sectors shown in Figure 1.6. This explains why utility scale PV is more attractive to utilities and investors; we can see that the installed cost for utility scale PV is much lower than both residential and non-residential systems.
Reflection
We can also observe from Figure 1.6 that PV module price is almost the same for all sectors, and that is an important point on which to elaborate since the module is the most important piece in the PV system. As we can see from Figure 1.6, we are talking about module cost, but since all modules are made of cells, the question remains: is there a difference in cost between cells and modules? And which one of them do you look for as a solar designer? Refer to SEAI Reports in 2016 [23], 2017 [24], 2018 [25], 2019 [26], 2020 [27], 2021 [28]- Table 2.5 U.S. prices.
ANSWER: It can be seen that module prices are different from cell prices; as designers, you care about the final product, which is the PV module, since it is the product on which you will base your system. We can see from table 2.5 that module prices are falling since 2010 due to the demand in production with new technology in encapsulation and improving manufacturing efficiency and processes. However, the market recently led to a fluctuation in prices.

| Q4 2016 | Q1 2017 | Q2 2017 | Q3 2017 | Q4 2017 | |
| Polysilicon ($/kg) | $14.98 | $16.93 | $14.39 | $16.69 | $18.03 |
| Wafer ($/W) | $0.15 | $0.15 | $0.14 | $0.15 | $0.15 |
| Cell ($/W) | $0.21 | $0.21 | $0.21 | $0.23 | $0.22 |
| Module ($/W) | $0.39 | $0.38 | $0.40 | $0.45 | $0.48 |
Reflection
Zooming deeper into Figure 1.6, we can break down the cost and compare the additional costs associated with PV residential vs utility scale. Discuss these costs and why residential is more expensive compared to other segments.
ANSWER: Residential is more expensive compared to other segments because supply chain and margin is higher in residentials due to the small system size, and permitting and other soft costs play a huge role in the total cost.
Shared Solar (Community Solar)
Aside from the main PV segments we saw at the beginning of this section, where solar power has mostly been available to utilities as utility scale solar plants or to individual home and business owners as rooftop systems for both residential and non-residential sectors, there is a new stream that supports the development of shared solar in communities where homeowners, who are interested in solar but cannot afford it or don’t have space on the roof for PV installation, can share solar with their neighbors and communities to allow everyone to be part of the solar movement.
Shared solar usually consists of a small-scale (few hundreds of kW to few thousands of kW) solar installation that allows multiple individuals to divide their generated power and that allows customers to share ownership of a community-scale PV array, subscribe to the power output of such an array, or both. Of course, there is limitation to subscription systems because electricity markets are regulated in some places.
As for all other PV types, policies and incentive programs are the main market drivers for shared solar.
Market Status (source: NREL page for community solar)
As of December 2021:
- Community solar projects are located in 39 states, plus Washington, D.C.
- 22 states, plus Washington, D.C., have policies that support community solar.
- Community solar projects represent 3,200 megawatts alternating-current (MW-AC) of total installed capacity.
- About 74% of the total market is concentrated in the top four states: Florida (1,636 MW-AC), Minnesota (834 MW-AC), New York (731 MW-AC), and Massachusetts (674 MW-AC).
Recommended Reading
One of the biggest contributors to the four non-residential solar sectors is the rapid rise of community solar installations. This has boosted the non-residential segment in 2016 and 2017, illustrated by increasing numbers of both off-site and rooftop corporate such as Walmart, Apple, Target, and Amazon.
For more information about shared solar, please refer to the following recommending readings:
PV System Types and Components
So after this brief introduction about PV technology and application, it is about time to dig deeper into the components that form this PV system and learn more about the types of systems that can serve various applications.
We can easily observe that not all PV systems are alike in terms of system components, size, and type of application. For example, solar water pumping for rural application, where there is no access to an electricity grid, utilizes components that are slightly different from rooftop solar systems for residential application, where a grid already exists.
So what are these main types and components that form the PV system?
PV System Types and Their Components
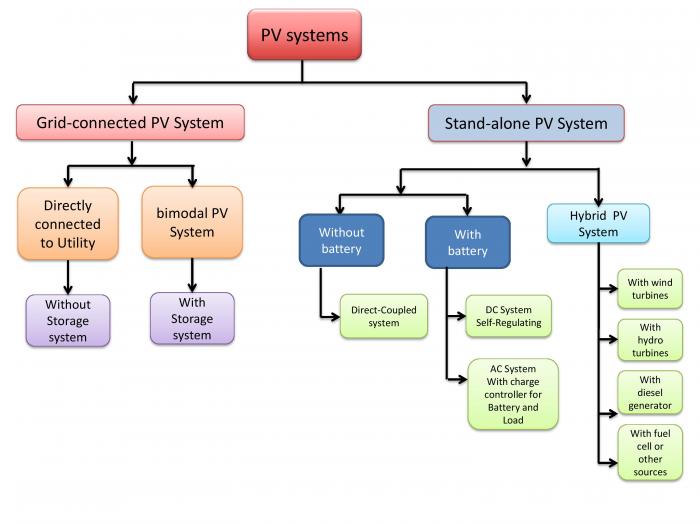
PV systems can be divided into two categories: Grid-connected PV Systems and Stand-alone PV Systems.
Grid-connected PV Systems can further be separated into two categories: those that are Directly Connected to the utility and those that are classified as Bimodal PV Systems.
Systems that are Directly Connected to the Utility are without a storage system, and systems that are classified as Bimodal PV Sytems do have storage systems.
Stand-alone PV Systems can be divided into three categories: Without Battery, With Battery, and Hybrid PV Systems.
Without Battery systems are Direct-Coupled systems, and With Battery systems may include Self-Regulating DC Systems or AC Systems with a charge controller for the battery and load.
Hybrid PV Systems may include systems with wind turbines, with hydro turbines, with diesel generators, or with fuel cells or other sources.
In Figure1. 7 we can see different types of PV configurations that work for both Grid-connected and Stand-alone applications. We can see that the main difference between these two main types is utility grid availability.
Stand-alone PV systems:
All stand-alone (AKA off-grid) systems work in general without the utility grid, as shown in Figure 1.8. It can be seen that we expect a perfect match between the supply and demand, or in other words between PV system size and load requirement. When this match is done perfectly for a single load, the PV system in this case can be called a "Direct-Coupled PV System," and very minimal components are needed without the need for storage systems.
Another type of stand-alone requires a storage system to allow excess energy to be stored when it is not needed by the load and can later be drawn when the sun is not available. This type can be connected directly to DC loads or to AC loads through an additional power conditioning component, or “Inverter,” as we will learn later.
The other common type of stand-alone system is the "Hybrid PV System," as illustrated in Figure 1.9, which uses other energy sources in parallel to the PV array to supply loads. These energy sources can be Wind Turbines, Hydro Turbines, Diesel Generators, or Fuel cells. Hybrid PV Systems can also use Batteries for energy storage.
Grid-Connected system:
This type of configuration is the most common type for applications where clients want to save energy on their utility bills and while the utility grid exists for use when the PV array is not generating any energy. The PV array can be directly coupled to the grid without any storage system and is called “Utility-Interactive PV System or Grid-Tied PV System,” as illustrated in Figure 1.10. Alternatively, it can store excess energy into battery banks for later use, and in this case, it is called a “Bimodal PV System or Battery Backup PV System,” as shown in Figure 1.11.
The following short video walks us through the basics of PV and how it works and shows an example of a grid-connected PV system and the components needed.
Video: How Solar Works (0:58)
As shown in the video, a solar array can be installed on a rooftop for residential application. After all mechanical holding structures are installed on the roof, the solar panels can be fastened to it . When the sun shines on PV panels, photons are converted into electrons that form electrical current when it moves towards the circuit terminals . The electrical DC current then travels through conduits down towards a power conditioning unit (AKA inverter) . The current is converted to AC electrical current and travels through an AC disconnect box . When the AC current exits the disconnect box, it goes through a PV production meter to count energy generated . After that, the current is backfed to the lower side of the Main distribution panel (MDP), where all load circuits are connected, through a protection breakers . When the PV array is generating power, the load circuits draw power from the PV array instead of the grid . While the PV array is generating power, the monitoring device is transmitting the data to an online portfolio, where clients can see their instantaneous PV array performance online . Finally, the excess energy generated from the PV array is returned to the utility grid .
Another example of a 100 percent off-grid system installed on an isolated island is illustrated in the following video.
Video: How Tokelau Switched to Solar Energy (4:21)
PRESENTER: Two billion people on Earth still don't have access to electrical power, like the 1,500 inhabitants of Tokelau, three lonely atolls in the middle of the Pacific, the largest ocean on Earth. You couldn't be further away from a power grid. 500 islanders live on each atoll, not more than a small village.
Until two years ago, diesel generators provided the island with power for household appliances. 2,000 oil drums per year had to be shipped 500 kilometers from Samoa and manhandled from the freighter onto the island, cost per year about $1 million. That is until the Tokelauans found the most obvious solution, the sun, the most powerful energy source available on our planet.
It releases more energy per second than all nuclear power plants worldwide could produce in 750,000 years. And if you are close the equator, like Tokelau, the sun gives away its energy even more generously. That's why, with the help of technicians from New Zealand, the Tokelauans pulled up their sleeves, and installed three solar power plants, one on each atoll with a combined output of one megawatt, enough to switch off the diesel generators and make a better use of the empty oil containers as drums for the dance.
Over 4,000 solar panels have been installed, hundreds of battery inverters that convert the solar current into alternating current. They are the core of the installation and guarantee a secure, reliable, and independent power supply. Over 1,300 batteries with 8,000 kilowatt capacity store the surplus. Thereby, Tokelau has not only the largest off grid power plant in the world, Tokelauans can also be proud to be the first nation on Earth to go what 100% solar, setting an example for the world.
A technician from New Zealand controls the plant from a laptop.
SHANE ROBINSON: We have the ability to completely control this computer from overseas. So if there is ever our fault or a problem that they have a question on, we can dial into the computer and help diagnose the problem.
PRESENTER: The old generators still serve as backup, but nobody wants to go back to using them again.
ROBIN PENE: I remember when I first came here in 1987. There was only about six hours power a day if you were fortunate. So since the 11,000 volt energy has been provided, they've sort of become quite accustomed to the use of energy.
PRESENTER: Of course, kids watch smaller TV now, but 24 hours of power a day also means that the internet is always on, and Tokelauans are not as isolated from the world anymore. For example, this young girl is able to take on an online language course at a New Zealand university without having to travel the 36 hours by ferry and another three hours by plane.
And at last, Tokelauans can afford to have fridges and freezers. The days of fresh catch of fish rots away because of a power outage are long gone. With its switch to solar, Tokelau now holds the number one spot worldwide by having achieved the greatest reduction in fossil fuel use in percent, largest reduction in carbon emissions per person, using more renewable energy than any other country or place.
SHANE ROBINSON: It's great to see a community like this reducing their reliance on fossil fuels, and the amount of time it frees up. They used to have to have someone sitting here maintaining and watching diesel generators all the time, and now they're out fishing.
PRESENTER: More and more islands in the Pacific want to follow Tokelauans by switching to solar energy. Little Tokelau has shown them the way.
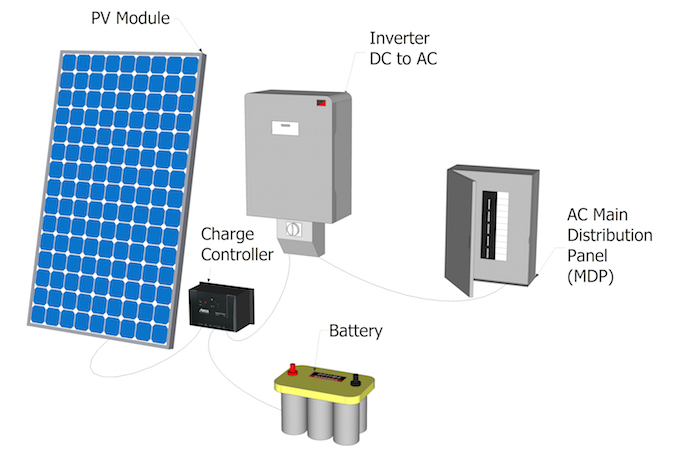
Diagram of a "stand alone AC PV System." It shows the parts of the system and how the energy flows from one to the other. The flow of energy is represented in a list below:
- PV Module
- Charge Controller
- Battery and Inverter DC to AC
- AC Main Distribution Panel (MDP)
- Battery and Inverter DC to AC
- Charge Controller
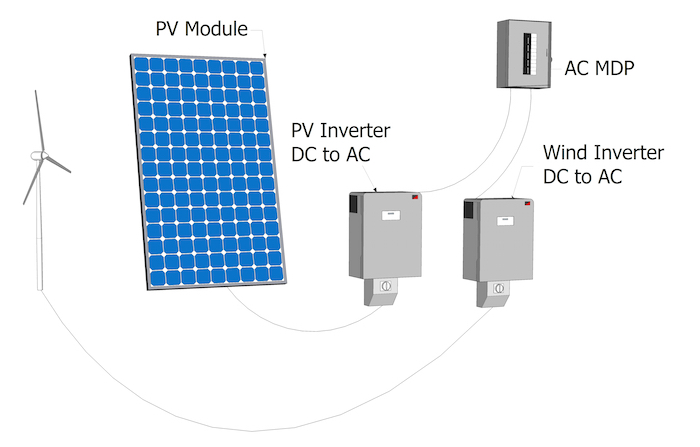
Diagram of a "Hybrid PV System." It shows the parts of the system and how the energy flows from one to the other. The flow of energy is represented in a list below:
- PV Module or wind
- PV Inverter DC to AC and wind Inverter DC to AC
- AC Main Distribution Panel (MDP)
- PV Inverter DC to AC and wind Inverter DC to AC
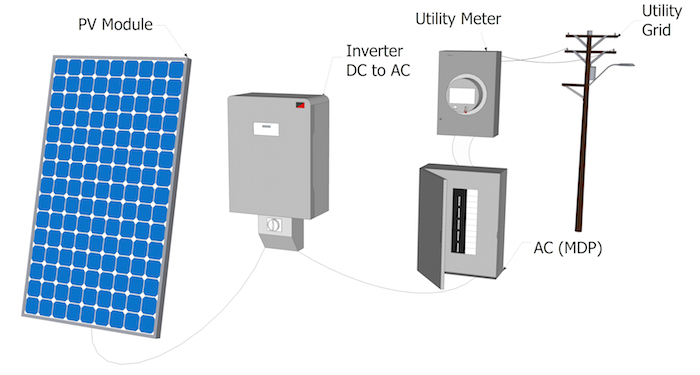
Diagram of a "Utility Interactive PV System." It shows the parts of the system and how the energy flows from one to the other. The flow of energy is represented in a list below:
- PV Module
- Inverter DC to AC
- AC Main Distribution Panel (MDP)
- Utility Meter
- Utility Grid
- Utility Meter
- AC Main Distribution Panel (MDP)
- Inverter DC to AC
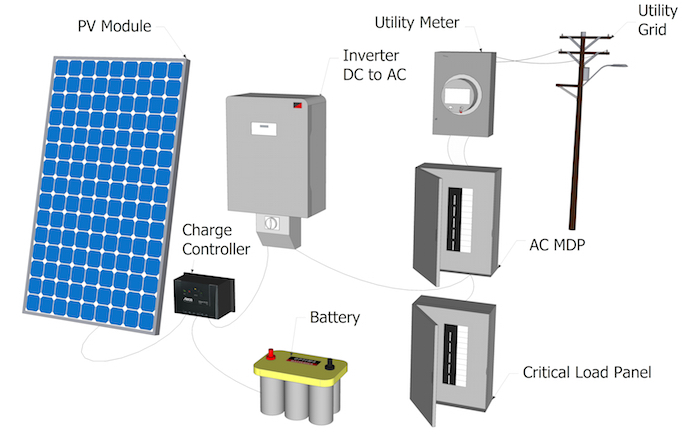
Diagram of a "Bimodal PV System." It shows the parts of the system and how the energy flows from one to the other. The flow of energy is represented in a list below:
- PV Module
- Charge Controller
- Battery and Inverter DC to AC
- AC Main Distribution Panel (MDP)
- Critical Load Panel and Utility Meter
- Utility Grid
- Critical Load Panel and Utility Meter
- AC Main Distribution Panel (MDP)
- Battery and Inverter DC to AC
- Charge Controller
In order for each of the PV system types we discussed in this section to function and deliver usable energy to clients, a number of components are needed to allow energy to be generated, conditioned, stored, and transferred to end users. So what are these components, according to the classification: generation, storage, and conditioning?
Generation:
The main and only component in the PV system that converts solar radiation into electricity is the "Cell" or "Module." We will learn more about that in Lesson 2.
Storage:
Not all energy the PV system generates is used right away, especially when we talk about off-grid systems. So in order for us to maximize the usage of the system, we need some devices to store the energy for later uses, and that is easily done using "Storage devices such as Batteries." We will explain more in Lesson 3.
Conditioning:
Solar PV generates DC electricity, which is not the common form to be used for home appliances and the utility grid in general, which usually uses AC electricity. So in order for us to be able to connect the PV system to the grid we need to change the DC to AC, and that is done using a power conditioning units AKA "inverter." We will discuss this in more detail in Lesson 4.
Review:
General PV system components are extensively discussed in previous classes. You can refer to "EME 812 (Lesson 6.2. Main components of the PV systems) [17]" to review or learn about main components used for PV systems and their functions. (Note: link is also located on the Review page of this Lesson.)
PV Industry Sectors
In order for the PV system to be brought to the client as a final product, dozens of PV industry sectors should work together to achieve this goal. The PV industry is composed of several levels of businesses and organizations. The first level involves manufacturers that usually donors deal directly with clients, but they make the main parts of the PV system, such as Modules, Inverters, Batteries, Balance of Systems. The second level is the medium between the client and the manufacturer, which is referred to as an integrator. The integrator offers services such as engineering design, permitting requirements preparations, installations, monitoring, and operation and maintenance (O&M). Integrators work closely with architects, builders, contractors, and utilities to meet all standards, codes, and regulations. The third level is the installers, who can be either independent entities such as electrical contractors who specialize in PV installations or can also be directly hired by the integrators. Installers are the most visible members of the PV industry, as they are the ones who ensure safe and quality installations.
Finally, there are numerous not-for-profit organizations that advocate their mission to serve and promote the PV industry, such as research institutes, marketers, installer training institutes, and standards development.
With greater market share comes demand for a qualified workforce to help achieve goals, and therefore the U.S. solar job market has soared in the past few years and currently there are around 260,000 people who are qualified or are in training as solar professionals (SEIA press).
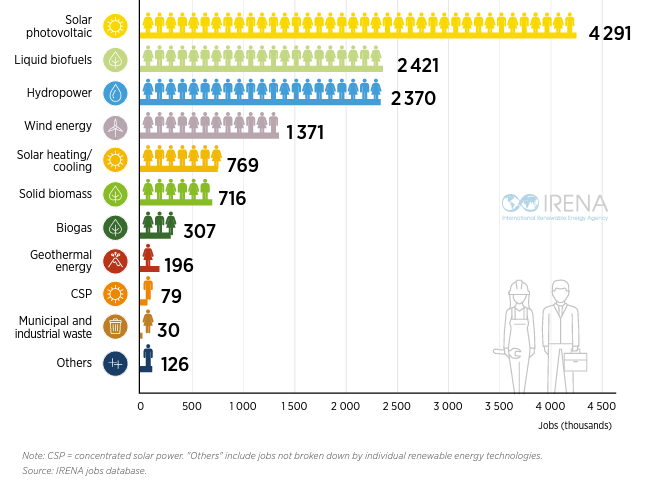
According to the International Renewable Energy Agency (IRENA) Annual Review 2022 [shown below and as Figure 1.12 in the recommended reading for this lesson], by the end of year 2021, there were 12.7 million workers in the field of renewable energy worldwide. The PV industry in on the top of the list with the highest number of employees, accounting for nearly 4.3 million workers worldwide who are involved in PV solar-related jobs. On the same list, the CSP workers were only around 79,000 workes worldwide. This proves the fact that solar PV is the still the predominant renewable energy technology, and the need for more qualified practitioner is strongly needed.
| Industry | Jobs (in thousands) |
|---|---|
| Solar Photovoltaic | 4291 |
| Liquid Biofuels | 2421 |
| Wind Power | 1371 |
| Biomass | 716 |
| Solar Heating/Cooling | 769 |
| Biogas | 307 |
| Hydropower | 2370 |
| Geothermal | 196 |
| Concentrated Solar Power | 79 |
Simulation Exercise
In Lesson 2 we will use simulation software. This exercise requires you to download NREL's System Advisor Model (SAM) [32] and the NREL PVWatt tool [33] for use in the next lesson. This Exercise is ungraded, but it is essential for you to become familiar with these tools to better follow along with the class topics and Lesson Activities.
| Activity | Details |
|---|---|
| Assignment |
Part I: Download SAM
Part II: PVWattTo access PVWatt, you have two options:
Part III: Try Out SAM and PVWatt in a Simulation ExerciseImagine you have a client located in State College, PA. The client wants to install 10 kW using PV technology. You have to come up with the estimated annual, monthly, and daily energy production.
Deliverable: Gather your Result TablesTake a screenshot (including the table) of the SAM result and the PVWatt result. Copy the screenshots into a Word document. Please use the following naming convention: Last Name_First Name L1 Simulation Exercise.docx. Follow the directions below for submission. |
| Submission Instructions |
|
Lesson 1 Discussion
| Activity | Details |
|---|---|
| Assignment | Post original entry: You want to start a solar PV company, so you are looking into different market sectors. You have the following options:
Post comments: Respond to two different opinions of others' posts. (For example, if you choose Option 1, you need to respond to one post for Option 2 and another post for Option 3 or 4.) |
| Requirements, Submission Instructions, and Grading | For more detailed instructions about the discussion component of this course, including how you will be graded, please visit the Discussion Activity [35] page. |
Summary and Final Tasks
Let's go back to our scenario from the beginning of this lesson. You go to the next general meeting for the new solar department lead position. Now that you are loaded with the right information about the solar market, you can easily suggest investing in the PV technology. Furthermore, you realize that depending on the market segment and the size of the utility company you work for, you may suggest considering Utility scale PV systems for large electricity generation. In addition, you are now fully equipped with knowledge and can suggest the industry sector your company can represent within the solar industry.
Even if you decide to start a small solar business, you may consider Residential or Non-residential PV installations or both. Having a design and installation team can help you tap into the right solar industry sector you wish to be part of.
The next lesson will introduce the building block to any PV system, which is the PV "module." We will cover a variety of topics from basic characteristics to factors that affect the performance of PV modules, and finally, the required tests and standards for approved PV module installations.
Reminder - Complete all of the Lesson Requirements!
You have reached the end of this lesson. Before you move to the next lesson, double-check the list on the first page of the lesson to make sure you have completed all of the requirements listed there.
Lesson 2: PV System Components (PV Module)
Overview
Lesson 2 Scenario
Imagine this: you work for the procurement team for a solar company and your director asks you to attend one of the biggest international solar trade shows (i.e.. Solar Power International), where you are networking with PV manufacturer representatives to learn about new material and technology advancement. You come across a Solar Module booth, so you start talking about your team and what types of PV systems you offer to clients. The representative starts going over data-sheets and the series of PV modules they make.
What are the questions you can ask to narrow down your choices of PV modules? Is it PV technology type, efficiency, or the voltage and current of modules that is most important?
You continue walking and stop by other booths, where you get the same exact power rating information from the representatives. Now you have to select a few panels by comparing their specifications. Ignoring the cost of the modules, what factors dictate your decision to select the panel? Is it module efficiency, color, or dimensions?
You leave the trade show with more specification sheets from other PV manufacturers. The next day you need to prepare a report to your director, who needs more numbers to help evaluate each panel. Since it is not easy to test the actual modules’ performance, are there tools or software that you can use to learn more about the annual energy production of these PV modules?
It is obvious to us that PV modules should generate more energy when there is more sun. However, are there any other factors that affect the performance of these PV modules when they are installed? Can it be the orientation of modules or the ambient temperature? Are there any methods to optimize the performance of the PV system?
Since you are a company operating in the US, can any module be installed, or should it meet some kind of test standards and certifications?
In this lesson, we will discuss topics that lead to answers to all the questions in the scenario above. We will enlighten PV designers to look for the best modules that fit their application.
Learning Outcomes
At the successful completion of this lesson, students should be able to:
- Identify PV terminology and key electrical characteristics of PV modules at various operating conditions.
- Interpret a PV module manufacturer's data specification sheet and key parameters for various test standards.
- Discuss factors affecting performance of PV devices and the impact of changing irradiance and temperature.
- Apply strategies to optimize production of PV systems using industrial tools such as Solar Advisor Model (SAM) and PVwatt software to simulate PV output.
- Identify shading effects on PV array and series and parallel connection of modules.
What is due for Lesson 2?
Lesson 2 will take us one week to complete. Please refer to the Calendar in Canvas for specific timeframes and due dates. Specific directions for the assignments below can be found within this lesson and/or in Canvas.
Complete the following Lesson Assignments:
- Read through the Lesson Content
- Complete the Required Reading Assignments:
- Chapter 5, Photovoltaic Systems by James P. Dunlop (text)
- Look over the Recommended Readings:
- Chapter 14, Jeffrey Brownson "Solar Energy Conversion Systems" [36] (*Penn State Login Required)
- Review two articles on the Photovoltaic Education Network:
- Go to PVCDROM [37].
- On the left side of the page under Instructions" click on "7. Modules and Arrays"
- Please review "7.2. Interconnection Effects" and "7.3. Temperature Effects"
- Complete the Lesson 2 Activity
- Begin working on your Procurement Report
- Take the Lesson 2 Quiz in Canvas
*Students who register for this Penn State course gain access to assignments, all readings, and instructor feedback, and earn academic credit. Information about registering for this Penn State course is available through the Renewable Energy and Sustainability Systems Online Masters and Graduate Certificate Programs Office [38].
Questions?
If you have lesson specific questions, please feel free to post to the Lesson 2 Questions discussion forum in Canvas. While you are there, feel free to post your own responses if you, too, are able to help a classmate with a question. If you have questions about the overall course or wish to share and discuss any "extra" course related commentary (interesting articles, etc.), please feel free to post to the General Questions and Discussion forum.
Review
Some of the content in AE 868 is directly related to topics that are already discussed in other courses. However, these topics are essential building blocks on what we will cover in AE 868. Many lessons will begin with a list that links out to these relevant topics. Please take the time to review the topics here or where noted throughout the lesson.
- EME 810 (Lesson 2: Collector Orientation) [39]
- EME 810 (Lesson 2: Sky Dome and Projections) [40]
- EME 810 (Lesson 2: Applying Shading to a Solar Chart) [41]
- EME 810 (Lesson 6: Project Locale) [42]
- EME 812 (Lesson 3: Tracking Systems) [43]
- EME 812 (4.1 Photovoltaic effect) [44]
- EME 812 (4.2 P-N Junction) [45]
- EME 812 (4.3 How PV performance is measured) [46]
- EME 812 (4.4 PV systems across scale) [47]
- EME 812 (4.5 Types of PV technology and recent innovation) [48]
- EME 812 (6.2 Main components of the PV systems) [17]
- EME 812 (11.3 DC/DC Conversion) [49]
PV Module Performance Characteristics
We recall from previous classes that in order for us to understand Photovoltaic technology, we need to understand its main properties at the cell level such as the Photovoltaic effect, the P-N Junction to simply convert light into electricity, and how PV performance is measured in terms of current and voltage (I-V) curve, Filling factor (FF), and efficiency.
In this section, we will revisit some of these performance characteristics, such as I-V, P-V, FF, and efficiency, at the module level.
Before we start, let us define some of the commonly used terminologies in solar at the system level.
Review:
To learn more about the basics of PV in detail, you can refer to EME 812 (4.1 Photovoltaic effect) [44] and EME 812 (4.2 P-N Junction) [45].
Modules and Panels
In this lesson, we will focus on the centerpiece of any PV system, which is the PV module. Solar modules or solar panels are two commonly used terms in the solar industry. Many people use these terms interchangeably, but there is a small difference that should be discussed. A module is the series and/or parallel interconnection of solar cells in a circuit, on a panel. The term solar panel is more exclusive to the rectangular, rigid packaging frame. Most standard crystalline modules can be called solar panels. In general, all solar panels are solar modules, but the opposite is not always true. For example, a thin-film silicon solar cell that is packaged as a flexible laminate is a solar module, but it is not a panel.
Array
Another important term to consider is PV array. When modules are installed as a system, that layout is called an array. Arrays can also be connected in parallel or in series similar to modules and cells.
Review:
To learn more about cell series and parallel characteristics, you can refer to EME 812 (4.4 PV systems across scale) [47]. In addition, Chapter 14 of Jeffrey Brownson's Solar Energy Conversion Systems dives into more of these terms in greater detail. (Note: a link to the reading is available under "Recommended Readings" on the first page of the lesson.)
A Module's Main Parameters
Since a solar module is nothing but an interconnection of solar cells, similar parameters are defined such as module Efficiency, module Fill Factor, Maximum Power Point (MPP) Voltage and Current (Vmpp) and (Impp), Open Circuit Voltage (Voc), and Short Circuit Current (Isc).
Voltage and Current of a Module
As we can see, the total voltage of a PV module is nothing but a scale version of the cell voltage (multiplied by a number of cells connected in series), while the total current is a scaled version of the cell current (multiplied by a number of strings of cells connected in parallel).
Module I-V characteristics
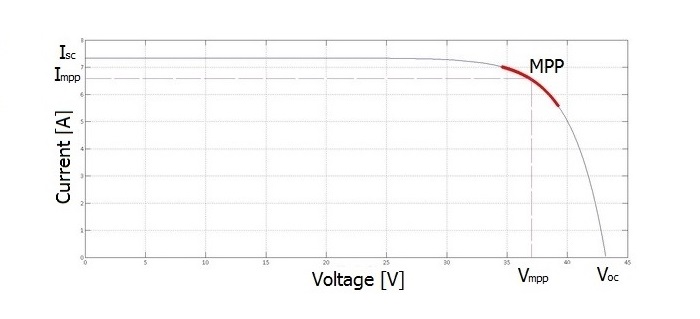
Previously, we learned about the I-V (J-V in some references, “J” being the current density, current per unit area) curve at the solar cell level. However, in PV systems, we are more interested in the total current and voltage that the PV module can generate, so we define the Module I-V curve, or the current-voltage curve, as it is illustrated in Figure 2.1. The curve indicates the voltage and current at different operating conditions. For example, the highest current corresponds to the short-circuit condition (when a PV module's positive and negative terminals are connected without load, causing very high current to pass), while the highest voltage occurs at open-circuit condition (when a PV module's positive and negative terminals are not connected to any load, causing no current to pass). If we observe the current and voltage starting at the open-circuit condition (where voltage is maximum and current is zero), and as we increase the load of the circuit, the current starts increasing and the voltage falls down until it reaches the value of zero at short-circuit condition (where the current is maximum). The knee of the curve indicates the operating condition in which current and voltage result in maximum power point (MPP). The voltage and current values at MPP are referred to as "Vmpp” and “Impp,” respectively.
Review:
To learn more about the current and voltage relationship in detail, you can refer to EME 812 (4.3. How PV performance is measured) [46].
Module P-V characteristics
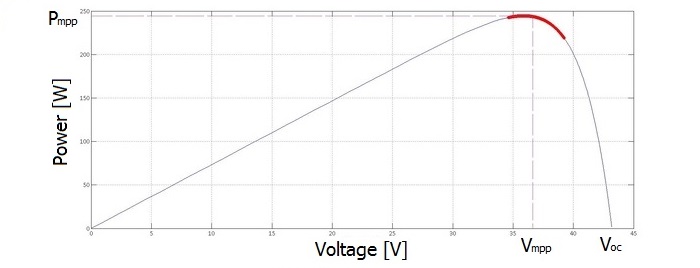
Another way to visualize the I-V curve is to convert it to a relationship between power and voltage. In this case, we can call it (P-V) curve of PV module, as shown in Figure 2.2. Similar to an I-V curve, the highest voltage occurs at the open-circuit condition and the current is zero and the short-circuit voltage is zero at the origin of the curve, but the current is maximum. Since the power is nothing but the voltage times the current (P=VxI), the power at both the short-circuit and open-circuit conditions is equal to zero since either voltage or current equals zero at each of these points. If we observe the power and voltage starting at the open-circuit condition (where the voltage is maximum and power is zero), and as we increase the load of the circuit, the power starts increasing and the voltage falls down until it reaches the value at MPP (where power is maximum). If we increase the load further, the voltage keeps falling down. However, the power will decrease as well until it reaches the value of zero at short-circuit condition (where the both voltage and power are zero). It can be seen that it is much easier to find the peak power on the P-V curve in comparison to the I-V curve, as it resembles a hump. The power at MPP is referred to as "Pmpp."
Reflection
In Figures 2.1 and 2.2, what does the highlighted red line on the I-V and P-V curves refer to?
ANSWER: The highlighted red line shows the range the voltage can vary around the Maximum Power Point (MPP).
Other Parameters of PV Modules
But what about the other parameters, such as efficiency and fill factor of a solar module? Do they increase, decrease or stay the same in comparison to the cell values? Ideally, all cells have similar characteristics with no mismatching losses; in this case, we expect the efficiency and fill factor at both of the module and cell levels to be the same. But this is not true in practice due to various factors that play a role when cells are interconnected, such as the series resistance caused by contacts soldering between cells. Furthermore, there might be a small manufacturer mismatch in the characteristics of the cells that are interconnected. In this case, the cell with the lowest current in the string in series dictates the current of the module. Similarly, the cell with the lowest voltage in parallel dictates the voltage of the module. This mismatch in cells can be a result of the non-homogeneity of the cells due to mass production.
Another main cause of mismatch occurs when a module is:
- partly shaded, or
- has non-uniform irradiance, or
- has non-uniform heating on the cell level.
Therefore, each module in practice performs a little different compared to the expected performance of the ideally matched solar cells.
So how does this affect the parameters of the Module?
Most module manufacturers list in their datasheets the difference between module and cell level efficiency. For example, the datasheet of the Sanyo HIT-N240SE10 [50] module states that cell efficiency is 21.6% and that module level efficiency is around 19%.
Review:
To learn more about the cell technology and efficiency in detail, you can refer to EME 812 (4.5 Types of PV technology and recent innovation) [48].
Wiring within a PV Module and the Shading Effect
Cells layout in a PV Module
PV modules consist of cells, which are sensitive to solar radiation. In order for us to maximize the solar utility of this module when it is installed, we should understand how these cells are wired inside the PV module. Furthermore, it is important to define the factors that contribute to the performance of these cells.
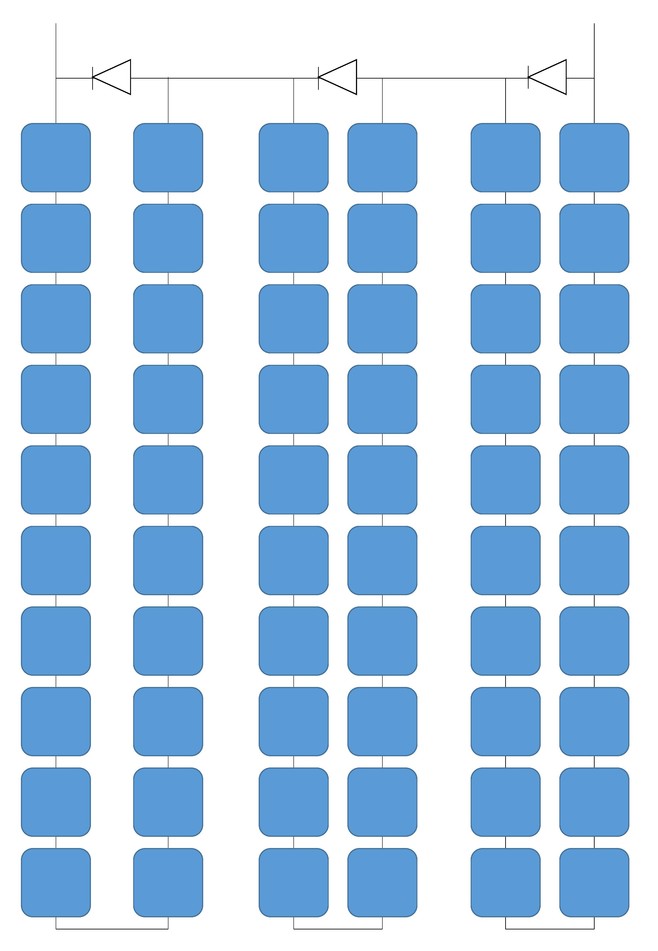
This section will discuss how shading affects the output of solar modules and will also discuss the available solutions to overcome that issue. First of all, let’s start with the wiring of PV cells inside a PV module as shown in Figure 2.3, where the cell connections for a typical commercial 250W panel with 60 cells is illustrated. The PV cells are divided into three groups, and each group of 20 cells has a dedicated bypass diode (illustrated with the triangular shape on top of each group that will be discussed in the next section). When all PV cells are wired in series (the positive of the first cell connects to the negative of the second cell) and then encapsulated within a frame, it forms a PV module with two terminals that are referred to as the positive and negative terminals.
As we expect, all cells are wired in series to get to the desired voltage level of the PV module. However, this series connection raises an issue that when one cell is not generating power due to shading, for example, it will not be able to generate the same amount of current that other similar (unshaded) cells generate. And due to series connection, the total current of the module will be dictated by the weakest cell (shaded). As a result, that will create power loss due to current restriction. In addition, when the higher current generated by unshaded cells tries to pass through the shaded cell, the shaded cell might act like a load and the temperature will increase, and that might lead to a phenomenon known as “hot spot.” Hot spots cause physical damage within the module, like melted cells, cracked glass, or changing characteristics of cells.
Reflection
Why does a shaded cell in series act like an electrical load?
ANSWER: The electrical explanation is that the shaded cell will work on reverse-biased diode mode when connected in series with active cells, that will result in it acting like a load instead of a solar generator.
Bypass Diode
With this said, there should be a solution to protect the modules and cells from the hot spot and also improve the extracted output power when cells are shaded. This can be resolved by adding a “bypass diode” across the shaded cell. In this case, the diode will pass the current and no current will go through the shaded cell. This leads to another important question, how do manufacturers add bypass diodes? Do they add to each cell within the module?
Reflection
How does the bypass diode works, and how dies current pass through it instead of the shaded cell?
ANSWER: When a diode is wired across a cell or group of cells, it is chosen to have the forward biased voltage equal the cell voltage. When the cell is not shaded, it generates voltage that will apply across the bypass diode in reverse biased that will lead to the diode not allowing current to pass through it. When the cell is shaded, its voltage drops across the diode, and that will allow forward biased to apply over the diode. This will lead to the current passing through the diode instead of the shaded cell.
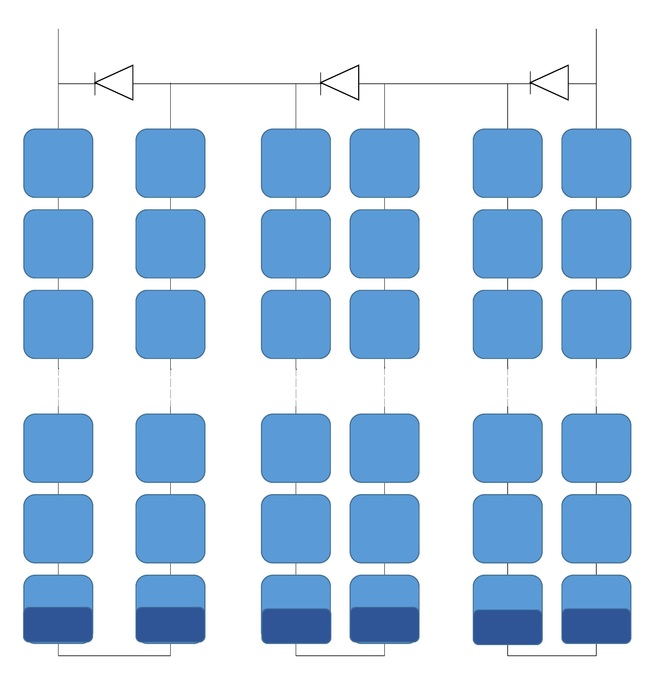
A bypass diode to each cell is not an economical question, and due to the layout of the cells on the panel, the optimal way the bypass diodes are added is as illustrated in Figure 2.4. We can see that the module is divided into groups of cells and each group will have a single bypass diode. In our particular example, we have 3 bypass diodes for the 60 cells module so each 20 series connected cells are protected by one bypass diode.
Is there a difference when cells are shaded with different patterns across the module? Yes - there is a significant impact of the shading pattern, and that is due to the way the bypass diodes are physically connected. Let’s discuss this example: What if only one cell is shaded, as shown in Figure 2.4?
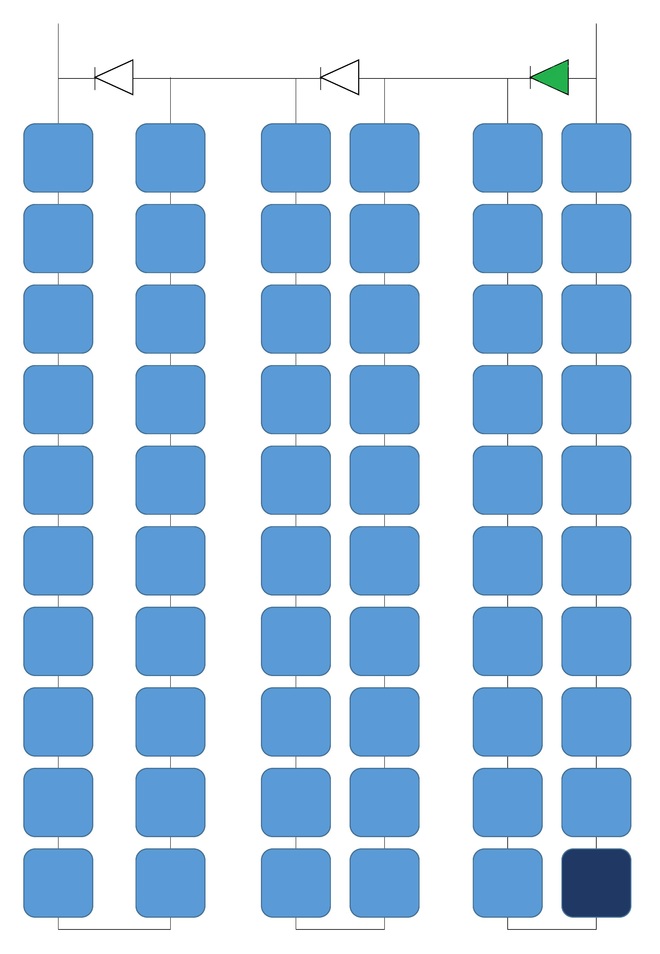
In this case, the string with the shaded cell will not contribute to the total voltage and power of the module; we can estimate that the module might lose 30% of its voltage and power.
Reflection
How does one partly shaded row that shades an equal number of cells from each group affect the voltage of the module?
ANSWER: In this case, the module will not lose voltage since the groups are equal in voltage and none of the bypass diodes will be activated. However, the current flowing through each group will be limited to the lowest current of the weakest cell. The shading pattern is shown in Figure 2.5.
Wiring at PV Array and Shading Effect
Connections at the Module Level
Now that we have covered the basics of series and parallel connections of PV cells when we discussed the I-V characteristics, it is time to understand the bigger picture by investigating the connections at the module level. In this lesson, we will define a new commonly used term in the solar PV industry, which is the PV string. We will look at how the total voltage and current characteristics change as a result of these formations. In addition, we will discuss how characteristics are affected by the pattern of shading applied to the PV system.
A PV string is formed when multiple modules are connected in series. In this case, the string I-V curve is the same as the individual I-V curve of each module, but it is scaled in voltage by the number of modules connected in series while the current stays similar to the individual module’s current. PV strings can be as small as one module, or can have multiple numbers of modules in series. When strings are combined in parallel form, that leads to a scaled current by the number of strings, while voltage equals the individual string’s voltage. A PV system can consist of a single string or multiple strings, depending on the size of the system.
Blocking Diode
Moving to the shading effect on PV systems, similar to the modules level effect, when one module is shaded within the string, the entire string can lose power by the restriction of current flowing through the string. As the modules solution suggested, the bypass diodes will clear the shading effect by bypassing the shaded module. As a result, that will have a voltage drop impact on the total string voltage that may interfere with the other parallel strings within the system, since equivalent array voltage is dictated by the string with the lowest voltage.
Reflection
What about the scenario when we have a row of shading that covers the same number of modules on each string?
ANSWER: In this case, all strings will experience a voltage drop in the same amount, and that will be a better scenario than having one shaded string.
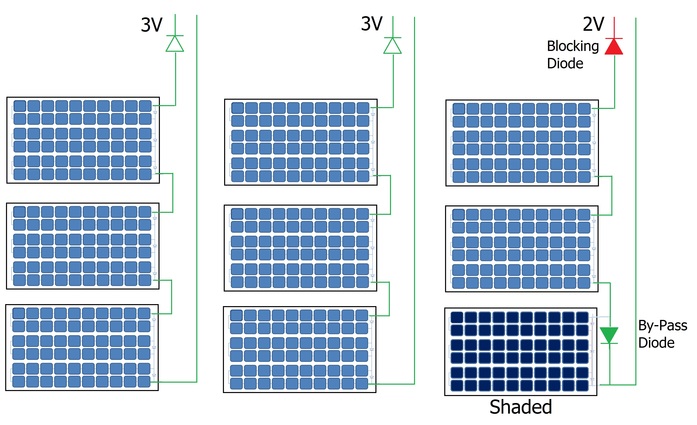
For that reason, some designers choose to add a blocking diode to prevent the current from flowing back to the weak string, and that will eliminate fire hazards as well. Figure 2.6 illustrates the bypass and blocking diodes at the system level and how the total voltage is affected by it. We can see nine PV modules wired to form a PV array. Each group of three modules is connected in series to form a string, for a total of three strings. Each module uses a dedicated bypass diode that only actives when the module is shaded. For example, in Figure 2.6, there is a green colored triangular shape that represents the bypass diode. That is associated with the shaded module illustrated in dark blue in the bottom left corner of Figure 2.6. We can also see red colored triangles that represent the blocking diodes in series with each group to protect the entire string. Assuming each module generates 1V, the unshaded strings generate a total of 3V while the shaded string can only generate 2V (due to the bypass diode effect ). In this case, the blocking diode will protect the shaded string from draining current from the unshaded strings.
Reflection
How does a blocking diode help for PV systems with batteries?
ANSWER: When the sun is not shining, PV modules can act like a load at night. Current can flow back to the PV module so the blocking diode prevents the current from flowing back into the modules and damage it.
Design Recommendations
Finally, as PV designers, we should avoid all types of shading that includes:
- Inter-row shading: as discussed in EME 810 (Lesson 2: Applying Shading to a Solar Chart) [41].
- Soft shading: that can be caused by Trees and moving objects. A solution to that is Tree trimming.
- Hard shading: such as chimneys or pipes, and this should be completely avoided for optimum design.
Review
You may refer to EME 812 (4.4 PV systems across scale) [47] for more information about the cell connections within modules and to visualize how array and strings are formed.
Irradiance and PV Performance Optimization
Performance at PV System Level
Improving module efficiency is only one way to extract more energy from the module. However, what matters ultimately is the energy yield of the PV at the system level. So the question is: What can we do at the system level to increase the yield of PV systems?
Besides the semiconductor material used for PV modules, there are only two parts that play roles in improving the performance of a PV system: electrical and mechanical. The electrical part is responsible for tracking the maximum PowerPoint (MPP), which is a tool to ensure that the PV module operates at the MPP on its I-V curve under a given set of irradiance and temperature. This unit is not something a designer can optimize or change to improve performance during the design phase of a PV system. For those who are not familiar with MPP tracker, you may refer to EME 812 (6.2 Main components of the PV systems) [17] and EME 812 (11.3 DC/DC Conversion) [49].
The other piece is the mechanical part of the PV system that indeed can be optimized by the designer to improve the amount of light falling on a PV array. The simplest way to maximize the solar utility is done by physically changing the orientation and tilt angle of the module, as discussed in EME 810 (Lesson 2: Collector Orientation) [39] and EME 810 (Lesson 6: Project Locale) [51].
As a result, we see the need for tracking the sun using a mechanical tracking system. You may refer to EME 812 (Lesson 3: Tracking Systems) [43] for details about the types and technologies of tracking systems. As the majority of PV systems are fixed mounted, a single choice for orientation and tilt throughout the year changes depending on the geographical location, as discussed in EME 810 (Lesson 6: Project Locale) [51].
Irradiance and PV output
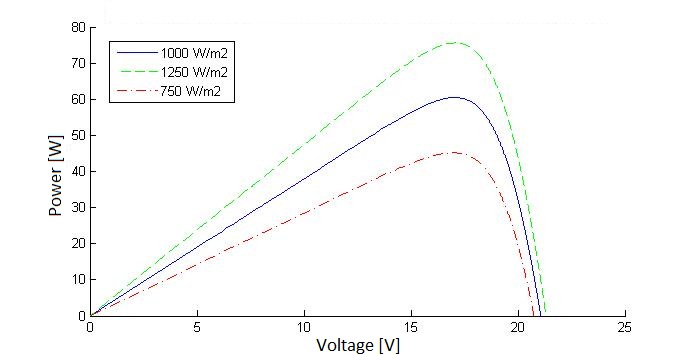
The question remains, how does irradiance affect the PV output? We learned in our review of EME 812 how irradiance and temperature affect the output of a PV cell. A quick recap will tell us that when all parameters are constant, the higher the irradiance, the greater the output current, and as a result, the greater the power generated. Figure 2.7 shows the relationship between the PV module voltage and current at different solar irradiance levels. The image illustrates that as irradiance increases, the module generates higher current on the vertical axis. Similarly, we can observe the voltage and power relationship of a PV module at different irradiance levels. We can see that as irradiance increases, the module is able to generate more power, represented by higher peaks on the curves in Figure 2.8.
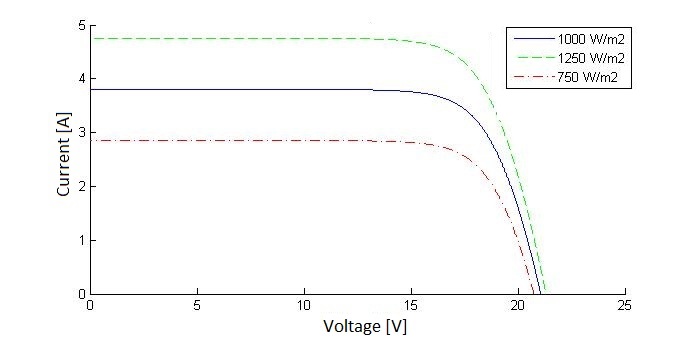
The relationship between irradiance and modules’ current and power can be expressed as the following:;
Where G1 and G2 are the irradiances (in W/m2), I1 and I2 are the modules' corresponding current (in A), and P1 and P2 are the resultant power when irradiance changes (in W).
Tilt and PV Output
The following example illustrates how to find the optimal tilt angle for a fixed mount PV system. If we go to State College, PA and use the chart that was developed in EME 810 (Lesson 2: Sky Dome and Projections) [43] we can see that State College, PA has a latitude around 40.79° in the Northern Hemisphere. In this case, the lowest elevation angle of the sun at solar noontime is around 26° and the highest is around 75°. If we have a tilt tracker, it would vary the range of angles throughout the year between 26° to 75°.
How can we find the tilt corresponding to the maximum yield? This is done using tools developed to calculate the annual energy generation from a PV array given the design tilt and azimuth angles. Some references and designers prefer to set the tilt angle to match the latitude of the selected location as a rule of thumb. However, that does not necessarily maximize the annual energy production of the PV system, as discussed in EME 810 (Lesson 6: Project Locale) [51].
In general, a lower tilt angle helps improve production in the summer months, whereas higher tilt angles favor lower irradiance conditions in the winter months. Designers should take into account the cost of racking and mounting hardware, which can be minimized by lower tilt angle and also minimize the risk of wind damage to the array. So without tedious mathematical calculations, and in order for us to find the optimal tilt and azimuth angles, solar designers can use simple tools developed by NREL. As you were exposed to in Lesson 1, PVWatts is a freely available online design tool and it helps designers calculate the annual energy production using simple parameters to maximize the solar utility for the location.
Going back to State College, PA, and since we have fixed panels oriented towards the South, the optimized tilt angle that will give the maximum energy yield is around 30-35 degrees.
Note:
- For rooftop solar systems, tilt and azimuth usually follow the pitch and orientation of the roof.
- For ground mount systems, not all tilt angles can be provided by the racking structure. For example, if we find optimal tilt for a location to be 34°, but the racking manufacturer has a standard of 30° tilt, designers should take into account the availability of materials and additional cost associated with custom designed racking.
Temperature and PV Performance Optimization
Effect of Temperature on the Module's Behavior
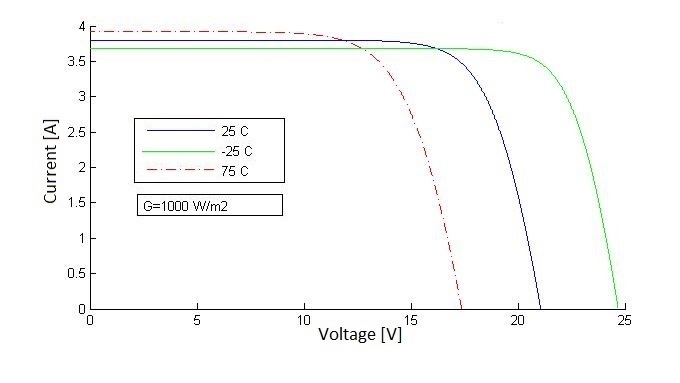
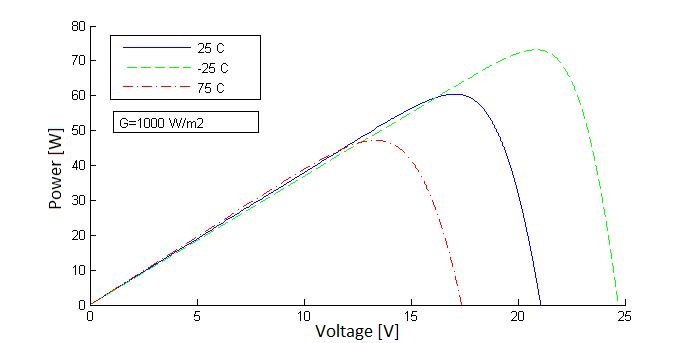
In regard to the temperature, when all parameters are constant, the higher the temperature, the lower the voltage. This is considered a power loss. On the other hand, if the temperature decreases with respect to the original conditions, the PV output shows an increase in voltage and power. Figure 2.9 is a graph showing the relationship between the PV module voltage and current at different solar temperature values. The figure illustrates that as temperature increases, the voltage, on the horizontal axis, decreases. Similarly, the relationship between the PV module voltage and power at different solar irradiance levels is shown in Figure 2.10. We can see that the power decreases as temperature increases, as illustrated by lower power peaks on the curves in Figure 2.10.
Reflection
Why do we see increase in current when the temperature increases, as shown in Figure 2.9?
ANSWER: The small increase in current with temperature can be explained with the fact that carrier concentration and mobility increase in the semiconductor with temperature. In addition, the drop in voltage level can be explained from the basic diode equation [52]. While the temperature affects various terms in the equation, the net effect of temperature is that it decreases the Voc linearly. However, if we check the power values on P-V curves, we can see that a slight increase in current due to increased temperature doesn’t increase the power that much.
The drop in open-circuit voltage with temperature is mainly related to the increase in the leakage current of the photodiode “I0” in the dark with temperature. The “I0” strongly depends on the temperature.
Review
To learn more about the PV performance measure, you can refer to EME 812 (4.3 How PV performance is measured) [46].
The magnitude of voltage reduction varies inversely with Voc. This means that cells with higher Voc are less affected by the temperature than cells with lower Voc, as can be seen when a c-Si based solar cell, with a Voc of 0.65 V, is more affected than the a-Si with a Voc of 0.85 V. If the temperature of the PV module is increased by 10°C, how will the output be affected? The PV module manufacturers specify the temperature coefficients in the datasheets.
Temperature Coefficient
Temperature coefficient is defined as the rate of change of a parameter with respect to the change in temperature. It can be current, voltage, or power temperature coefficient. For example, the temperature coefficient of voltage is the rate of change of the voltage with temperature change. Similarly, temperature coefficient of power is the rate of change of the output power with temperature change. A typical datasheet of a commercial PV module specifies temperature coefficients for the power, Voc, and Isc under STC conditions. (Note: we will discuss the STC test conditions in the next topic).
Temperature coefficient are usually provided by the manufacturers and can be measured in terms of voltage change per degree ( V/°C) or as a percentage per degree change (%/°C).
Given these coefficients, how do we calculate the PV output with respect to the temperature change?
Effect of Temperature Change on Module's Parameters
In order for us to understand the numerical temperature effects on module, we need to define these two simple equations.
The terms Vstc and Pstc refer to the Voltage and Current taken at STC while the temperature coefficients of the voltage is represented by Vt-coeff and Pt-coeff, respectively.
It should be noted that the reference temperature taken for this calculation is the STC temperature (25°C ) as it appears on the equations.
Let's take an example.
If the maximum power output of a PV module under STC is 240 W, and the temperature coefficient of power is -2 W/°C, then the module's power output at a temperature of 30°C can be calculated as follows:
As you can see, the sign of the temperature coefficient determines if the parameter is increasing or decreasing with temperature.
In the previous example, when we said that the temperature was 30°C, did we mean the PV modules temperature or the ambient temperature? Are they equal? The simple answer is that module temperature or the cell temperature can be quite different from the ambient temperature.
Reflection
There could be several factors impacting the heat flow in and out of the modules. What are the factors that impact the heat flow in and out of the module?
ANSWER: One major factor is the cell encapsulation and framing that increase the operating temperature of the PV module. The operating temperature of a module will be a result of the heat exchange between the PV module and the environment. This heat exchange depends on several factors such as ambient temperature, wind speed, heat transfer coefficients between the module and the environment, and the thermal conductivity of the module's body.
Then, how do we estimate the module temperature based on the ambient temperature if we have to account for so many factors? Researchers developed a model provided in literature that gives a reasonable estimate of the module temperature as a function of the ambient temperature. This model is sometimes called the NOCT model, due to the use of the Nominal Operating Cell Temperature. The NOCT is a parameter defined for a particular PV module. NOCT is the temperature attained by the PV cell under an irradiance of 800 W/m², with a nominal wind speed of 1 m/s and an ambient temperature of 20°C.
Here, G is the irradiance at the instant when the ambient temperature is T_ambient. The model gives the corresponding cell temperature as T_cell. As can be seen from this equation, the cell temperature is not only a function of the ambient temperature, but also of the irradiance. This makes things interesting, because if we consider the irradiance and temperature changes over a calendar year, we would see an effect of both irradiance and temperature across the seasons.
Reflection
Is it better to operate PV modules during the summer season or is it better to operate in during the winter season to increase production?
ANSWER: According to what we have just learned, PV modules perform better when the temperature is cooler. In summer, although the sun is shining more, the module is performing worse due to the temperature effects that bring down the PV output at a high cell temperature. In winter, the detrimental temperature effects are far less, although the irradiance levels also fall severely in winter. This means that the best ambient conditions for your PV module would be a cold day with a clear sky.
Temperature and Ideality Factor of PV Modules
So, how serious can temperature affect the performance of PV modules over the year? The difference between the expected PV yield with rated efficiency and the actual yield due to the temperature effect increases the module’s ideality factor, which is nothing but the ratio of the expected PV yield to the actually available, and taking into account the temperature effects.
When the ideality factor of a module is 80%, that means that the module has lost 20% of its annual energy yield due to temperature effects. If the module ideality factor is 100%, that means the module doesn’t change when temperature changes, and that is almost impossible.
Ideality Factor and PV module Type
As a result, we can see that the temperature effect on the module output is a function of the PV technology and the manufacturing process, which collectively decides the temperature coefficients of the PV module. The temperature effect is also a function of the ambient conditions. For the same technology, there could be a deviation in the temperature coefficients due to the manufacturing processes and other design modifications. The a-Si technology shows very low temperature coefficients due to their high open-circuit voltage. This means it shows a better response under high temperatures. However, its efficiency is far lower compared to some of the best c-Si technologies.
According to IEA PV roadmap 2014, c-Si modules have the highest market share compared to other PV technologies such as a-Si. C-Si technologies dominate the global PV market with a share of 90%. In other words, every 9 of 10 PV installation is c-Si modules. If we look closer at the c-Si market, we can see that polycrystalline silicon is the most commonly used technology, according to an EPRI study, with a market share of 60%. This is due to the fact that it is the most efficient in terms of conversion efficiency and economics of scale that make it an affordable solution.
Monocrystalline modules are more area-efficient, but are not the best economical solution. a-Si modules are more affordable, lighter, and sometimes even flexible, but give poorer yield and required more land area.
There is plenty of optimization to be done in order to choose an ideal PV module for your system. The optimum choice will depend on the location, ambient conditions, and of course, taking into account the budget of the client.
Interpreting PV Manufacturer Datasheet
PV modules are the final commercial product that customers buy from manufacturers and that require some data provided from manufacturers to allow customers to evaluate the performance of these modules in terms of electrical power rating, safety, and reliability measures. For that purpose, the module’s performance is set by test standards. These standards vary according to the location where the modules are to be used. For the purpose of our class, we will focus on the US standards -- and some of these standards apply internationally.
Safety
PV modules should be approved/listed by Underwriter Laboratories (UL), which is a nationally recognized test laboratory accepted by OSHA that assures that manufacturers comply with electrical safety standards.
Reflection
What is the UL safety standard that relates to PV modules?
ANSWER: UL 1703 Safety standards for flat-plate photovoltaic modules and panels.
Reliability
PV modules are expected to meet certain quality measures that are set by the international Electrotechnical Commission (IEC). These standards are specific to the technology, e.g., IEC has different standards for Thin-film and Crystalline Silicon.
Reflection
What are the IEC reliability standards that relate to PV Crystalline Silicon modules?
ANSWER: IEC 61215 Safety standards for flat-plate photovoltaic modules and panels.
PV Module Datasheet Parameters
PV module manufacturers are required by NEC and IEC to provide their product with performance information such as the electrical characteristics measures that have to be labeled on nameplates. These parameters include maximum power, open-circuit voltage, short-circuit current, maximum overcurrent device rating, and maximum permissible system voltage. However, these numbers vary according to operating conditions such as temperature and irradiance. For that reason, test standards are needed to set reference operating conditions when taking the measurements at the laboratory.
PV Module and Test Standards
There are various test standards that differ mainly by the operating condition used when taking the measurement. For example, Standard Test Conditions (STC) is an international and most widely used test standard that rates PV modules at solar irradiance of 1000 W/m2, spectral conditions Am1.5, and cell temperature of 25 °C (77 °F). However, in practice, modules rarely operate in these conditions, and that's the main reason behind other test standards that try to simulate real-world operating conditions.
Reflection
What are the other test standards that are used to measure PV performance and how they differ?
ANSWER: The following table shows various standards and the reference values used for each test.
| Name | Abbreviation | Solar Irradiance (W/m2) | Wind Speed (m/s) | Temperature °C (°F) |
|---|---|---|---|---|
| Standard Test Conditions | STC | 1000 | N/A | 25°C Cell Temperature |
| Nominal Operating Conditions | NOC | 800 | N/A | Nominal Operating Cell Temperature (NOCT) |
| Standard Operating Conditions | SOC | 1000 | 1 | Nominal Operating Cell Temperature (NOCT) |
| PVUSA Test Conditions | PTC | 1000 | 1 | 20°C (68°F) ambient Temperature |
So to put everything we have learned so far together, let’s take a look at a PV modules’ datasheet for Trina Solar Allmax 250 W. As can be seen, most module manufacturers have series of modules with different power ratings, and they all appear in the same specification sheet. We can see the main electrical parameters and power ratings at STC and NOCT, efficiency, power tolerance, temperature coefficients, warranty, mechanical dimensions and testing certifications such as UL and ISO and more.
Some considerations when selecting PV modules
Since PV systems are large in size and consist of multiple panels, we expect these systems to be visible to clients, and there will be an aesthetic factor involved in the design process. For example, a client may have a color preference for the PV panels that should be taken into account when selecting the panels, since it might be affected by the availability of that color. Another aesthetic factor is the dimension of each panel and the layout on the roof, for example. A designer should discuss with clients all possible options for best design to maximize the solar utility at that location while keeping the system aesthetically acceptable. Other selection factors are more technical, such as the number of cells in each panel, protection fuses and bypass diodes, degradation, and warranty. All these factors should be taken into account when selecting the right module.
Lesson 2 Activity
| Activity | Details |
|---|---|
| Assignment |
Refer to the scenario on the first page of this lesson. Imagine that, in addition to working in procurement, you are also a solar analyst for this company. You have a client who is willing to invest in a 10kW PV system. The client has three properties in three different cities and he/she is asking for your advice to help choose the right place for the PV system. (Note: the client doesn’t have any preference for the PV modules, installation type, or system orientation. So assume a fixed ground mount with no shading at any of these places). The cities are: Task 2: DeliverablePrepare a report showing both simulation results for SAM and PVWatt. The report is to be no more than one double-spaced page in a 12 point font. Include the following in your report:
|
| Submission Instructions and Grading | Please visit the Lesson Activity [55] page for submission instructions and grading information. |
Procurement Report Part A
This week, you will begin preparing a multi-week Report of the available PV components in the market.
| Activity | Details |
|---|---|
| Assignment | Visit the Procurement Report/Peer Review [56] page for details on the overall assignment. This week, you will be working on Part A. Note: You will not be submitting this part individually. Rather, you will be combining it with Parts B and C for a single Report submission at the end of Lesson 4. In Part A:
|
Summary and Final Tasks
Let's go back to our scenario from the beginning of this lesson. You returned from the solar trade show, where you collected some datasheets for a series of PV modules from different manufacturers. Now that you are fully knowledgeable about the basic information of PV technology types, efficiency, power, voltage and current ratings of modules, you can work on the report needed for your director. In addition, you can confidently recommend the best PV module candidate for the solar firm you work for based on the module efficiency, color, dimensions, test standards and certifications.
As a solar designer, you are equipped with the right tools and software that can be used to learn more about the annual energy production of PV modules and the system at large. These tools help you understand the factors (such as orientation - tilt and azimuth - and ambient temperature) that affect the performance of these PV modules when they are installed. Finally, you can suggest methods to optimize the performance of the PV system.
The next lesson will discuss the bucket of stand-alone PV systems, which is the "Storage System." We will cover a variety of topics, starting from basic characteristics to factors that affect performance. Finally, we will cover the essential parameters and curves that lead to optimal design.
Reminder - Complete all of the Lesson Requirements!
You have reached the end of this lesson. Before you move to the next lesson, double-check the list on the first page of the lesson to make sure you have completed all of the requirements listed there.
Lesson 3: PV System Components (PV Storage)
Overview
Lesson 3 Scenario
At the same international solar trade show, you come across an old friend who represents one of the most well known battery manufacturers in the business. In your conversation, you learn that this company has storage solutions specifically for PV applications.
Assuming you have some PV off-grid projects for which you need battery solutions, the representative starts going over the types of lead-acid batteries they offer, such as flooded lead-acid (FLA) and valve-regulated lead-acid (VRLA). They differ by depth of cycle, maintenance requirements, and other features.
You leave the trade show with more datasheets for other batteries. The next day, you need to present to your director a report with different battery types and evaluations for the performance of each type. You are also expected to recommend the best match for the application your company is working on.
What do you look for when selecting the battery type? Is it the efficiency, operating temperature ranges, or capacity rate?
How do you connect batteries for that application, in series or parallel or both?
In this lesson, we will discuss topics that lead to answers to all the questions in the scenario above. We will provide PV designers with a basic understanding of batteries to help them choose the best battery to fit their application. Although the majority of PV applications are grid-connected, designers may encounter off-grid PV systems with storage systems if they are involved in that market sector. That said, participating in this lesson will put you in the right direction when selecting the right technology for your application and will help you perform basic assessments for optimal design.
Learning Outcomes
At the successful completion of this lesson, students should be able to:
- Identify types of electrical energy storage technologies and how they relate to (Energy or Power) responses.
- Identify battery parameters and specifications including capacity, efficiency, discharge rate, state of charge and depth of discharge.
- Interpret battery manufacturer datasheets to match PV system requirements.
- Describe factors that influence the lifetime of a battery, such as temperature and charge and discharge control.
What is due for Lesson 3?
Lesson 3 will take us one week to complete. Please refer to the Calendar in Canvas for specific timeframes and due dates. Specific directions for the assignments below can be found within this lesson and/or in Canvas.
Complete the following Lesson Assignments:
- Read through the Lesson Content
- Complete the Required Reading Assignments:
- Chapter 6, Photovoltaic Systems by James P. Dunlop (text)
- Look over the Recommended Readings:
- IEA Technology Roadmap Energy Storage 2014 [57] (pages 1-22)
- Take the Lesson 3 Quiz in Canvas
- Continue working on your Procurement Report (Part B)
Questions?
If you have lesson specific questions, please feel free to post to the Lesson 3 Questions discussion forum in Canvas. While you are there, feel free to post your own responses if you, too, are able to help a classmate with a question. If you have questions about the overall course or wish to share and discuss any "extra" course related commentary (interesting articles, etc.), please feel free to post to the General Questions and Discussion forum.
Review
Some of the content in AE 868 is directly related to topics that are already discussed in other courses. However, these topics are essential building blocks for what we will cover in AE 868. Many lessons will begin with a list that links out to these relevant topics. Please take the time to review the topics here or where noted throughout the lesson.
Why Storage? What is used for PV?
Due to the advancement in the distributed generation systems for electricity, there is an increased demand for energy storage at both small and large scale applications. As we learned in lesson 1, PV is one of the fastest growing technologies in the electrical generation market, and in some cases it requires storage systems. In this lesson, we will focus on the complementary energy source that is usually coupled with a PV system, which is the storage system.
Storage is needed in PV systems to overcome the intermittency of the energy generated. These variations could be caused due to daily or monthly solar irradiance fluctuations. Daily fluctuation occurs as a result of the change of solar irradiance within the 24-hour period; while the seasonal (or monthly) fluctuations occur due to the change of solar irradiance across the summer and winter as seen in Figure 3.1. If we observe the monthly energy production of a 1 kW PV system installed in State College, PA, we can see that the generation increases during the summer months while the energy generation drops during the winter months. We can see that the PV system will not generate the same amount of energy each month. This means we need another complementary system to help even out the energy difference throughout the year.
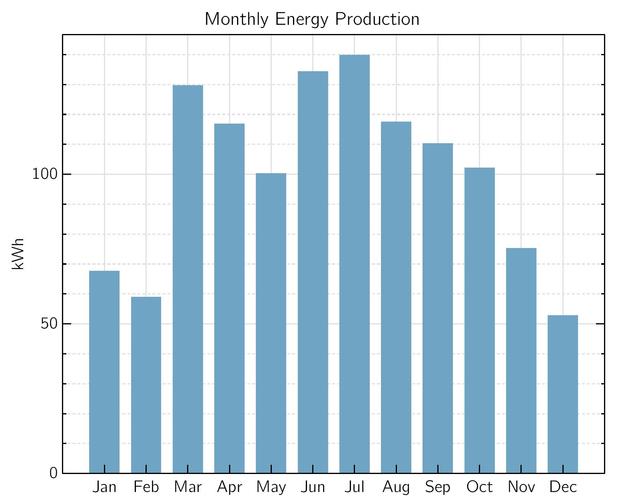
Review:
To learn more about the other storage technologies, you can refer to EME 812 (9.1. Options for energy storage) [58].
In addition to solving the critical intermittency generations issue of solar PV, storage systems provide:
- A potential resource for shifting energy from one time to another
- A local source of energy to supply peak demand and potential enhancement for better reliability and resiliency.
- A method to enable load shifting to improve asset utilization and defer other capital investment
How do we make an optimal choice of a storage system?
Depending on the desired application intended for a storage system, there are many factors that affect the selection decision. In general, each application requires either more power from the storage system or it may require more energy. In Figure 3.2, the Ragone plot illustrates the power/energy density of various storage technologies. It can be seen that some technologies, such as fuel cells, can generate higher energy density (in wh/kg) than technologies with lower energy density such as capacitors. In other words, fuel cells can supply energy for longer time periods than can capacitors. In contrast, capacitors have higher power density (W/kg) than fuel cells, which means capacitors supply higher power for short periods than do fuel cells. For example, a capacitor is a good choice for high power density requirements, but it is not the optimal choice for high energy density, as we can see in Figure 3.2.
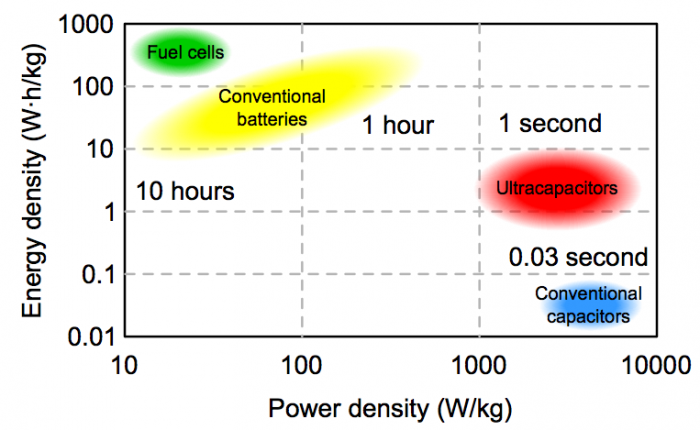
For most solar applications, we need a good balance between both high energy density and a high power density.
Reflection
Going back to a previous example, can capacitors be a storage option for solar applications?
ANSWER: Due to low energy density, capacitors are not the best match for PV applications.
For short-term to medium-term storage applications, the most common kind of storage technology is the battery system. They exhibit the perfect match between both energy density and power density to meet the daily storage demand for PV systems.
Batteries are still the most reliable, easy to implement, and efficient option for most commercial small to medium PV systems when compared to other technologies such as fluid, compressed air energy storage, or fuel cell.
The next topic will focus on battery technology and its types and operation principles.
Battery Types and Principles
Batteries are electrochemical devices that convert chemical energy into electrical energy. Batteries are classified as primary and secondary batteries.
Primary batteries
- Convert chemical energy to electrical energy and cannot be recharged.
- Examples include zinc carbon batteries and alkaline batteries.
Secondary batteries
- AKA rechargeable batteries, convert chemical energy to electrical energy and are rechargeable when the chemical reaction is reversed using forced electrical energy.
- Examples include lead-acid batteries and lithium-ion batteries.
Review:
To learn more about battery technologies, you can refer to EME 812 (9.3. Battery storage) [59]. (Note: link is also located on the Review page of this Lesson.)
Reflection
Which battery type is suitable for PV applications? Primary or secondary?
ANSWER: Since PV systems require energy to be stored more repeatedly during the day, we are interested in secondary battery technology.
There are several kinds of available secondary battery technologies that could be used for different applications, such as lead-acid and lithium-ion batteries. Lead-acid batteries use the oldest and most mature battery technology available, although lithium-ion batteries are being heavily researched (but their costs are still not competitive).
So how do we compare batteries for best candidate for PV application?
Let's look at the Ragone plot specific to available batteries. This is slightly different from the Ragone plot shown earlier. Figure 3.3 illustrates the comparison between various battery technologies in terms of gravimetric energy density and volumetric energy density. If we compare battery technologies based on both the energy per volume and energy per weight, we can see that lead-acid batteries have less energy density than Li-Ion batteries. As you move on the "x" axis, the gravimetric energy density increases. In other words, the battery offers higher energy per unit of weight. On the "y" axis, the volumetric energy density increases as we go up. In other words, the amount of energy in higher per unit of volume.
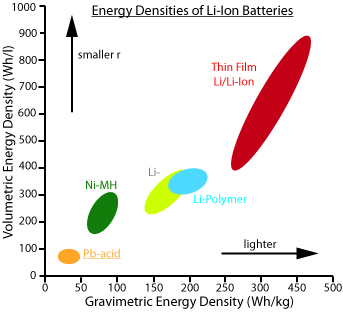
Volumetric energy density is the amount of energy stored per unit volume of battery. The typical unit of measurement is Wh/l. We can observe that the higher the volumetric energy density, the smaller the battery size.
Gravimetric energy density is the amount of energy stored per unit mass of the battery. The typical unit of measurement is Wh/kg. We can also observe that the greater the gravimetric energy density, the lighter the battery.
As shown in Figure 3.3, lead-acid shows the lowest volumetric and gravimetric energy densities among the batteries, while Li-ion exhibits the best combination.
Reflection
Since Lithium-ion batteries have the best properties in terms of energy and power density, why isn't it the most widely spread technology for PV applications?
ANSWER: Lithium-ion batteries have ideal material properties to make them an optimal storage choice, but cost is still a major factor that determines the feasibility of Lithium-ion as the best choice for broader PV applications.
That said, let's look a little bit more closely at the lead-acid battery.
Similar to most batteries, the lead-acid battery consists of several individual cells, each of which has a nominal voltage of around 2 V. Lead-acid batteries could have different types of assembly. For example, the common lead-acid battery pack voltage is 12 V, which means 6 cells are connected in series.
When the battery is recharged, the flow of electrons is reversed, as the external circuit doesn't have a load, but a source that has a higher voltage than the battery can enable the reverse reaction. In a PV system, this source is nothing but the PV module or array providing solar power and can charge the battery when the sun is available. As we learned previously in Lesson 1, the use of storage is more common in the stand-alone PV systems, because there is no other source of power to support the PV array when the sun is not available. In other words, the loads are at the mercy of the availability of the sun. In that case, an energy storage option such as batteries can be very useful. As an example, a typical daily solar irradiance profile is shown in Figure 3.4. If we observe the orange curve that represents the daily solar irradiance, we can see that a significant amount of energy is generated during the daytime while no energy is generated during the nighttime. On the other hand, the daily energy demand represented in the blue curve shows that energy is needed all day long, with higher demands at certain time periods. When we put the daily load demand curve (aka daily load profile) on the same figure, we see that a significant energy demand exists when there is no sun.
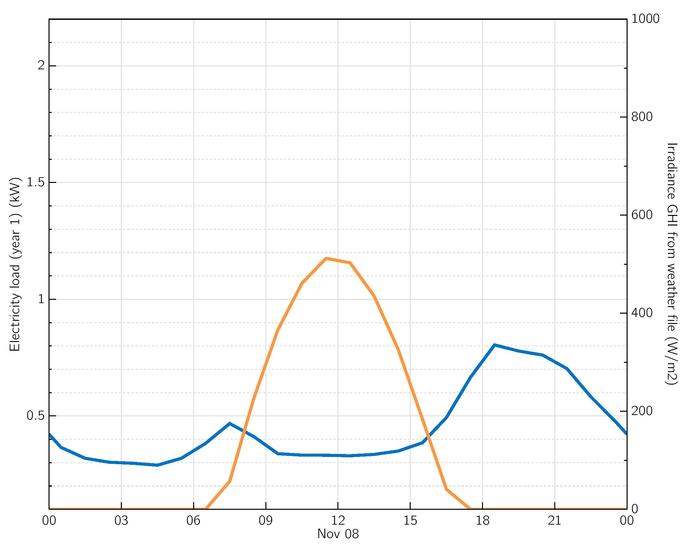
For utility-interactive systems, the excess energy is fed back to the grid while the load demand can be supplied from the grid when the sun is not available.
As for a stand-alone system without storage, even though the sun has more than enough power during the day, the system fails to utilize this excess energy to power the loads when the sun is not available.
With the introduction of battery storage, the excess energy from the sun during the day can be stored in a battery and then used later to meet the load demand when the sun is not available. This is represented in highlighted areas A1 and A2 in Figure 3.5, below, for excess solar power and evening load demand respectively.
The perfect match occurs when area A1 equals to area A2 and that can be accomplished by perfectly sizing the solar PV system to meet the average daily load energy demand. Furthermore, excess solar energy can be stored using Battery systems.
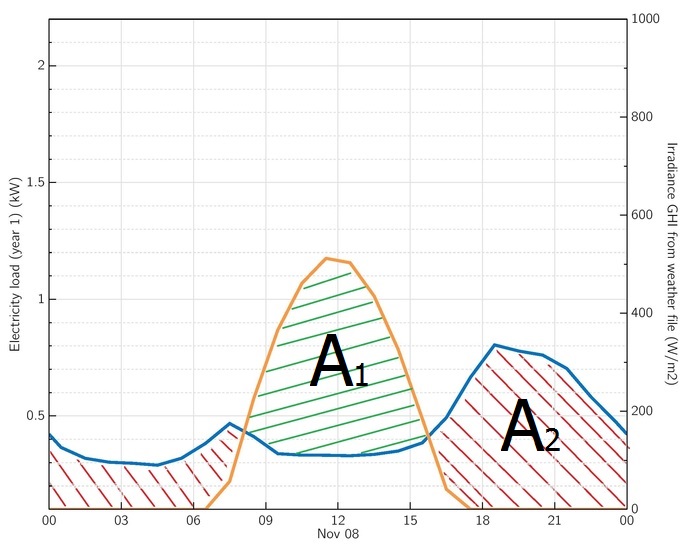
In summary, we have seen different types of battery technologies and discussed why lead-acid is the battery of choice for most current PV systems. We will talk in detail about battery parameters in the next topic. We will also see how managing battery parameters is a whole new optimization challenge on its own.
Interpreting Battery Parameters and Specification Sheets
Batteries are the final commercial product that are delivered to customers and that require some data provided from the manufacturers to allow customers to evaluate the performance of different battery types in terms of capacity rating, allowable DOD, and temperature operating ranges. Most datasheets come with some curves that a PV designer should be able to perfectly interpret for best design practices.
In this section, we will discuss basic parameters of batteries and main factors that affect the performance of the battery.
The first important parameters are the voltage and capacity ratings of the battery.
Every battery comes with a certain voltage and capacity rating. As briefly discussed earlier, there are cells inside each battery that form the voltage level, and that battery rated voltage is the nominal voltage at which the battery is supposed to operate.
The capacity refers to the amount of charge that the battery can deliver at the rated voltage, which is directly proportional to the amount of electrode material in the battery.
The unit for measuring battery capacity is ampere-hour or amp-hour, denoted as (Ah). The capacity can also be expressed in terms of energy capacity of the battery. The energy capacity is the rated battery voltage in volts multiplied by battery capacity in amp-hours, giving total battery energy capacity in watt-hours (wh). In general, it is the total amount of energy that the device can store.
You must be wondering what is the significance of amp-hours as the unit of battery capacity? The unit itself gives us some important clues about battery properties. A brand new battery with a 100 amp-hour capacity can theoretically deliver a 1 A current for 100 hours at room temperature. In practice, this is not the case due to several factors, as we will see later.
C-rate
Let's move to another important battery parameter, called the C-rate. C-rate is the discharge rate of the battery relative to its capacity. The C-rate "number" is nothing but the discharge current, at which the battery is being discharged, over the nominal battery capacity. It is calculated as the following:
Where
"Idis" is the discharge current
"Cnon" is the nominal battery capacity
The discharge rate is sometimes referred to as C/”number” and that number is the number of hours it takes the battery to be fully discharged. In other words, it is the inverse of the previous notation, and it is calculated as the following:
For example, a C-rate of 1C for 100 Ah capacity battery would correspond to a discharge current of 100 A over 1 hour. Or it can be represented as C/1. On the other hand, a C-rate of 2C for the same battery would correspond to a discharge current of 200 A over half an hour. Or it can be represented as C/0.5. Similarly, a C-rate of 0.05C implies a discharge current of 5 A over 20 hours. Or it can be represented as C/20. Finally, the same battery can be discharged at 1 A over 100 hours, and that corresponds to 0.01C or C/100. In general, C-rate depends on charging and discharging current.
Efficiency
Since there is no energy conversion system that is 100% efficient, the term efficiency represents the system capability to transfer energy from the input of the system to the output. Each battery type comes with different efficiency rating as discussed in EME 812 (9.3. Battery storage - Table 9.1) [59], and usually we talk about efficiencies of both charge and discharge combined.
Battery efficiency is the ratio of total storage system input to the total storage system output. For example, if 10 kWh is pumped into the battery while charging, and you can effectively retrieve only 8 kWh while discharging, then the round trip efficiency of the storage system is 80%.
Let's discuss another important battery parameter, the state of charge or SOC. It is defined as the percentage of the battery capacity available for discharge, so thus, a 100 Ah rated battery that has been drained by 20 Ah had an SOC of 80%. Another parameter that complements the SOC is the depth of discharge or DOD, which is the percentage of the battery capacity that has been discharged. Thus, a 100 Ah battery that has been drained by 20 Ah has a DOD of 20%. In other words, the DOD and SOC are complementary to one another.
Now we come to a very important parameter: the cycle lifetime of the battery. Cycle lifetime is defined as the number of charging and discharging cycles after which the battery capacity drops below 80% of the nominal value. Usually, the cycle life is specified as an absolute number. However, to be more precise, cycle life and other battery parameters are affected by changing ambient condition such (temperature in this case).
So what is the relationship between the battery parameters? The cycle life depends heavily on the depth of discharge. This can be seen in Figure 3.6 for a typical flooded lead-acid battery. If we look at the effective capacity at different depth of discahrge (DOD) rates for a lead-acid battery, we can see that the cycle number diminishes as the DOD increases.
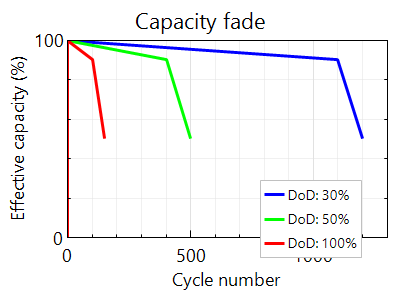
Cycle lifetime also depends on the temperature. The battery lasts longer under colder temperatures of operation. Furthermore, we can observe from Figure 3.6 that for a particular temperature, cycle lifetime depends non-linearly on the depth of discharge. The smaller the DOD, the higher the cycle lifetime. However, such a higher cycle life would also mean that those additional cycles you gain can only help you for a smaller depth of discharge. Thus, it could be said that the battery will last longer if the average DOD could be reduced over its normal operation. Also, battery overheating should be strictly controlled. Overheating could occur due to overcharging and subsequent overvoltage of the lead-acid battery. We will learn more about voltage and charge control of the battery in the next section.
While battery life is increased at lower temperatures, there is one more effect that needs to be considered. The temperature affects battery capacity during regular use, too. As seen in Figure 3.7, the lower the temperature, the lower the battery capacity. The Higher the temperature, the higher the battery capacity.
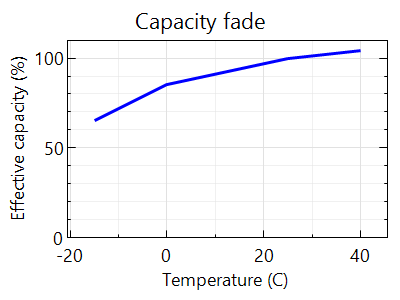
Reflection
Why does the capacity increase with temperature?
ANSWER: This is because, at high temperatures, the chemicals in the battery are more active, and therefore chemical activity tends to increase the battery capacity. Contrarily, the chemical activity is hampered at lower temperatures that lower the capacity
Battery Aging Factors
It might not seem scientific, but it is even possible to reach an above rated capacity of the battery at high temperatures. However, such high temperatures are severely detrimental to battery health.
When we say that a battery has a limited cycle life, or that it has completely "run out of juice," what exactly does that mean? Is it related to the aging effect of the lead-acid battery?
There are several factors that contribute to the aging of any battery. Sulphation is one of the major causes of aging. And if the battery is not fully recharged after being heavily discharged, that causes sulphate crystals to grow, which cannot be completely transformed back into lead or lead oxide. As a result, the battery slowly loses the mass of active material and therefore discharge capacity will be lower. Corrosion of lead grid at the electrode is another common aging factor. This leads to increased grid resistance due to high positive potentials.
Moving further, when the battery loses moisture, it causes the electrolyte to dry out, which occurs at high charging voltages, resulting in loss of water. It is referred to as gassing effect and may limit battery lifetime. This should be taken care of with routine maintenance by adding distilled water to the battery.
Researchers have developed maintenance free lead-acid batteries for solar systems that exhibit very high lifetimes. However, these are also high-end products and can be more expensive.
Reflection
How do we determine if the battery is preferred to be a maintenance-free type when designed for PV applications?
ANSWER: It is decided by the number of batteries required and the accessibility for routine maintenance. It is preferred to have maintenance-free batteries when the installation is not easily accessible or if the system requires a large number of batteries.
After we covered all basic battery parameters and characteristic curves, a designer should be able to make the best selection for a product depending on the application. But how do designers put these batteries in place? Is there only one size for all batteries, and it is scalable? Or do they make a custom design battery for each project? We will answer these questions in the next section.
Battery Systems and Design Considerations
Batteries are usually installed in groups for PV applications. In this case, the parallel and series connection of batteries is referred to as the Battery Bank. Lead-acid batteries are usually rated at 12 V, 24 V or 48 V. This voltage is determined by the series and parallel interconnection of several batteries. The voltage needs to meet the load or inverter voltage level requirements.
Reflection
How do we determine the battery bank voltage levels for PV applications?
Click on “Click for answer…” to reveal the answer.
ANSWER
12V, 24V, and 48V depending on the PV system size, as will be discussed in Lesson 6.
The series and parallel connection principles are similar to PV modules where we add voltage when connected in series while current is added for parallel connections of batteries. Similar to PV, groups of batteries connected in parallel are called a Battery String. As for the capacity rating of a battery bank, it is similar to the current principle. When connecting batteries in series, the capacity is not added. As for a parallel connection, the capacities add up.
Figure 3.8 illustrates the series and parallel connections of batteries and the corresponding voltage and current. As can be seen, batteries can be connected in series, parallel, or both. In this case, each battery with "V" for voltage and "I" for current is connected either in series or parallel with other similar batteries. The total voltage and current depends on the wiring type. In case of series connection, the total voltage of three batteries will be 3V while the current is similar to the current of a single battery. When three batteries are connected in parallel, the voltage equals the voltage of a single battery, while the total current is the sum of the currents of all batteries for a total of 3I. When two strings of three batteries are connected in parallel, the total voltage will be 3V, while current is summed for the two strings for a total of 2I.
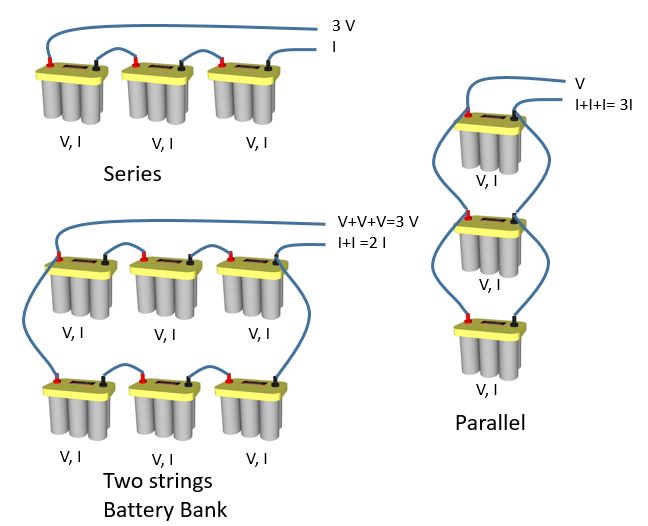
Reflection
What is the total capacity (in Ah) and what is the total energy capacity (in Wh) of the two strings shown in Figure 3.8 if each battery is rated 100Ah?
ANSWER: The total capacity is 200 Ah, while the total energy is 600 wh (assuming each battery is rated at 1 Volt).
It is recommended to have as few battery strings as possible to avoid voltage differences that may create power loss. In larger PV installations where more battery banks are required, it is recommended to connect more batteries in series rather than parallel strings. An example of a mobile bus that is converted to a solar stand-alone system with batteries is shown in Figure 3.9.
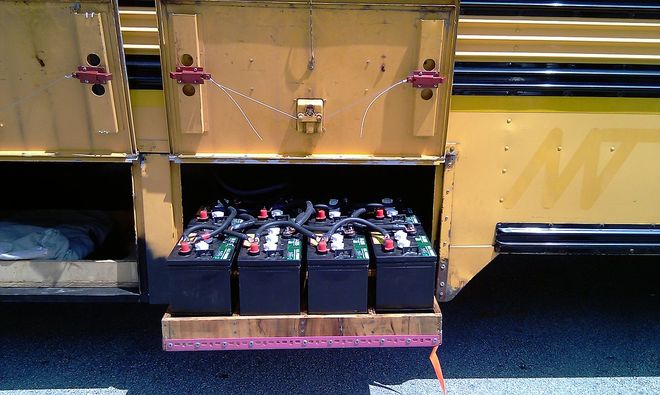
Note:
For selection criteria of batteries, please refer to Required Reading Chapter 6, Photovoltaic Systems by James P. Dunlop (text)
Design considerations
When designing a battery bank for a specific location, a good design will ensure that the battery bank is perfectly:
- sized so the energy capacity matches the load requirements.
- sized for maximum and minimum voltage requirements for the desired application.
- ventilated to meet temperature requirements.
- maintained to maximize the utilization of batteries.
Procurement Report/Peer Review: Part B
This week, you will continue working on your Report on Part B.
| Activity | Details |
|---|---|
| Assignment | Visit the Procurement of PV System Components Report [66] page for details on the overall assignment. This week, you will be working on Part B. Note: You will not be submitting this part individually. Rather, you will be combining it with Parts A and C for a single Report submission at the end of Lesson 4. In Part B:
|
Summary and Final Tasks
Let's go back to our scenario from the beginning of this lesson. You came back from the solar trade show, and you collected some datasheets for battery types and technologies from different manufacturers. Now that you are fully knowledgeable about the basic information of battery technology types, efficiency, the capacity rating, and voltage and current ratings, you can work on the report needed by your director. In addition, you can confidently recommend the best battery candidate for the solar firm for which you work.
As a solar designer, you are equipped with the right information to choose battery technology based on the factors that affect performance of batteries when they are installed, such as rate of discharge and the ambient temperature. Finally, you can suggest methods to increase the cycle life of the battery bank.
The next lesson will discuss the heart of any PV system, which is the "Power Conditioning Unit." We will cover a variety of topics starting from basic characteristics to factors that affect performance, and finally, stringing tools considering inverter's parameters that lead to optimal PV system design.
Reminder - Complete all of the Lesson Requirements!
You have reached the end of this lesson. Before you move to the next lesson, double-check the list on the first page of the lesson to make sure you have completed all of the requirements listed there.
Lesson 4: PV System Components (Power Conditioning Units)
Overview
Lesson 4 Scenario
You are still attending the solar trade show. Now you are looking for solar inverters. The inverter manufacturer representative discusses the datasheets and series of inverters that best fit the PV modules you selected. You learn manufacturers make various types of inverters. What is the first question you ask to narrow down your choices of Inverters in terms of inverter types based on what was discussed in class? Are there different types that can be detrimental to your PV module selection?
You leave the trade show with more specification sheets from other inverter manufacturers. The next day, you need to prepare a report to your director with more information to help him choose the best PV inverter for the company. As always, you need to come up with the right tools to evaluate the inverters.
Ignoring the cost of the inverter, is it the inverter's efficiency, dimensions, ambient conditions, technical features, warranty, or color that are considered when selecting an inverter?
Can any inverter be connected to the utility grid, or should it have some kind of tests and certifications? Are there specific grid requirements for the US?
In this lesson, we will discuss topics that lead to answers to all the questions in the scenario above. We will also introduce new tools that can be used to help PV designers make the optimum selection of the inverter. Whether you are a designer or a system owner, the knowledge presented in this lesson will help you understand the basics of the inverter.
Learning Outcomes
At the successful completion of this lesson, students should be able to:
- Identify common types and functions of inverters, converters, and power management technologies and selection methods to align with PV systems.
- Interpret inverter specification sheets and parameters to match PV and grid requirements.
- Discuss features of inverters, including the Maximum PowerPoint Tracker, anti-islanding detection.
- Describe factors influencing the lifetime of an inverter, such as temperature and environment.
- Identify an inverter’s voltage operating ranges and capacity factor and how to match them with PV module and string ranges.
What is due for Lesson 4?
Lesson 4 will take us one week to complete. Please refer to the Calendar in Canvas for specific time frames and due dates. Specific directions for the assignments below can be found within this lesson and/or in Canvas.
Complete the following Lesson Assignments:
- Read through the Lesson Content
- Complete the Required Reading Assignments:
- Chapter 8, Photovoltaic Systems by James P. Dunlop (text)
- Complete the Lesson 4 Activity
- Complete Procurement Report (Parts A, B, C)
- Take the Lesson 4 Quiz in Canvas
Questions?
If you have lesson specific questions, please feel free to post to the Lesson 4 Questions discussion forum in Canvas. While you are there, feel free to post your own responses if you, too, are able to help a classmate with a question. If you have questions about the overall course or wish to share and discuss any "extra" course related commentary (interesting articles, etc.), please feel free to post to the General Questions and Discussion forum.
Review
Some of the content in AE 868 is directly related to topics that are already discussed in other courses. However, these topics are essential building blocks on what we will cover in AE 868. Many lessons will begin with a list that links out to these relevant topics. Please take the time to review the topics here or where noted throughout the lesson.
- EME 812 (6.2. Main components of the PV systems) [17]
- EME 812 (11.1. Inverters: principle of operation and parameters) [67]
- EME 812 (11.2. Switching devices) [68]
- EME 812 (11.3 DC/DC Conversion) [49]
- EME 812 (11.4. Grid connection and role of inverters) [69]
- EME 812 (11.5. Efficiency of Inverters) [70]
Why Power Conditioning Units for PV?
Since we learned the difference between DC power and AC power and their properties in the “Basics of Electricity” section in the class Orientation, we know for sure that the power coming from the source needs to be shaped to match the property of the load.
In this lesson, we will focus on how Power Conditioning Units (PCUs) are used and what the main types and configurations are that exist for these PCUs in the solar industry.
PCUs for PV systems
To know what a PCU is, we must first understand we need it for PV systems. All topics on the PV electrical output current, voltage, and power we discussed were in DC form. And since most appliances (fridge, lighting, heating, etc) need AC power, we need a device that can simply convert the DC electric power into an AC power. And that device is called an inverter. Furthermore, since most PV systems are connected to the utility grid, the solar power produced needs to be converted to AC form. This allows solar power to move in and out of the electricity grids we have today.
PCU vs Inverter
Many people use the term inverter as a device that converts DC into AC power. However, the inverter can perform many tasks beyond that. Thanks to the advancements in power electronics, it is common to have inverters that implement an MPPT mechanism before inverting the voltage, thus ensuring that the PV modules or arrays are operating at their maximum power. Furthermore, the inverter can include a battery charger, a DC to DC converter for voltage step-up and step-down, and a transformer for grid isolation and voltage step-up. As we can see, the basic DC to AC conversion that is referred to as an inverter is better understood as the package and can be called a Power Conditioning Unit. It should be noted that the commonly used term for this device in the industry is “inverter.”
Note:
Power Conditioning Units are briefly discussed in EME 812 Lesson 6 PV Power Conditioning) [71] and the operating principles, switching devices, and parameters are thoroughly discussed in the same lesson.
Inverter types and classification
Now that we understand why we need an inverter for PV systems, it is time to introduce the different types of inverters that exist in the market and discover the advantages and disadvantages of each type. Inverters are classified based on their size, mode of operation, or configuration topology.
Inverters based on PV system type
Considering the classification based on the mode of operation, inverters can be classified into three broad categories:
- Stand-alone inverters (supplies stable voltage and frequency to load)
- Grid-connected inverters (the most commonly used option)
- Bimodal inverters (usually more expensive and are used less often)
Note
Inverter classification according to Interconnection types is discussed in EME 812 (11.4. Grid connection and role of inverters) [69].
Types of Grid-connected Inverters
Aside from the modes of operation, grid-connected inverters are also classified according to configuration topology. There are four different categories under this classification.
- Central inverters, which are usually around several kW to 100 MW range.
- String inverters, typically rated around a few hundred Watts to a few kW.
- Multi-string inverters, typically rated around 1 kW to 10 kW range.
- And finally, Module Inverters or Micro Inverters, typically rated around 50 to 500 W.
Central Inverter
Let's start with the central inverter, as shown in Figure 4.1. This is a PV array that consists of three strings, where each string has three series connected modules. Before these strings are connected to the utility grid, a power conditioning unit is required as an interface between the array and the grid. Designers can use one central inverter as illustrated in Figure 4.1, where all strings are connected to the DC side of the inverter and the single AC output is connected to the utility grid.
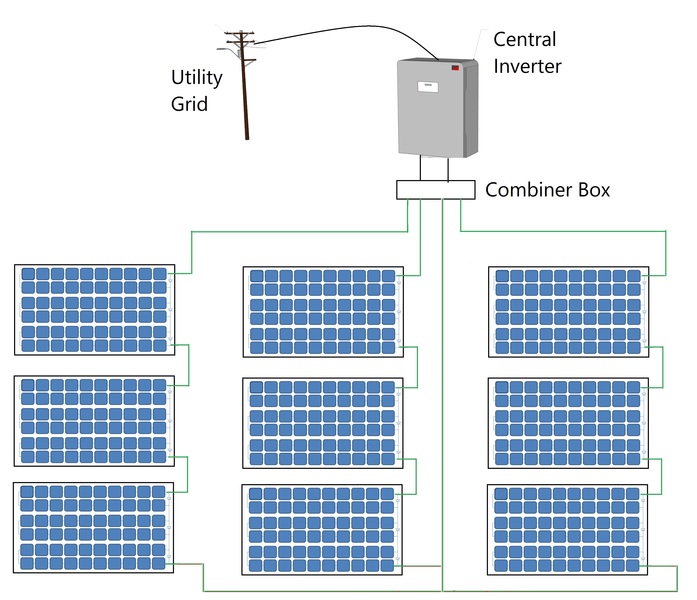
Advantages of a Central Inverter
- The most traditional inverter topology
- Easy system design and implementation
- Low cost per Watt
- Easy accessibility for maintenance and troubleshooting
Disadvantages of a Central Inverter
- High DC wiring costs and power loss due to Voltage Drop.
- Single MPPT for the entire PV system
- System output can be drastically reduced in case of partial shading and string mismatch
- Difficult to add strings or arrays for future expansion
- Single failure point for the entire system
- Monitoring at array level
- Huge size! (It is a disadvantage because the bigger size requires more land and creates a shading issue for the PV array.)
Reflection
What consequences can the size of a central inverter have on a PV array?
ANSWER: The huge size of a central inverter needs to be taken into account when designing the PV array to avoid a shading effect.
String Inverter
Now, we are moving to the String inverters as shown in Figure 4.2. Assuming the same PV array that consists of three strings, another way to connect it to the grid is using three string inverter as illustrated in Figure 4.2. In this case, each PV string is connected to a single string inverter at the DC side, and all AC outputs of inverters are combined and connected to the utility grid.
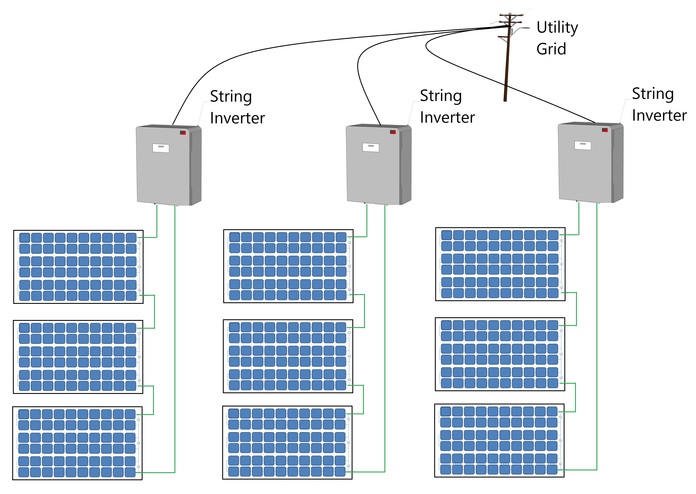
As the name indicates, each string of PV modules has its own inverter. In this case, we are moving closer to the PV modules level.
Advantages of a String Inverter
- Smaller in size when compared to central inverters
- Better MPPT capability per string
- Scalability for future expansion by adding parallel strings
- Short DC wires
- Monitoring at string level
Disadvantages of a String Inverter
- The installation requires special racking for the inverter for each string
- Poor flexibility at partial shading
- Higher per Watt cost than central inverter
Note:
There is another topology of string inverters called the multi-string inverter. It utilizes string DC-DC converter for MPPT and then central inverter. This type is not very common and is beyond our discussion for this class.
Micro Inverter
Finally, let's look at the micro inverters. These are also referred to as module inverters. In this case, each module has one dedicated inverter connected on the back of the module. The module DC terminals are connected to the DC side of the inverter and then all AC wires of all terminals are combined and then connected to the utility interconnection point as illustrated in Figure 4.3.
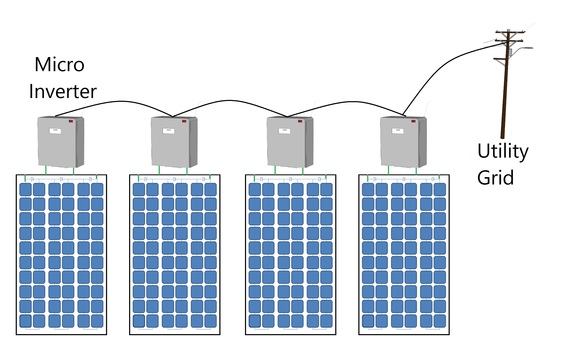
As the name suggests, each module has a dedicated inverter with an MPP tracker.
Advantages of Micro Inverters
- Resilience to partial shading effects as compared to the central and string inverters.
- MPPT at module level
- Highest system flexibility for future expansion
- Minimum DC wiring costs
- Monitoring at module level
Disadvantages of Micro Inverters
- High per Watt cost
- High maintenance costs
- Difficult access for maintenance since the installation is under the PV modules
Reflection
What consequences can the micro-inverter installation location have on the PV module?
ANSWER: Micro-inverters can increase the heat mass under the PV module.
Interpreting inverter datasheet and main parameters
After this overview of the solar inverters and their topologies, it is important to look at the various parameters and characteristics of this technology. The choice of the inverters' topology for implementation depends entirely on the system needs, size, and the budget. While choosing an inverter for your PV system, what are the requirements for a good solar inverter?
Characteristics of Solar Inverters
Inverter Input voltage range and max voltage
Inverters are designed to operate within a voltage range, which is set by the manufacturer's specification datasheet. In addition, the datasheet specifies the maximum voltage value of the inverter. Both the maximum voltage value and operating voltage range of an inverter are two main parameters that should be taken into account when stringing the inverter and PV array. PV designers should choose the PV array maximum voltage in order not to exceed the maximum input voltage of the inverter. At the same time, PV array voltage should operate within the input voltage range on the inverter to ensure that the inverter functions properly.
Inverter Start-up voltage
Aside from the operating voltage range, another main parameter is the start-up voltage. It is the lowest acceptable voltage that is needed for the inverter to kick on. Each inverter has a minimum input voltage value that cannot trigger the inverter to operate if the PV voltage is lower than what is listed in the specification sheet.
Reflection
Why is start-up voltage different from the minimum operating voltage for an inverter?
Click on “Click for answer…” to reveal the answer.
ANSWER
Power electronics switching devices need slightly more voltage to kick on when they start up in the morning. However, they are designed to allow lower voltage once they are in “ON” mode, and that is what we mean by the minimum operating voltage range.
Inverter and efficiency
As power is processed and converted from one shape to another, the solar inverters are expected to perform these tasks with the highest possible efficiency. This is because we wish to deliver maximum PV generated power to the load or the grid. Typical efficiencies are in the range of more than 95% at rated conditions specified in the datasheet.
Note:
Inverter efficiency is discussed in EME 812 (11.5. Efficiency of Inverters) [70].
Inverter and MPPT
Depending on the topology, most modern inverters have built-in MPP trackers to insure maximum power is extracted from the PV array. Each inverter comes with a voltage range that allows it to track the maximum power of the PV array. It is recommended to match that range when selecting the inverter and the PV array parameters.
Note:
Inverter MPPT is discussed in EME 812 (11.3 DC/DC Conversion) [49].
Inverter and ambient conditions
In most applications, the solar inverters are exposed to ambient conditions such as solar radiation, temperature, and humidity. Inverters must comply with the conditions of the location to make sure they can work under ambient conditions listed in the specification sheet.
Inverter and the utility grid
Since grid-tied inverters pump power into the grid, they are expected to maintain a very high quality of power to guarantee that the acceptable power flows into the grid. For that reason, inverters are expected to have a very low harmonic content on the line currents. Furthermore, grid-tied inverters are expected to have active islanding detection capability per IEEE 1547.
Islanding refers to the situation in which the inverters in a grid-tied setup continue to inject power from the PV system even though the power from the grid operator has been restricted due to fault of scheduled maintenance. Due to safety concerns, islanding needs to be prevented. Therefore, inverters are expected to detect and respond immediately by switching their output so that no more power flows into the grid. This is also referred to as anti-islanding capability.
Note:
Inverter grid features are discussed in EME 812 (11.4. Grid connection and role of inverters) [69].
Inverter lifetime
There is also ongoing work to increase the lifespan of the inverter. A good inverter will probably reach, under favorable conditions, around 10-12 years of lifetime. This is a bottleneck in the PV system lifetime, especially considering the fact that PV modules can last over 25 years.
Reflection
What are the solutions to the lower inverter lifetime when compared to the PV module lifetime?
ANSWER: Inverters need to be changed two to three times during the lifetime of the PV system. More research is being conducted to push inverters' lifetimes to longer periods.
DC to AC ratio
Each inverter comes with a maximum recommended PV power, or sometimes is referred to as "DC-AC Capacity factor," which is defined as the percentage of DC power over the inverter's max power. We will use "DC to AC ratio" when we refer to this specific term throughout this calss.
Stringing PV inverter
We discussed the effect of cell temperature on the I-V curve and the operating voltage and current in Lesson 2. Now it is time to apply this knowledge to calculate minimum and maximum operating voltage of module or string.
The NOCT and % temperature coefficients from the modules datasheet can be used to determine the min and max voltage levels and the range of MPP corresponding to it. PV designers are interested in the lowest recorded temperature for a location to determine the highest possible Voc for the string and Vmp for MPP range. Furthermore, the average highest temperature is used to find the lowest voltage from the module or string.
Note
Check out Weather.com. [72] On this site, you can search for the lowest and highest recorded temperatures by location.
We can also define the string voltage as the individual module’s voltage multiplied by the number of modules connected in series.
Assuming we are stringing the PV string shown in Figure 4.4, the I-V curves of the PV string vary depending on the temperature. When the temperature is higher than the standard 25ºC, both of the MPP voltage and the open circuit voltage Voc decrease. On the contrary, when the temperature is lower than 25ºC, both the MPP voltage and Voc increase, as illustrated in Figure 4.4. If we define operating ranges for both the MPP voltage and Voc, we can see that the inverter should be able to operate within the MPPT range at the lowest record and average highest MPP voltage of the PV string. Similarly, the inverter absolute maximum voltage should be at least equal to the maximum Voc of the string at the lowest record temperature and the minimum voltage of the inverter should not exceed the minimum Voc of the PV string at the highest temperature.
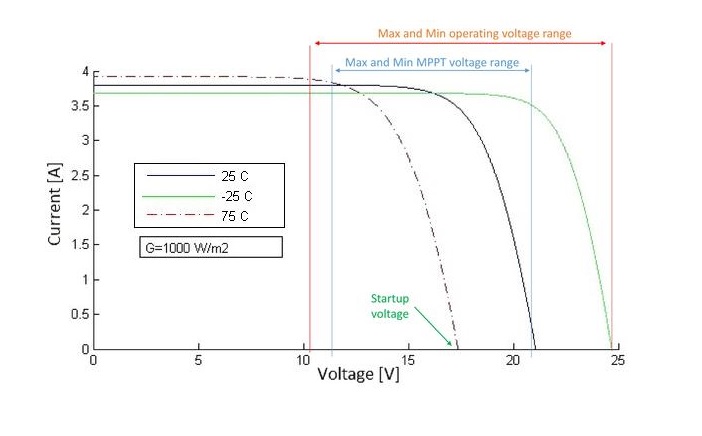
As PV designers, and when stringing the PV inverter with the PV string, we should make sure that the MPP voltage doesn't fall below the lowest voltage at the average high temperature and doesn't exceed the maximum voltage of the inverter.
Reflection
Example:
String the inverter with the following parameters:
- MPP voltage range between 250 – 480 V
- Maximum allowable voltage of 600V
- Startup voltage of 300V
What are the stringing voltage values of the PV string that a PV designer should consider? (Hint: Compare values to Figure 4.4, above)
ANSWER:
- Minimum open circuit voltage at average highest temperature doesn't fall bellow 300V to satisfy startup voltage requirements of the inverter.
- Minimum MPP voltage at average highest temperature doesn't fall bellow 250V to satisfy minimum MPPT voltage requirements of the inverter.
- Maximum open circuit voltage at lowest record temperature doesn't exceed 600V to satisfy maximum voltage requirements of the inverter.
- Maximum MPP voltage at lowest record temperature doesn't exceed 480V to satisfy maximum MPPT voltage requirements of the inverter.
Inverter stringing tool
As it seems, the math can get very tedious, so most Inverter manufacturers create their own sizing tools that are available online for free, where you can choose:
- PV module brand and model
- The desired inverter model
- The average highest ambient temperature and lowest (record) ambient temperature ranges (some tools allow user to choose the location and these temperature values will be already available).
The tool will then give all possible configurations (series and parallel) and the capacity factor. An example of inverter stringing will be available in the Lesson Activity, where you can apply the knowledge to a real world example.
DC to AC ratio and inverter design
As a rule of thumb, designers choose DC to AC ratio (AKA capacity factor) range not to be less than 80% and not to exceed 125% depending on the location and the irradiance and type of inverter used. For example, for a system in Seattle, WA, it is recommended to oversize the PV array since it is very unlikely to overload the inverter since radiation is less than the STC power rating of the modules. In contrast, in Miami, FL you cannot exceed 110% since radiation there reaches the STC level and may exceed it. For best stringing choices, use the manufacturer's datasheet to determine the maximum and minimum allowed PV array sizes.
Lesson 4 Activity
| Activity | Details |
|---|---|
| Assignment |
Part 1Refer back to the scenario from the Simulation Exercise [54]. You will have the same client in State College, PA with a 10KW system and 240V service. Given the PV module used (Trina solar TSM-250PC/PA05A), find the ambient temperature values needed for stringing the inverters for the location mentioned above, and then select your inverter as the following:
Video: Sunny Design Web - Introduction (4:12)Sunny Design Web - Introduction
Click here for transcript of Sunny Design Web - Introduction.
PRESENTER: Welcome to Sunny Design Web. No registration is required to try out our design software. It is also possible to design PV plants without registering. Registered users benefit in many ways, however. After registering for free, you can save and manage projects, create your own PV modules and locations, as well as create your own load profiles and personalized project documentation. For a new project, assign a project name and specify the location of the PV plant. Based on your selection, Sunny Design Web considers all settings related to the location, including system voltage and underlying legal conditions. You can review all of these settings, and adapt them as needed. Then it's time to configure the PV plant. First, select the manufacturer and the PV module. Adjust the number of PV modules or the desired peak power. The orientation and mounting type of the PV generator can also be modified as needed. Now you can manually select the inverter, generate the design automatically, or display a list of design suggestions. Sunny Design Web takes into consideration the normative requirements at the location, such as the displacement power factor. A suggestion is computed. In addition, Sunny Design Web offers the option of restricting the choice of inverters or sorting them by various criteria. The desired design can now be selected and then adopted with a click on the lower right. In the inverter details, you can see at a glance how the PV modules are connected to the inverter, as well as the detailed inverter configuration. In the next step, you determine the optimal cable dimension from the desired cable length, the cross-section, and the desired DC and AC cable material. Sunny Design Web recommends the minimum required cable cross-section. After dimensioning the cable, continue with determining your possible self-consumption. You can estimate your possible self-consumption of the generated PV energy with just a few clicks. For this, you merely need to select a load profile and the annual energy demand. To optimize self-consumption, Sunny Design Web also takes the integration of battery storage systems into consideration. In the Results Report, you can see, among other things, the possible self-consumption quota, both with and without optimization via energy storage. The overview summarizes, once again, entries, results, and current information on the PV plant. All result values are displayed in compact form under Results. To print project documentation or output it as a PDF file, simply click on Document and Output Format under Settings. Choose the desired documents and paper size, and simply click on Download Project Documentation. The selected combination will be displayed accordingly in the preview. This completes the plant design. Credit: SMA Solar Technology
For each of the three options for Part 1, gather the following information in a Word document. Label this section as "Part 1." You will combine this with Part 2 for a report.
Part 2For the same client in State College, PA who wants to install 10 kW using the same PV module from Part 1, you are to come up with the estimated annual energy yield (inverters are considered at this time).
DeliverablePrepare a report with Part 1 and Part 2 for submission. The report is to be no more than two double-spaced pages in a 12 point font. Bonus: Build your own Excel calculator for Inverter stringing given the PV module parameters. (Hint: use NOCT calculated from the Lesson 2 Activity Bonus Question). |
| Submission Instructions and Grading | Please visit the Lesson Activity [76] page for submission instructions and grading information. |
Procurement Report: Part C
This week, you will continue working on your Report on Part C.
| Activity | Details |
|---|---|
| Assignment | Visit the Procurement Report/Peer Review [66] page for details on the overall assignment. This week, you will be working on Part C and submitting the Report. Note: You will not be submitting this part individually. Rather, you will be combining it with Parts A and B for a single Report submission at the end of Lesson 4. In Part C:
|
Summary and Final Tasks
Let's go back to our scenario from the beginning of this lesson. Now that you have several datasheets for inverters from the solar trade show, you can easily prepare the report to your director about available inverter types, efficiency, the capacity factor, and voltage and current ranges. In addition, you can confidently recommend the best inverter for the solar firm depending on the PV system types they are involved in.
As a solar designer, you are equipped with the right tools to choose the inverter configuration based on the factors that affect performance, such as type of ventilation, size, and other features. Finally, you can suggest inverter configurations to optimize performance based on each specific installation's requirements.
The next lesson will discuss the pieces that are essential to put the PV systems together, which is the "Balance of System" or BOS. We will cover a variety of topics, starting from mounting structure types to mechanical and electrical components, and finally, how to find the main parameters that help designers to optimize the PV system design.
Reminder - Complete all of the Lesson Requirements!
You have reached the end of this lesson. Before you move to the next lesson, double-check the list on the first page of the lesson to make sure you have completed all of the requirements listed there.
Lesson 5: Electrical and Mechanical Balance of System (BOS)
Overview
Lesson 5 Scenario
Finishing the scenario we started, after choosing the PV Module, Inverter, and/or Storage devices for your PV system, your last stop at the solar trade show should be for the complementary components needed to put the system mechanically together and to allow the system to be electrically connected to an application such as grid or load. These electrical and mechanical components are referred to as Balance of System, or (BOS) for short.
Suppose your company is a small company that deals with residential installations. What type of mounting systems would you be looking for? Is it a roof mount or a ground mount system?
The representative asks you about the territory that you work mostly within to help you with the structural and mechanical loads calculations based on the recommended manufacturer specification. As a PV designer, what do you provide to him? Is it wind speed, snow load, roof pitch, or system layout to help run his calculations?
Suppose your company installs rural and large PV systems. In this case, what mounting type will you be interested in? What factors play a role when selecting the module racking? Is it the module mounting type? Or dimensions of your modules?
The representative gives you an idea about what they carry for these installation types. He offers you other solutions that complement the mounting structure. What are these Mechanical Balances of Systems that can be combined with the racking structure to help fasten the PV modules to the structure?
Since the PV system is an electrical system that generates power to loads/ grid, what are these components that help deliver energy to loads, and how do these Electrical BOSs relate to the mechanical BOS components? Since you are a company operating in the U.S., can any BOS be installed, or should it meet some kind of test standards and certifications?
In this lesson, we will discuss topics that lead to answers to all the questions in the scenario above. We will teach PV designers basic BOS components they should look for to fit their applications. Learning the topics taught in this lesson will help a variety of audiences, ranging from system designers or installers to business owners.
Learning Outcomes
At the successful completion of this lesson, students should be able to:
- Identify main electrical and mechanical BOS.
- Identify main types of racking systems including rooftop, ground mount, and pole mount PV systems.
- Indicate factors that affect the decision to choose types of mounting systems and their requirements.
- Differentiate between various types of attachment methods.
What is due for Lesson 5?
Lesson 5 will take us one week to complete. Please refer to the Calendar in Canvas for specific time frames and due dates. Specific directions for the assignments below can be found within this lesson and/or in Canvas.
Complete the following Lesson Assignments:
- Read through the Lesson Content
- Complete the Required Reading Assignments:
- Chapters 10 and 11, Photovoltaic Systems by James P. Dunlop (text) (Note: We will revisit Chapter 11 again in Lesson 8.)
- Complete the Lesson 5 Activity
- Complete the Procurement Report/Peer Review
- Take the Lesson 5 Quiz in Canvas
Questions?
If you have lesson specific questions, please feel free to post to the Lesson 5 Questions discussion forum in Canvas. While you are there, feel free to post your own responses if you, too, are able to help a classmate with a question. If you have questions about the overall course or wish to share and discuss any "extra" course related commentary (interesting articles, etc.), please feel free to post to the General Questions and Discussion forum.
Review
Some of the content in AE 868 is directly related to topics that are already discussed in other courses. However, these topics are essential building blocks on what we will cover in AE 868. Many lessons will begin with a list that links out to these relevant topics. Please take the time to review the topics here or where noted throughout the lesson.
PV Systems Mounting Types
We talked briefly about tracking systems and some design considerations for the tilt angles in Lesson 2. However, we didn’t elaborate on the mounting types available for PV systems. Each PV system is different from the rest in terms of racking structure and mounting types. This is due to the fact that PV systems are space constrained and the installation requirements vary from one place to another. For that reason, many structural holding solutions have been developed to accommodate different needs such as ground mount, pole mount, and roof mount. Each type comes with advantages and disadvantages that allow a good designer to make the optimal decision for each specific PV system.
Ground Mount
This type of mounting structure allows multiple rows of modules to be installed on the ground, as shown in Figure 5.1.
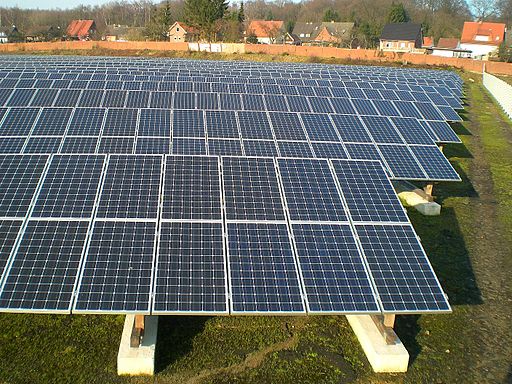
Advantages
- Cooler module temperature
- PV modules can get extremely hot during daytime due to the excessive heat generated from the modules and the ambient temperature. The best way to cool down the modules is natural convection using air, which is easily done when modules are elevated from the ground or roof so that air can carry out the heat and cool down the modules.
- Safe installation (no climbing required)
- Easy access for maintenance/troubleshooting
- No roof penetration/liability
- Flexible positioning for max production (potential use for single axis tracking). Ground mount is usually not restricted to be positioned at a certain tilt angle. That said, it is easier to choose the optimum tilt for maximum production.
Disadvantages
- Easy access (theft, vandalism, damage)
- Requires earth construction work (concrete, foundation, trenching)
- Space requirement
- Inter-row shading considerations
- PV modules can shade one another when installed in rows. For example, the first row can shade the second row located behind it. For more information, please refer to the video (6:08) explanation below from EME 810 [41].
Video: Shading Array Demo 1 - EME 810 (6:08)
So here we have the scenario of an array of photovoltaic that are set up one row behind the next. They're each going to have a certain tilt. That tilt is represented by beta and each one is going to have a common collector azimuth of gamma, represented down here. And that gamma again, is that plane or rotation. In this case, the array that you're seeing is rotated 9 degrees towards the east. So minus 9 degrees of rotation or 9 minus 180 degrees to give us our azimuth.
The distance between the panels, right now it's just specified as D. And the panels themselves are going to have a shadow. And that shadow is going to change over the course of the year, as the sun is high in the sky, and low in the sky.
And what we'd really like is for these panels to be spaced appropriately. Such that, they do not block each other. Because this is one of our goals, one of our mechanisms for the goal of solar design. You want to maximize the solar utility for the client or stakeholders in a given locale. And in this locale, want to know how far apart we can space these to collect the energy to basically avoid, or remove shading from the spacing of these panels.
So what you're seeing is a system that we're going to define in terms of critical points. We're going to take those critical points, and we're going to plot them on a diagram. So the first thing is, how do we list these critical points. Well now we don't have a central point X.
Now we actually have three points for each one of the panels across the top and across the bottom. This guy is going to be behind here, you won't see it. But you're going to have three points along the bottom, three points along the top. The points along the top are ultimately going to shade these critical points along the bottom.
So I'm going to name these critical points A, B, and C. And the points that we will be referring to in terms of what kind of shading are we expecting, we're going to label 1, 2, and 3.
So now going into this, you're looking at this from the side, and you're seeing a system like this, there's going to be a certain tilt beta. The beta is going to be the same for both collectors and they're going to be separated by a certain distance D. That's either going to be the spacing from top to top or from bottom to bottom, that's the same spacing with D.
So looking at this, we want to basically compare any point 1. And what we really like to see is, how does 1 compare to point C, point C is down here. One to point C, 1 to point B, and 1 to point A. That's one of our first questions.
And then after we've done that, we're going to look at how this point 2 compares to critical point C, critical point B, and A. And then we'll finally finish that with 3 C, 3 B, and 3 A. And what we should be able to see is that because of similar geometries we're going to find some kind of similar responses, in terms of all of these geometric relationships.
And I can show you that, again this is in the textbook, but if I bring this up right here, you're going to see that I've got a table of points 1.A, 2.A, 3.A, just like what we were talking about. And 1.B, 2.B, 3.B, 1.C, 2.C, 3.C. They each have their own set of altitude angles and you're going to notice that there are certain 21 degree common altitude angles. Just due to common geometries. Similarly, you're going to see common 41 degree angles and two 12 degree angles.
Looking at the azimuth angles, the 0 degree azimuth corresponds to 180 degree in the meteorological standard, and so on down. So we're seeing that 76 degrees is equivalent to 250 degrees. And minus 64 degrees is equivalent to 116 degrees.
So we're going to take these points this 180, 244, 256 for the azimuth angles of the collector. And we're going to plot those in the next block, and we'll plot the alpha angles. And what we're going to come up with is basically something that looks like the cross section of a loaf of bread. It's going to have two vertical sides and it's going to have an arch in the middle.
Pole Mount
This structure is common in public areas where the system is space constrained, as seen in Figure 5.2.
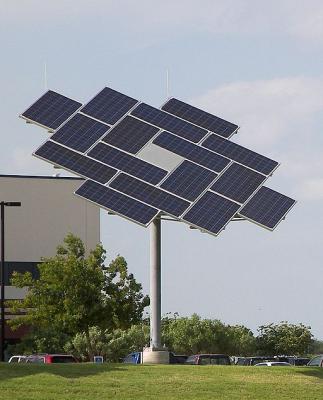
Advantages
- Cooler module temperature
- PV modules can get extremely hot during daytime due to the excessive heat generated from the modules and the ambient temperature. The best way to cool down the modules is the natural convection using air, which is easily done when modules are elevated from the ground or roof so that air can carry out the heat and cool down the modules.
- Easy access for maintenance/troubleshooting
- No roof penetration/liability
- Flexible positioning for max production
- Easy to adjust the tilt angle (potential use for dual axis tracking)
- Small footprint (one pole)
Disadvantages
- Easy access (theft, vandalism, damage)
- Requires construction (concrete, steel, foundation, trenching)
Note:
Single and Dual axis tracking systems are discussed in detail in EME 812 (3.3. Types of tracking systems) [77] and EME 812 (3.4. Engineered devices for solar tracking) [78]
Roof Mount (without roof penetration)
There are various types of roof mounts that don’t require roof penetration especially when the roof is flat, as illustrated in Figure 5.3. Of these types, ballasted roof mount is one of the most used racking structure for PV systems installed on flat roofs. It utilizes the weight of concrete or sand to ensure the system stays still to stand all kinds of external forces such as pullout wind forces.
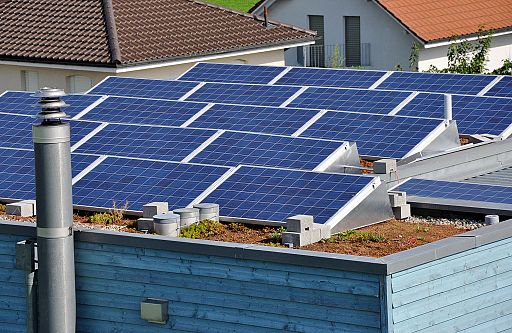
Advantages
- Low material cost
- Utilizes unused spaces
- Provides secure access for authorized individuals only
- Flexible positioning for ideal production
- No roof penetration needed
Disadvantage
- May require structural engineering and/or roof reinforcement due to added weight
Roof mount (with roof penetration)
These mounting structures allow the system to be installed parallel to the roof for the best esthetic solution for pitched roofs, as seen in Figure 5.4.
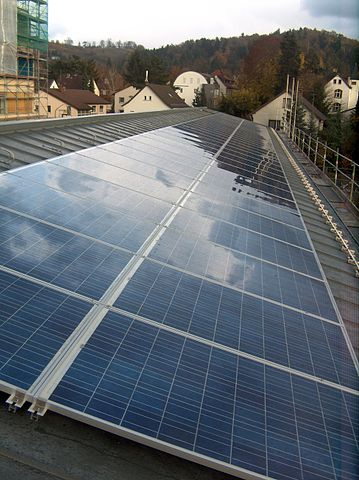
Advantages
- Lower material cost
- Utilizes unused spaces
- In most buildings, the roof is considered unused space. PV array can occupy these spaces and transfer them to useful spaces that can generate electricity for the building.
- Provides secure access for authorized individuals only
Disadvantages
- Requires roof penetration (roof leak liability or roof damage)
- Requires professional installers
- Higher module temperature (poor ventilation)
- PV modules can get extremely hot during daytime due to the excessive heat generated from the modules and the ambient temperature. Since PV modules cannot be elevated from the roof for more than a couple of inches, air movement is restricted from carrying out the heat to cool down the modules.
- Difficult conduit runs
- Most roofs have different gable shapes and sizes. In addition, the main electrical panel is usually located at the bottom of the building. That said, the PV array conduits have to run through the roof to the main panel and that route can be wiggly and require more attention to the details when installing the system.
- Fixed title and orientation
- Most roofs come with single pitch that cannot be changed. When a PV array is installed on the roof, the orientation and tilt are restricted by the roof pitch and orientation, and that might affect the production of the PV system.
- Pullout forces
- Wind speed flowing against the PV modules on the roof can cause forces that act similarly to pullout forces that try to remove the modules from the roof. That said, PV designers should ensure that the PV array is securely fastened to the roof using the right attachment mechanisms, such as screws and hooks.
Considerations
- Roof age
- Roof age is a critical factor to installing a PV array. A weak and old roof may not be able to withstand the added weight from the PV array.
- Snow and wind loading
- Snow and wind can add weight to the roof. If the roof is not designed to carry that additional weight, the roof might collapse.
- Fire issues
- When PV arrays are installed on roofs, installers should work with the local fire department to ensure that there are no fire hazards or accessibility issues if fire occurs.
There are other mounting types that are beyond our discussion for this class and students are encouraged to look for different racking structures for their own benefit.
For Further Reading
For more information about the mounting structures of the PV system, please refer to your Required Reading: Chapter 10 from the Dunlop text. Please note that some information in the reading chapter is not directly related to this topic; however, students are encouraged to read through the chapter for their own benefit.
Mechanical BOS Components
After reviewing different types of PV mounting structures, it is time to discuss the components that form these mounting structures. In this section, we will focus on the mechanical BOS components that help assemble the PV system components. These mechanical BOS components include fasteners, brackets, enclosures, racks, and other components that support the structure of the PV system.
Starting at the PV Array
PV modules need to be securely fastened to the racking structure, and that is done through rails, splices and clamps.
Rails
PV modules cannot be directly fastened to the roof of the building, for example. They require a structure that holds modules together that is later fastened to the roof or the ground. This structure is made of what is referred to as rails, which are rated to withstand heavy weights. Rails come in different shapes, profiles, lengths, and materials. Since rails manufacturers don’t make every desired possible length, the rails are tailored to fit each specific PV system.
Splices
When the PV system requires longer spans than the default length of the rails, splices are used to extend and connect rails to each other. Splices are usually provided by the same rail manufacturers.
Clamps
In order for the PV modules to be fastened to the rails, clamps are usually used to secure the connection between the rails and the modules. PV modules are usually installed adjacent to one another. As a result, some modules will be located in the middle and other modules will be installed on the edges. In this case, the middle modules will require what is referred to as mid-clamps to fasten the modules to each other and to the rails and end-clamps at the edge modules to lock the ends of the array.
Moving Away From the Rails
The rails need to be fastened to the mounting structure. This usually depends on the mounting type that can be roof mount, ground mount, or pole mount structures.
Roof mount (rooftop with penetration)
In case the PV system is installed on rooftops, designers should consider elevating the rails a couple of inches against the roof to allow for ventilation and lower temperature operating ranges. For that reason, there are multiple solutions in the solar industry to achieve that clearance. The rails can be fastened to the roof using one of the following options:
L-foot
L-foot utilizes screws that are fastened to the rafters or trusses from one side, and the other side will be attached to the rails. L-foot can be directly used to allow some roof ventilation; however, when the L-foot is not long enough to satisfy the ventilation requirements, Stand-offs are usually used to elevate the rails above the roof to allow proper ventilation to meet the design criteria. Stand-offs come in different lengths, and designers choose the best length based on the application and ambient temperature.
Tile Hooks
Roofs come in different shapes and materials. In the case of ceramic tile roofs, roof tile hooks can be directly used as roof attachment equipment that allows the rails to be fastened to the roof by going underneath the tiles. Tile hooks provide roof ventilation, as they are designed to be elevated from the tiles.
Roof Mount (without roof penetration)
PV systems can use S-5 clips or applied weight (i.e., sand or concrete) to fasten the rails to the roof. Let's elaborate on each type:
S-5 clips
In order for a PV array to be fastened to a metal roof (flat or tilted), manufacturers have developed solutions to allow rooftop installation without roof penetration. This solution includes an innovative clip that is called "S-5" and bites from one side of the metal roof. The other side will be fastened to the rails of the PV array. This solution minimizes the use of equipment grounding since the frame metals are directly connected to a metal structure. Designers should consult with the manufacturer's recommendations for grounding requirements when using these clips.
Applied Weight
Another solution to allow rooftop installation without roof penetration and is done using weight that holds the array to the roof. The applied weight can utilize sand or concrete, based on the design. Designers should take into account the roof age and the maximum allowed weight of the roof in order to accommodate the additional weight of the PV array. In some cases, the PV array's structural design needs to be reviewed by Professional Structural Engineers to ensure the structure can handle the additional weight.
Ground mount/Pole Mount
Reinforced concrete bases are usually used for ground and pole mount systems, with steel structure attached to the rails. In some cases, the PV array's structural design needs to be reviewed by Professional Engineers to ensure the structure can withstand dynamic loads based on the location and wind speed.
Note:
Racking structure load calculations are usually provided by the manufacturers in the specification datasheets. There are main parameters such as dead load, live load, wind load, and snow loads that contribute to the total weight of the PV array. These loads should be taken into account when calculating the weight per unit area that is usually referred to as Pound per Square Foot (PSF), or the concentrated Point PSF, and finally, the pullout force (uplift) that is directly related to the wind factor and how they might affect the panels.
For further reading:
For more information about the mechanical and structural load calculations, please refer to your Required Reading: Chapter 10 from the Dunlop text.
Electrical BOS components
The main goal of the PV system is to deliver the energy generated from the sun to the load or the grid, depending on the application. This cannot be achieved without the use of complementary components to allow the current to pass through the circuit. There are multiple electrical BOS components such as conductors, conduits, combiner boxes, protection devices, disconnects, grounding conductors, monitoring devices, and other electrical needed components. These components should be chosen to minimize electrical system losses, and at the same time, to withstand the operating conditions.
In this section, we will focus on the electrical BOS components and their functions as part of the PV system.
In the Electricity Basics section (before we began the course), we learned that conductors are needed to allow current to flow in the circuit. Since we have DC and AC circuits in the PV system and outdoor and indoor installation, we need to consider different properties for each conductor we choose.
Conductors
The conductor insulation should be rated to withstand high temperature and sunlight, since modules are installed outdoors. The main goal is to protect the bare conductor from coming into contact with personnel or equipment.
There are two types of wiring for PV circuits.
1: PV source-circuit wiring
This refers to the wires connecting the PV modules all the way to the combiner box, where stringing of modules are combined. These wires are usually located outdoors and are exposed to UV sunlight, extremely high temperature (90℃ or 194℉), and in some cases, they are exposed to moisture. Examples of insulation types recommended for these installations include USE-2 and PV WIRE.
2: PV output-circuit wiring
This refers to the wires passing through conduits, and they connect the combiner box with the DC disconnect. These cables are still installed outdoors, but they don’t have to be rated to withstand the same extreme conditions that the PV source-circuit wiring experiences. Due to costs associated with PV source-circuit wiring, it is recommended to transition to lower rated wires such as RHW-2, THW-2, THWN-2, and XHHW-2 that still need to withstand the same high temperature without having to be sun resistant.
Interior wires:
When wires enter a space or a temperature controlled environment, it is better to transition to NM, NM-B, or UF types. It should be noted that all interior conductors need to be in metal conduits or enclosures and rated to withstand fire.
Battery wires:
These wires are rated to withstand moisture and must be listed for hard-service use. It is also recommended to have them flexible for easier use. USE, RHW, and THW are commonly used types for battery wiring.
Note:
Please refer to your Required Reading: Chapter 10 from the Dunlop text for more details about insulator types, definitions, and their usages.
PV Wires
Most modern PV modules come with wires that connect the semiconductor terminals to the outer circuit. This allows current to follow to loads through a protective enclosure, located on the back of the PV module, called the junction box, as illustrated in Figure 5.5. As we can see, the junction box is the interface between the module and the wires. It consists of an outdoor rated plastic box, bypass diodes, and screw terminals for the wires. The junction box is also rated for outdoor operating conditions and must be weather sealed to prevent dust and moisture from building up.
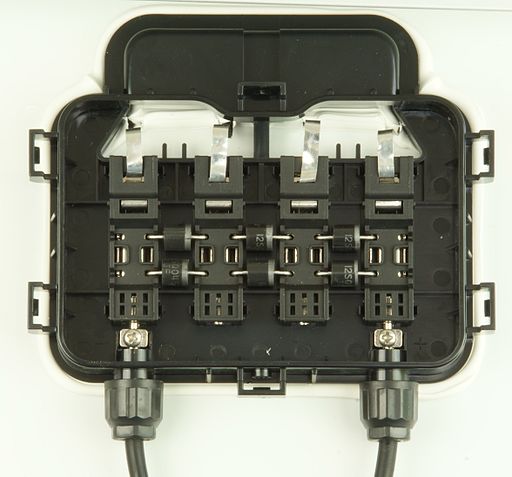
The wires coming out of the junction box are rated for outdoor conditions. Usually, they come with secured terminals, also known as module connectors, such as MC4, as shown in Figure 5.6. We can see that these plugs are weather sealed and also provide safety measures.
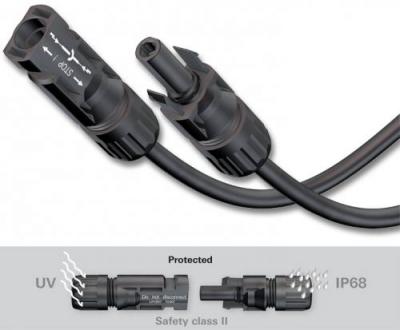
Combiner Box
The second main electrical BOS is the combiner box, which combines multiple PV strings into single circuit, as seen in Figure 5.7. Combiner boxes should be rated for outdoor applications and should withstand extreme weather conditions. There are usually screw terminals that apply compression force to secure wire terminals and ensure low resistance at the connection points, inside the combiner box. Lugs can be also used with compression force at the wire terminal. Lugs can have a ring or fork shape to make connections look much cleaner and to make them easier to manage. Protection devices such as Fuses can also be installed inside the combiner box for protection purposes.
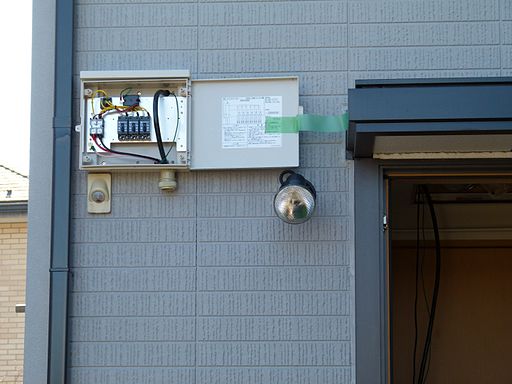
Disconnects
At the entrance and exit of the power conditioning unit, we need to be able to disconnect the current for maintenance work or commissioning procedure. That is usually done using DC disconnect and AC disconnect. In some cases, either or both DC and AC disconnect come as part of the inverter in a built-in device, as shown in Figure 5.8. It can be seen that the inverter has a box attached to the bottom of it with a hand switch that represents the disconnects. In both cases, disconnects need to be rated for the extreme outdoor weather conditions. DC disconnected can also have protection devices such as Fuses or Overcurrent Protection Devices (OCPD). We can also see in Figure 5.8 that the utility requires a separate AC disconnect after the utility meter. This disconnect is a manual lever handle type.
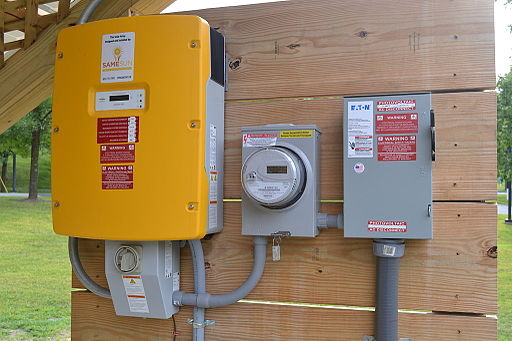
Conduits
Conductors are better protected if they are run through conduits, raceways, and wireways for damage protection and safety precautions. As can be also seen in Figure 5.8, all conductors between the combiner box and the utility disconnects are usually run through conduits.
Conduits can be made of different material types, including:
Metal
- Rigid metal conduit (RMC) is a thick-walled threaded tubing, usually made of coated steel, stainless steel or aluminum.
- Electrical metallic tubing (EMT), sometimes called thin-wall, is commonly used instead of galvanized rigid conduit (GRC), as it is less costly and lighter than GRC.
- Intermediate metal conduit (IMC) is a steel tubing heavier than EMT but lighter than RMC.
Non-Metal
- PVC conduit is the lightest in weight compared to other conduit materials, and usually lower in cost.
- Rigid nonmetallic conduit (RNC) is a non-metallic, unthreaded smooth-walled tubing.
- Electrical nonmetallic tubing (ENT) is a thin-walled, corrugated tubing that is moisture-resistant and flame retardant.
Note:
Other conduits types and their selection and installation are regulated by the National Electrical Code (NEC) and building codes.
Grounding conductors
PV systems need to be grounded to protect people and equipment from electrical hazard and equipment damage. The equipment grounding conductors (EGC) and grounding electrode conductors (GEC) and rods are considered part of the electrical BOS. In special cases, PV systems need to be protected from lightning. That is also done through a special grounding electrode connected to the ground in order to drain the lightning current.
Note:
Your Required Reading: Chapter 11 from the Dunlop text covers the electrical components of the PV system in more detail.
Lesson 5 Activity
| Activity | Details |
|---|---|
| Assignment |
Scenario 1Assume you are designing a system with the same module counts on the rooftop as shown in the video shown below. The Module used is Trina Solar Allmax 60 cell multicrystaline [90]. You may choose the SOLARMOUNT rail based options that can serve the purpose from Unirac (a racking manufacturer) [91]. You have standard 12” spaced rafters for a residential roof. Video: How Solar Works SSI (0:58)How Solar Works SSI
Click for text description of How Solar Works
As shown in the video, a solar array can be installed on a rooftop for residential application. After all mechanical holding structures are installed on the roof, the solar panels can be fastened to it . When the sun shines on PV panels, photons are converted into electrons that form electrical current when it moves towards the circuit terminals . The electrical DC current then travels through conduits down towards a power conditioning unit (AKA inverter) . The current is converted to AC electrical current and travels through an AC disconnect box . When the AC current exits the disconnect box, it goes through a PV production meter to count energy generated . After that, the current is back fed to the lower side of the Main distribution panel (MDP), where all load circuits are connected, through a protection breaker . When the PV array is generating power, the load circuits draw power from the PV array instead of the grid . While the PV array is generating power, the monitoring device is transmitting the data to an online portfolio, where clients can see their instantaneous PV array performance online . Finally, the excess energy generated from the PV array is returned to the utility grid . Credit: Sam Fortune
Scenario 2Assuming the roof is flat, the installation to flat roof with ballasted system from Unirac [92], taking the average cement weight of 32 lb. and considering the following:
DeliverablePrepare a report that includes your findings for each of the scenarios. The report should be no more than one double-spaced page in a 12 point font. |
| Submission Instructions and Grading | Please visit the Lesson Activity [76] page for submission instructions and grading information. |
Procurement Report/Peer Review
This week, you will complete the Peer Review portion of the Procurement Report assignment.
| Activity | Details |
|---|---|
| Assignment | Visit the Procurement Report/Peer Review [66] page for details of the overall assignment and submission instructions. This week, you will be working on and submitting the Peer Review. For the Peer Review portion of this assignment, you must complete the following:
|
Summary and Final Tasks
Wrapping up the trade show scenario we started, by now you can define and choose all types of mounting structures whether they are roof mount, pole mount, or ground mount system. You can also choose the required mechanical and electrical BOS for a perfect PV design and run the required load calculations for the racking structure based on the manufacturer's datasheets.
Whether you work for a solar firm or your own business, you can easily make the best selection of components for the entire PV system. Furthermore, you can suggest the optimal solutions for each PV system type based on the properties of the location of the system.
In the next lesson, we will take a detour to visit one of the main concepts when we design PV systems, which is system sizing for both grid-connected and stand-alone PV applications.
Reminder - Complete all of the Lesson Requirements!
You have reached the end of this lesson. Before you move to the next lesson, double-check the list on the first page of the lesson to make sure you have completed all of the requirements listed there.
Lesson 6: System Design Processes for Grid-connected and Stand-alone Systems
Overview
Lesson 6 Scenario
You work as a solar system designer for a solar company. You have two potential clients who want to install PV systems. The first client is interested in a grid-connected system, while the other wants an off-grid system. After reviewing data collected by the sales representative from the site, your task is to accurately size these systems.
What do you look for when deciding the system size in regard to the load demand? Is there a difference between grid-connected and off-grid PV system design? What are the steps to designing each system?
In this lesson, we will find answers to these questions, and we will discuss topics ranging from load analysis to PV system design. This lesson prepares solar professionals to become PV system designers. Sizing PV systems is similar to art, where using the right tools ensures the PV system is sized to function properly.
Learning Outcomes
At the successful completion of this lesson, students should be able to:
- Compare sizing strategies and methodologies for different PV system types.
- List factors that affect sizing a PV system.
- Calculate load requirements for different PV system types.
- Apply tools for sizing grid-connected and stand-alone PV systems.
What is due for Lesson 6?
Lesson 6 will take us one week to complete. Please refer to the Calendar in Canvas for specific time frames and due dates. Specific directions for the assignments below can be found within this lesson and/or in Canvas.
Complete the following Lesson Assignments:
- Read through the Lesson Content
- Complete the Required Reading Assignments:
- Chapter 9, Photovoltaic Systems by James P. Dunlop (text)
- Look over the Recommended Reading:
- Complete the Lesson 6 Activity
- Participate in the Lesson 6 Discussion
- Take the Lesson 6 Quiz in Canvas
Questions?
If you have lesson specific questions, please feel free to post to the Lesson 6 Questions discussion forum in Canvas. While you are there, feel free to post your own responses if you, too, are able to help a classmate with a question. If you have questions about the overall course or wish to share and discuss any "extra" course related commentary (interesting articles, etc.), please feel free to post to the General Questions and Discussion forum.
System Sizing Overview
In previous lessons, we learned about PV modules, batteries, and inverters in terms of performance characteristics and main parameters. At this point in the class, we will introduce the concept of sizing PV systems. System sizing involves the detailed calculations of the energy produced by the PV system and matches it with the desired energy demand. We will put the knowledge we learned together, in addition to introducing some sizing tools that can be used to determine the exact number of modules needed to form a PV array. The main parameter that PV designers name as a goal when designing a PV array is the load energy demand or energy usage in (kWh).
When describing a PV system in terms of components, it is logical to use the energy flow path from the array side to the load side. However, when sizing a PV system, it is necessary to consider the energy demand before considering the PV supply side. For that reason, PV system sizing starts at the load side and proceeds backward to the PV array side. For example, PV designers need to know the energy usage (kWh) before choosing the PV array size.
Limitations to sizing
Not all clients/sites are ready to accommodate PV arrays. That can be due to one or more of the following factors:
- Factor 1: Space availability for the PV array (roof square footage/meter)
- Factor 2: Owner’s budget
- Factor 3: Annual energy consumption (client's energy bill in kWh)
PV systems are generally sized to maximize the solar utility for a client within these aforementioned limits. For the purpose of this class, we will focus only on the last factors that influence the sizing of any PV system. Before diving into the energy demand, let's elaborate more on these factors.
Factor 1: Space availability for the PV array (roof square footage/meter)
Before installing a PV system, it is important to make sure that the site is suitable for installation by considering the following factors:
- Shade-free (Sites are best optimized when there is no shading on the PV array.)
- South-facing (In the Northern Hemisphere, the sun path is generally leaning towards the south. The opposite applies to the Southern Hemisphere where the sun appears to be towards the north of an observer.)
- No obstruction (Sites need to have minimum obstructions before installing PV arrays. Obstructions may include chimneys, gables, HVAC units on rooftops, and so on.)
Factor 2: Owner’s budget
Budget is an essential factor that plays a huge role in the design process. It varies with available rebates and incentives at each location. As we mentioned previously, this class will not consider the finances of PV systems, as it is covered in other RESS classes.
Factor 3: Annual energy consumption (client's energy bill)
When sizing a PV system, It is important to consider the following criteria:
- PV system size to meet 100% of client's annual energy usage kWh
- PV system size to be permissible by utility interconnection rules
In the next topic, we will discuss how annual energy demand is estimated and how to go about understanding the client’s energy bill.
Energy Demand Analysis
As the name implies, the energy can be estimated at different levels, and that depends on the application intended.
For example, Grid-connected PV systems are more flexible to solar energy intermittence, since the utility grid is used as a backup source when more energy demand arises. With Stand-alone PV systems, since energy is delivered instantaneously to the load without utility grid backup, the load requirements are less flexible to energy supply. That is a consideration when sizing PV systems.
For all PV systems, the main sizing factor is energy consumption. That can be estimated or calculated depending on the energy data availability. The following scenarios summarize types of data provided to the PV designers before sizing the PV system:
- If the client can provide 12-month energy bills, the designer can then evaluate these bills to come up with the average monthly energy consumption and total annual energy consumption.
- If the client doesn’t have all 12 month bills but he/she can provide energy bills of some months, the designer should come up with a creative way to estimate the total annual energy based on the provided data.
- If the client doesn’t have any energy bill records at all, the designer should then run the estimation based on the client’s energy loads to come up with the total annual energy consumption. That is referred to as load analysis, and it will be discussed in this topic.
Energy Estimation
As seen earlier, energy estimation can be as easy as reading an energy bill, or it can be as challenging as running a load analysis. How do we go about it in either case?
Analyzing Energy Bill:
The total energy consumed can be calculated by using all monthly energy bills (in kWh) for the entire year. This is considered the most accurate method to estimate the average monthly and total annual energy consumption based on real data provided by the client. However, this method doesn't provide consumption detail such as daily energy demand or hourly energy demand, since the energy readings on the monthly bill are usually taken once a month.
Load Analysis:
In order for a designer to learn more about the daily or hourly energy demand of a property, more detailed calculations are required to achieve that task, and that is typically done at the load level. The hourly and daily consumption can be measured for any property; however, this method requires using energy analyzing devices at the meter side for a significant period of time. This method will generate the most accurate energy consumption data. However, it requires more time and budget.
Since power demand is usually stated on the rating of each device/appliance individually, there should be an easier way to estimate daily energy demand. We learned in "Electricity Basics" in the Orientation that power is not the main sizing parameter. Since the same load can consume zero energy if it is turned-off, or it can consume a lot of energy when it is turned-on for a long period. Energy consumption is based on the power demand over a period of time.
Since most loads don’t run continuously for the entire day, operating time is another parameter that should be considered when estimating the total energy consumption of a device.
When running load analysis calculations, it should be noticed that there are two types of loads:
- AC loads that requires AC power to run. (Note: this is what most of our loads are.)
- DC loads that can be run directly from the PV system.
Power generated from the PV array is DC power, and in case there are AC loads, power conditioning units are used as described in previous lessons. Since PCU is not 100% efficient, it will consume some energy. That should be added to the load analysis as an additional energy usage. The energy consumption of an inverter is estimated by its conversion efficiency.
Example:
As a result, the total required energy that should be provided by the PV array is calculated as follows:
Where:
Esdc is the required daily system DC (Wh/day)
Eac is the AC energy consumed by load (Wh/day)
Eff is the inverter efficiency
Edc is the DC energy consumed by loads (Wh/day)
Note:
To learn more about load analysis, please refer to the required reading of Chapter 9 in the text.
Grid-connected system sizing
Grid connected systems, or utility interactive system design, is very straight forward. We saw an example of PV sizing when we did the basic simulation exercise in Lesson 1, when we learned about PVWatt and SAM software. As can be noticed, PV annual energy production varies according to the location of the system that is provided by the solar radiation resources of each specific location. These systems are usually designed to either meet 100% of the annual energy demand of the load, or only to offset a percentage of the energy usage that the client desires.
Example:
A 1kW PV system located in State College, PA, can generate 1,231 [kWh/yr] at 30° tilt and true south orientation (180° Azimuth).
Assuming the client's energy consumption is 6500 kWh/yr, What is the PV system size?
Another way to calculate PV system size is to use the average daily solar radiation, also known as Peak Sun Hour (PSH), of that location. PSH can be defined as the equivalent number of hours per day when solar irradiance averages 1,000 W/m2. For example, five PSH means that the energy received during total daylight hours during a day equals the energy that an irradiance of 1,000 W/m2 would have been received for five hours. To estimate the PV system size, we divide the energy consumption by the number of days per year (365 days/yr) to find the daily average energy consumption, and then divide that by the PSH of the location. The calculation can be done as follows:
Where:
Eusage is the annual energy consumption in [kWh/yr]
PSH is the Peak Sun Hours in [h / day], which is equivalent to the solar insolation in [kWh / m2 / day].
Example:
In State college, PA, we have PSH of 4.22 [h / day].
Since the PV system includes losses (such as inverter losses, cables losses, mismatch, soiling, degradation andso on), these factors can reach up to 25% of system losses. In other words, the actual size of PV system is:
Note:
To find the Peak Sun Hour for a location in the US, you can use PVWatt data or visit the Solar Radiation Data Manual for Flat-Plate and Concentrating Collectors website. [94]
Sizing Considerations
Consideration 1: Module Selection
Modules can form strings, as we learned in Lesson 2. In this case and after we size the system, it is important to find the required number of modules as follows:
Array Watts / Module = Number of modules
Some array size may be slightly different from the calculated system size due to the availability of modules sizes:
Example:
- . We can split them in TWO strings of 13 each
- . We need to round it up to 22 modules. We can split them in TWO strings of 11 each
Designers should consider the derate factors of the module when sizing a PV array, such as: modules’ power tolerance, power degradation with time, temperature coefficients that lower the power of the module, and array wiring mismatch.
Consideration 2: Inverter Selection
As discussed in Lesson 4, inverters vary by voltage ranges and efficiency. Designers should consider inverter efficiency and MPPT efficiency when sizing PV systems.
Consideration 3: Site
Designers should account for any environmental factors that may contribute to losses in the PV array when sizing the system, such as soil, snow factors, or shading losses.
Note:
To learn more about interactive system sizing, please refer to the required reading of Chapter 9 in the text.
Stand-alone system sizing
Critical design analysis
A PV system cannot generate constant energy for the entire year, but a stand alone PV system should be able to supply loads during any month of the year, and since solar energy generation varies by month, a PV designer should take into account the critical design value for the PV system. For example, if the application requires more energy during the winter, where low insolation occurs, then the PV system should be sized to meet the load requirement of that specific month or season.
Critical design month:
When the PV system needs to meet different load requirements throughout the year, the month with the highest design ratio is referred to as the critical design month. It is taken into account the worst-case scenarios associated with the lowest insolation and highest load demand. We can analyze this design ratio at three tilt angles: Latitude, Latitude +15, and at Latitude -15 degrees. As we said, the highest ratio value will be the critical ratio and the month associated with it is the critical design month.
Considerations:
Since array orientation has a significant impact on generated energy, the orientation should be chosen to match the critical design month. For example, if a 15° tile produces more energy during the critical design month when compared to a 25° tile, a designer should consider the 15° to optimize the system design as long as it doesn’t affect other design months' values. The cost associated with the lower tilt is another factor to take into account when selecting the racking materials.
System design voltage
PV system DC voltage link is determined by the battery bank in stand-alone systems. As we discussed earlier, battery voltage can be 12V, 24V, or 48V. The voltage level changes depending on system size. As a rule of thumb, small PV systems are usually 12V systems, and larger systems are preferred to be 48V to handle more current. Some very large systems can be 120V, but that is considered a special case.
System Availability
Since the solar irradiance is not always available, stand-alone systems need to be sized to meet load demand for the entire year, and that is expressed by system availability, which is the percentage of time that a stand-alone system can meet the load demand within the period of a year. It is determined by isolation and autonomy. Autonomy is the amount of time the load will be supplied from the battery bank by itself, and is expressed in days. For example, 95% availability (3 days of autonomy assuming PSH is around 5.0 for that location) means that the system cannot meet the load demand for 5% of the time.
Note:
This figure illustrates that local sun hours for any location along with the desired system availability determine the system autonomy (in days). It is also important to know that the system availability depends on how critical the load application is. For critical loads, 99% is considered acceptable (10 days of autonomy if your average PSH is around 4.0)
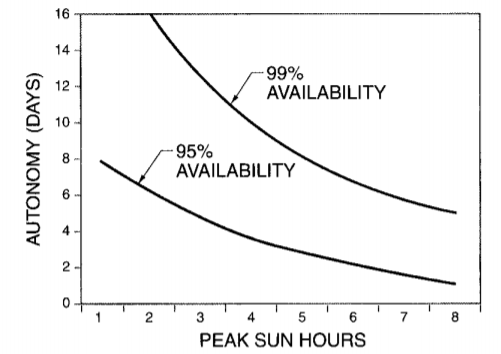 .
.
You can refer to chapter 9 in textbook to read more.
Battery Sizing
After we learned in Lesson 3 about the main parameters of batteries, we established that batteries are used to store energy for later use. A stand-alone system is a perfect application.
Battery bank required output capacity
Considering the daily energy demand during critical design month and desired days of autonomy, the batteries should be able to provide energy to the load for all of the autonomy days.
Example:
The required battery capacity is calculated as follows:
WhereBout is the required battery bank output capacity (Ah)
Ecrit is the required daily system energy demand for the critical month (Wh/day)
Ta is the days of autonomy
Vsdc is the nominal DC-system voltage
Battery bank rated capacity
As we established in Lesson 3, no battery can be completely discharged, and that is referred to as allowable DOD that a battery cannot exceed. It ranges from 20%-80% depending on battery type. Also, the operating temperature affects the available capacity the battery can deliver. Low temperature with high DOD can reduce the available battery capacity. Finally, the discharge rate is a main factor that determines the available battery capacity at certain temperature. This is expressed as a derating factor to the available capacity.
Example:
To put all factors together, we can write:
Where:
Brated is the battery bank rated capacity (Ah)
Bout is the required battery bank output capacity (Ah)
DODa is the allowable depth of discharge
Ct,rd is the temperature and discharge -rate derating factor
Array sizing
A PV array should be sized to supply enough energy to meet the load demand at the critical design month while accounting for the system losses. This will ensure that system availability is high, and the battery bank is charged.
Rated array output
Similar to grid-connected systems, array size can be determined using the peak sun hours of the location. However, since we have different DC system voltage depending on the system, it is more desirable to calculate the array current. Furthermore, off-grid systems include batteries. These batteries are not 100% efficient, so this should be taken into account.
Example:
Where:
Iarray is the required maximum power current [A]
Ecrit is the required daily system energy demand for the critical month (Wh/day)
ηbatt is the battery efficiency
Vsdc is the nominal DC-system voltage
TPSH is peak sun hours for the critical design month (hr/day)
There are factors that reduce the output of any PV array.
Note:
This section is thoroughly covered in Chapter 9 in the required reading textbook.
Lesson 6 Activity
| Activity | Details | ||||||||||||||||||||||||||
|---|---|---|---|---|---|---|---|---|---|---|---|---|---|---|---|---|---|---|---|---|---|---|---|---|---|---|---|
| Assignment |
Assume you have a client in State College, PA who is interested in a PV system. Scenario 1:The client is connected to the Utility Grid, and he is interested in saving money on his energy bill.Scenario 2:The client currently runs his property based on a Diesel Generator, and he is looking for a cleaner and alternative option. The Diesel Generator system availability is currently 95%.You are given the following information in regard to monthly electricity usage:
DeliverableFor each of the scenarios, use the appropriate tools or calculation methods to find the following:
Use the following values when applicable:
Write up a report with your findings. The report should be saved as a PDF, and it should be no more than two double-spaced pages in a 12 point font. |
||||||||||||||||||||||||||
| Submission Instructions and Grading | Please visit the Lesson Activity [76] page for submission instructions and grading information. |
Lesson 6 Discussion
| Activity | Details |
|---|---|
| Assignment |
Post original entry:We talked in class about sizing processes for both grid-connected and stand-alone PV systems. However, based on the Lesson 1 Discussion [95], we learned that PV systems classification can include a more specific market sector such as:
Discuss why there might be specific sizing considerations for one of the options. Support your discussion with facts (you may research the same solar installation example you selected for the Lesson 1 Discussion). Post comments:Respond to two different opinions of others' posts. (For example, if you choose Option 1, you need to respond to one post for Option 2 and another post for Option 3 or 4.) |
| Requirements, Submission Instructions, and Grading | For more detailed instructions about the discussion component of this course, including how you will be graded, please visit the Discussion Activity [96] page. |
Summary and Final Tasks
In this lesson, we covered a variety of topics starting from different methods to estimate energy demand, including use of energy bills and detailed load analysis. By now you can assist your client in the scenario by providing an accurate PV system sizing taking into account factors that affect the energy output for both grid-connected and stand-alone systems. Furthermore, as a designer, you have the right tools to optimize your stand-alone system design by choosing the right critical design month and parameters.
In the next lesson, we will focus on the standards and regulations that govern PV system design and installation, such as building, fire, and electrical building codes.
Reminder - Complete all of the Lesson Requirements!
You have reached the end of this lesson. Before you move to the next lesson, double-check the list on the first page of the lesson to make sure you have completed all of the requirements listed there.
Lesson 7: PV Related Codes and Standards
Overview
Lesson 7 Scenario
After you finished sizing your PV system and upon selecting all required components, your director asks you to fill in for another employee who is in charge of preparing design documents for permitting and inspection. Now that you know the location of your PV system, you ask yourself about the regulations and standards that your system should comply with to get the permit approved so that installation can start. Do the requirements differ by the building type? Or is it the PV system mounting structure type that has more influence on the codes? Is there any consideration for fire regulations? Assuming you got the PV system permit approved and installed, can the integrator commission the system without having it inspected? If yes, who is responsible for the inspection?
In this lesson, we will discuss topics starting from building, fire, mechanical, and electrical codes, and then we will finish with the inspection requirements for PV systems. Whether you are a PV designer or installer, it is important to familiarize yourself with various codes and regulations to efficiently work on PV systems at different scales. We will also see that codes apply to all PV scales, starting from small residential systems to large scale PV plants.
Learning Outcomes
At the successful completion of this lesson, students should be able to:
- Identify relevant electrical and building codes that govern PV systems at various locations.
- Discuss standards and design qualification testing that help ensure the safety and reliability of PV system components such as UL, local, and national electrical code NEC articles.
- Identify important warning signs and equipment labeling, notes, and other safety requirements associated with PV systems.
- List design guidelines, drawing, and documentation requirements and methods.
What is due for Lesson 7?
Lesson 7 will take us one week to complete. Please refer to the Calendar in Canvas for specific time frames and due dates. Specific directions for the assignments below can be found within this lesson and/or in Canvas.
Complete the following Lesson Assignments:
- Read through the Lesson Content
- Complete the Required Reading Assignments:
- Chapter 13, Photovoltaic Systems by James P. Dunlop (text)
- Participate in the Lesson 7 Discussion
- Take the Lesson 7 Quiz in Canvas
Questions?
If you have lesson specific questions, please feel free to post to the Lesson 7 Questions discussion forum in Canvas. While you are there, feel free to post your own responses if you, too, are able to help a classmate with a question. If you have questions about the overall course or wish to share and discuss any "extra" course related commentary (interesting articles, etc.), please feel free to post to the General Questions and Discussion forum.
Code and Standard Overviews
In previous lessons, we briefly discussed applicable codes that apply to PV components such as Underwriters Laboratory (UL) and IEEE, which are the manufacturer's responsibility before they sell the final product.
In this lesson, we will elaborate more into different standards that are beyond the standards specific to PV components. If we zoom out a little to view the overall PV system, we see that there are various regulations and standards that need to be met before installing a PV system in the U.S. PV market.
There is a collaborative effort funded by international and local agencies (such as the U.S. Department of Energy) that dedicates experts to transforming solar markets by developing building codes, fire codes, electrical codes, utility interconnection procedures, product standards, reliability, and safety. In addition, a part of their overall strategy is to reduce barriers to the adoption of solar technologies and to stimulate growth in different marketplaces. There are various codes, standards and regulatory requirements applicable to PV installations. We will not address the content of most of these codes. However, we will help you become familiar with these organizations and main codes and standards that are most relevant to this course.
It is important to mention that most of the codes and standards, listed in this lesson, have been adopted in various states. However, some states are still working on adopting them, while others prefer to have a local city code. It is wise to consult with the city where the PV system will be installed to assure complying with the right local codes.
PV Related Codes
Building codes
The International Code Council (ICC)
ICC is an international organization that develops a set of comprehensive international model construction codes focused on building safety and fire prevention. Many ICC Codes (AKA I-Codes) have sections relevant to PV installations, including:
The International Building Code (IBC):
IBC covers all types of buildings, except the detached one and two family dwellings and townhouses that don’t exceed three stories in height. The IBC includes requirements for the fire class rating of PV systems, and it contains wind load calculations (as we briefly discussed in Lesson 5 when we talked about BOS structural calculations).
International Residential Code (IRC):
IRC establishes minimum regulations for one and two family dwellings and townhouses up to three stories in height that are not addressed in IBC. It brings together all building, plumbing, mechanical, fuel gas, and energy and electrical provisions, which include PV systems for one and two family residences.
International Fire Code (IFC):
IFC includes regulations governing the safeguarding of life and property from all types of fire and explosions hazards, which include PV systems. IFC addresses topics include general precautions against fire, fire department access, and fire safety requirements for new and existing buildings and premises. The IFC includes requirements for PV labeling, access and spacing, and the location of DC connectors and other. It is considered the most relevant to rooftop PV installations.
International Green Construction Code (IGCC):
IGCC is a model code focused on new and existing commercial buildings. It addresses green building design and performance to establish minimum green requirements for buildings. This code is related to the grading of buildings rather than safety regulations, as the previous ones do.
International Code Council Evaluation Services (ICC-ES)
ICC-ES involves technical evaluations of building products, components, methods, and materials. The evaluation process culminates with the issuance of technical reports that directly address the issue of code compliance and are useful to regulatory agencies and building-product manufacturers.
Note:
The International Code Council (ICC) [97] codes related to roofing and PV systems are highlighted below:
- The building code requirements for rooftop PV systems can be found in Chapter 15 of IBC [98] and Chapter 9 of IRC [99], 2015 editions.
- Requirements for PV systems installed on rooftops are found in Chapter 6 of IFC [100], 2015 edition.
Mechanical Codes
IAPMO Codes and Standards
The International Association of Plumbing and Mechanical Officials (IAPMO) works with government and industry to implement comprehensive plumbing and mechanical systems all around the world. There are many IAPMO codes and standards that pertain to PV installations.
Note:
The Uniform Solar Energy and Hydronics Code developed by IAPMO [101] contains thorough materials for PV systems.
Electrical Codes
International Electrotechnical Commission (IEC)
The International Electrotechnical Commission (IEC) [102] publishes international standards for all electrical, electronic and related technologies. The United States formed an IEC National Committee (USNC) to oversee the country's participation in IEC activities, and that is governed by the American National Standards Institute (ANSI). The IEC promotes international cooperation on all questions of standardization and the verification of complying to standards, and often serves as the basis for national standardization and as a reference when drafting international tenders and contracts. The IEC standards include all electrotechnologies, which also includes PV systems for energy production and distribution.
Note:
IEC Technical Committee 82 (IEC TC82) covers photovoltaic systems. The U.S. Technical Advisory Group (USTAG) provides input from U.S. stakeholders into IEC TC82 standards.
Institute of Electrical and Electronics Engineers (IEEE)
The Institute for Electrical and Electronics Engineering (IEEE) Standards Association [103] publishes hundreds of industry-driven consensus standards in a broad range of technologies and applications, including photovoltaic (PV) systems and the integration with the utility grid. The IEEE global outreach drives the functionality, capabilities, and interoperability of a wide range of products and services.
Note:
IEEE 1547 is the most widely used standard for PV applications interconnection regulations.
National Fire Protection Association
The NPFA 70: National Electrical Code (NEC) developed by National Fire Protection Association (NFPA) [104] issues the National Electrical Code® (NEC), the Uniform Fire Code, and other codes. The NEC is updated and published every three years and is considered to be the most comprehensive electrical safety installation requirements document in the world. Published by the National Fire Protection Association, the NEC is over 115 years old with 50+ editions and over 800 pages and articles. The first PV related article was added to the NEC in 1984 (Article 690) and is legislated into law by all states and most major cities in the US and some international places.
There are many articles of the NEC referenced in Article 690 that apply to PV installations. Whenever the requirements of Article 690 and other articles differ, the requirements of Article 690 apply.
Note:
For more information about related NEC articles to PV systems, refer to Chapter 11 in the text or the NEC free access on the NFPA website that is listed below.
Testing and Material Related Codes
ASTM International
ASTM International [106], also known as the American Society for Testing and Materials (ASTM), is an organization that develops international standards with a goal to improve product quality, enhance safety, facilitate market access and trade, and build consumer confidence. The ASTM has tens of standards that pertain to PV technology.
Note:
ASTM PV standards are developed by subcommittee E44.09 Photovoltaic Electric Power Conversion.
Underwriters Laboratories
As discussed earlier, Underwriters Laboratory (UL) [107] develops safety standards, including standards for PV related products. UL's standards are essential to helping ensure public safety and confidence, reduce costs, improve quality, and market products and services. Most products in the U.S. undergo UL testing and listing credentials.
Note:
PV-specific UL standards include:
- UL 1699, for Arc-Fault Circuit-Interrupters
- UL 1699B, AC AFCIs
- UL 1703, for Flat-Plate Photovoltaic Modules and Panels
- UL 1741 – Inverters, Converters, Controllers and Interconnection System Equipment for Use With Distributed Energy Resources
- UL 2703 – Rack Mounting Systems and Clamping Devices for Flat-Plate Photovoltaic Modules and Panels
- UL 3703 – Trackers. Draft standard will be available soon
- UL 8703 – Concentrator Photovoltaic Modules and Assemblies (Electric Safety for PV Concentrators). STP will be appointed soon
International Solar Energy Provisions
As we can see, finding the solar and PV related local and international codes can be a tedious task due to the variety of engineering disciplines involved in solar systems. Therefore, as a combined effort, ICC provisions coordinated and developed a model code to bring together all solar energy provisions found throughout the 2015 ICC (or I-Codes) that pertain to solar thermal and PV energy systems. As a result, ICC published the International Solar Energy Provisions (ISEP) that simplify the implementation of I-Codes in the jurisdiction where solar and PV systems are to be installed. Furthermore, since most PV system include electrical components and systems, NFPA 70 or NEC related articles are integrated into the ISEP 2015.
The ISEP is organized in chapters with related topics, and it differentiates between commercial and residential applications. You can also notice cross-references between I-Codes within the ISEP chapters. In additions, ISEP references other standards across the chapters, such as ASTM, IBC, IFC, IRC, NFPA 70 (NEC), and UL.
Note:
For the purpose of this class, students are encouraged to read through the ISEP chapters, such as Chapter 4 [RS] and Chapter 5 [CS], as they relate to Photovoltaic systems.
Let's look at an example:
If you are designing a PV system in a jurisdiction that approves international (I-codes), the ISEP 2015 will become handy to find related PV code sections such as LBC, IFC, and IRC code sections. Designers need to pay attention to the system installation type considerations to comply with these codes. For example, below we have two scenarios of PV systems:
Scenario 1
The PV system is a residential rooftop-mounted PV system.
Reviewing the ISEP Chapter 4 [RS], we can see that PV systems shall be designed and installed in accordance with section RS405(R907) and NFPA 70. RS405 states that PV panel or modules systems installed on rooftops shall be listed and labeled in accordance with UL1703 and shall be installed to resist the components and cladding loads specific in Table (IRC R301.292)), and adjusted for height and exposure in accordance with table (IRC R301.2(3)). In addition, installation shall be in accordance with the manufacturer’s instructions.
Scenario 2
The PV system is a commercial ground-mounted PV array.
Reviewing ISEP Chapter 5 [CS], we can see that PV systems shall be designed and installed in accordance with section CS509.1.2 (IFC 605.11.2) that states that PV installations shall be designed to provide designated pathways, access clearance, and spacing requirements according to NFPA 70 and IFC 605.11.
Note:
Refer to The International Solar Energy Provisions (ISEP) [108] Chapter 4 [RS] and Chapter 5 [CS] for more detailed information about the previous example of code compliance.
Labeling and Marking
We saw in the previous example that the ISEP adopted IFC 605 for electrical equipment, warning, and hazards. In addition, the National Fire Protection Association NFPA 70 (NEC 690) and International Fire Code (IFC 605) both require that marking is needed to provide emergency responders with appropriate warning and guidance with respect to isolating the solar PV system. This helps in identifying energized electrical lines that connect the solar modules to the inverter to prevent cutting these wires when venting for smoke removal.
Materials used for marking should be able to withstand extreme weather conditions. Different materials can be used for warning signs. Vinyl signs need to meet UL requirements, while plastic and metal engraved signs do not need to meet any UL standards.
In rare cases, fire can be caused by solar modules. An example of this occurred in a residential application in New Rochelle, NY. Complying to marking and labeling code requirements can help firefighters find the energized circuits in the property and disconnect the power to safely work on the property.
Labeling is required at certain locations in the electrical PV system, such as:
- PV modules labels: usually provided by manufacturers and has main electrical parameters such as current, voltage, and power.
- Disconnect labels: Either AC or DC sides, all disconnects need to be labels and visible. Labels must include maximum current and voltage. For PV systems, labels need to list the operating voltage as well. In addition, a warning sign needs to be placed on disconnect where terminals may remain energized in the open position.
- Point of connection labels: This is specific to interactive systems. A label needs to be located at the point of interconnection and must identify the interconnection utility service.
- Other energy source labels: For any other energy source, such as batteries, labels must indicate the maximum operating voltage and polarity of a DC system.
- Grounding labels: Whether the system is grounded or ungrounded, labels must identify the ground-fault current and a warning signage stating the grounded system may be ungrounded and energized.
Note:
For more information about labeling and marking, refer to Chapter 13 in the required reading of the textbook and National Electrical Code section on the National Fire Protection Agency (NFPA) [105] website.
Permitting and Design Requirements
As mentioned in the overview of this lesson, in addition to the aforementioned codes, local jurisdictions and municipalities can amend and change some codes to some extent. Local municipalities have final jurisdiction and authority for projects, so communicating with your Authority Having Jurisdiction (AHJ) and understanding permit requirements is going to be an important element of your job as a PV designer and installer.
Permitting and inspection
For most PV systems, permits are required from the building department, electrical department and, perhaps, fire department in some cases. The permits are important to ensure code compliance for a functional PV system.
After the permits are granted, installers and integrators can start the installation process. Upon the completion, an inspection should be scheduled to ensure complying with the design and installation standards. Inspection is usually done for the structural and electrical parts of the systems. Integrators will need to verify with their AHJ.
Design Requirements
Any solar design needs to meet certain requirements to function properly. The city, utility, or AHJ might request a design package that complies with national and local standards. This may include:
- The conceptual package showing the overhead of the location of the PV system and the utility interconnection point.
- The one-line and three-line electrical drawings showing how the electrical connection between components is done and check electrical code compliance, such as NEC.
- The mechanical and structural design showing the load on the PV array and the holding structure.
- Warning and signage that labels main parts of the PV system and provide guidance to utility personnel.
- Bill of material showing quantity and type of components used for the project.
- Official stamps by Professional Engineers (PE) for the electrical, mechanical, or structural documents (if needed).
- The specification datasheets for the main PV components.
Lesson 7 Discussion
| Activity | Details |
|---|---|
| Assignment |
Post original entry:In this lesson, we covered code applicable to PV systems. Based on previous discussions, we learned that PV systems classification can include more specific market sector, such as:
Discuss specific code considerations for one of the options. Support your discussion with facts (you may research the same solar installation example you selected for the Lesson 1 and Lesson 6 Discussions). (Hint: the fire hazard referred to in the lesson is an example of the labeling and code compliance for residential buildings. Also use ISEP to compare different PV system types and how codes might vary!) Post comments:Respond to two different opinions of others' posts. (For example, if you choose Option 1, you need to respond to one post for Option 2 and another post for Option 3 or 4.) |
| Requirements, Submission Instructions, and Grading | For more detailed instructions about the discussion component of this course, including how you will be graded, please visit the Discussion Activity [96] page. |
Summary and Final Tasks
Let’s go back to the scenarios from the beginning of this lesson, where you need to prepare the required documents for permitting to get approval on your PV system design before you start the installation process. By now, you should understand that PV installations involve different building, fire, mechanical, and electrical codes and standards. Furthermore, you learned that your local city may adopt the national and international codes with slight variation. You need to consult with your local AHJ to insure you are complying with the requirements of the location.
In the next lesson, we will zoom into the NEC code and discuss the various articles that are in concern to us as PV designers to insure a safe and functional PV system.
Reminder - Complete all of the Lesson Requirements!
You have reached the end of this lesson. Before you move to the next lesson, double-check the list on the first page of the lesson to make sure you have completed all of the requirements listed there.
Lesson 8: Applicable NEC Articles for Sizing Electrical Components of PV System and Grounding Requirements
Overview
Lesson 8 Scenario
Assuming the client, for whom you designed the interactive PV system in Lesson 6, closed the deal with the solar firm you work for. The next day, the design manager asks for the actual PV system design and documentation to be prepared. You happen to be a new employee with a good electrical engineering design background. However, your background is not directly related to PV systems. As you are familiarizing yourself with the PV electrical design process, you receive a call from the manager saying you are assigned a new project that requires electrical design to comply with the local codes. Fortunately, the NEC is adopted by the AHJ at the place where the system will be installed.
You previously learned that International Solar Energy Provisions adopted the NEC articles that relate to PV systems. So your first task is to understand and interpret the PV terminologies on the NEC and then interpret the articles that specify PV design requirements.
You noticed that NEC articles require an understanding of maximum voltage design, conductor ampacity and correction factors, voltage drop calculations, grounding and lightning, and the protection requirements.
In this lesson, we will train our PV designers to perfectly interpret the NEC articles that pertain to PV systems, and we will walk them through sizing and calculation processes to address the design issues mentioned earlier. Learning about NEC articles allows better understanding of the PV system as it integrates with other electrical systems. The knowledge available in this lesson is of interest to a wide range of audiences including designers, business owners, installers, or inspectors.
Learning Outcomes
At the successful completion of this lesson, students should be able to:
- Identify applicable fire and safety regulations affecting PV design and installation.
- Compare theories and practices for overcurrent protection and arc-fault protection.
- Calculate the voltage and current limits for various circuits of PV systems.
- Determine appropriate conductor ampacities and overcurrent protection ratings and types of conductors used for PV applications.
- Identify grounding requirements and electrical grounding methods.
What is due for Lesson 8?
Lesson 8 will take us one week to complete. Please refer to the Calendar in Canvas for specific time frames and due dates. Specific directions for the assignments below can be found within this lesson and/or in Canvas.
Complete the following Lesson Assignments:
- Read through the Lesson Content
- Complete the Required Reading Assignments:
- Chapter 11, Photovoltaic Systems by James P. Dunlop (text)
- Look over the Recommended Reading:
- Solar ABCs Expedited Permit Process Report - Revision 2 [109]
- Chapter 6: Solar Power System Design, Large‑Scale Solar Power System Design: An Engineering Guide for Grid-Connected Solar Power Generation by Peter Gevorkian [110] (pages 185-229) (*Penn State Login Required)
- Begin working on PV System Electrical Design Project
- Take the Lesson 8 Quiz in Canvas
*Students who register for this Penn State course gain access to assignments, all readings, and instructor feedback, and earn academic credit. Information about registering for this Penn State course is available through the Renewable Energy and Sustainability Systems Online Masters and Graduate Certificate Programs Office (link is external) [38].
Questions?
If you have lesson specific questions, please feel free to post to the Lesson 8 Questions discussion forum in Canvas. While you are there, feel free to post your own responses if you, too, are able to help a classmate with a question. If you have questions about the overall course or wish to share and discuss any "extra" course related commentary (interesting articles, etc.), please feel free to post to the General Questions and Discussion forum.
NEC and PV related terminologies
We learned in the previous lesson the importance of the electrical codes, and of the NEC in specific, to govern PV design and installation processes. NEC articles cover installation regulations for all PV installations including systems with less than 50V, utility-interactive systems, and stand-alone systems including billboards, remote installations, and RVs.
Terminologies
There are specific terms used for PV system components and circuits. The NEC differentiates between a PV power source and a PV source circuit for PV systems.
A PV power source is an array or collection of arrays that generates DC power.
A PV source circuit is the circuit connecting a group of modules together and to the common connection point of the DC system. PV source circuits are usually a string of series-connected modules. For small systems, the PV power source is usually only one source circuit. For larger systems, the PV power source is usually composed of several paralleled PV source circuits.
A PV output circuit is the circuit connecting the PV power source to the rest of the system.
Figure 8.1 illustrates the proper use of these terminologies and how they relate to each other in the PV system. The three strings of nine total PV modules that form an array are referred to as a PV power source, while each string of three PV modules is referred to as a PV Source Circuit. In this case, the PV system has three PV Source Circuits. As the conductors exit the PV array and are joined together in a combiner box, they form a single power source that links the inverter with the combiner box at the DC side of the PV. This is the PV Output Circuit.
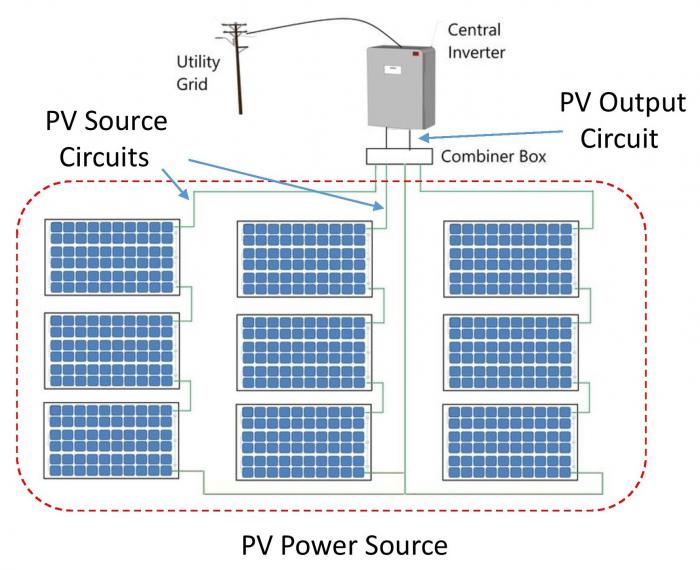
Voltage design
As we learned earlier in previous lessons, the maximum possible voltage is the array’s open-circuit voltage measured at the lowest expected temperature for the specific location (the lowest record temperature). There are two main methods for PV professionals to determine the maximum voltage of a PV array.
Method 1
As we learned in Lesson 2, the voltage can be calculated using the PV module manufacturer’s temperature coefficient for voltage. Temperature information is usually gathered from weather stations for each location.
Method 2
The voltage can be easily identified using an NEC correction table, depending on the ambient temperature ranges of the location. The NEC provides a temperature correction factor found in table 690.7. The factors of the NEC table make calculations for estimating the maximum voltage as easy as multiplying the string voltage by a single number.
Example
Assuming you have a PV system with the following specification:
- There are 10 modules in series that form a PV string.
- The individual PV module open circuit voltage is 38V and the temperature voltage coefficient is 0.0032V/℃.
- The lowest ambient temperature is -10℉.
Then the maximum voltage according to method 1 can be calculated as follows:
We can find the Tcell to be -23°C at very low irradiance or in other words, . We can apply equations from Lesson 2.
The maximum module’s voltage will be:
Then the maximum voltage of the string will be:
The maximum voltage according to method 2 can be calculated as follows:
Looking up the voltage correction factor corresponding to -10℉, the factor is 1.20 (found on NEC table 690.7).
The maximum voltage in this case is
Reflection
We can see that both methods gave results with increased voltage by a factor. However, these factors are not equal. What value should a Pv designer use when designing a PV string for maximum voltage.
ANSWER: The NEC table method is more conservative and easy to use without tedious mathematical calculations. Designers usually use NEC values to ensure code compliance. However, educated designers are encouraged to argue their calculations with utility design reviewers when they use precise calculations based on actual weather values and a PV manufacturer's datasheet for voltage coefficients.
Conductor/Wire sizing
Conductor Sizes
Conductor sizes are expressed in American Wire Gauge (AWG). Usually, larger diameter conductors have smaller AWG numbers. There are two types of conductors, either solid or stranded. Solid conductors consist of one solid core metal conductor that is usually ridged. On the other hand, stranded conductors consist of multiple smaller conductors stranded together and are usually more flexible. Stranded conductors are ideal for PV source circuits, facilitating module removal for servicing, or junction box access.
Reflection
Since larger conductors have greater current-carrying capacity, are they stranded or solid?
ANSWER: Larger conductors can be stiff and difficult to work with during installation. Therefore, larger conductors are stranded, which makes them more flexible.
Note:
Conductor sizes and corresponding diameters, area, and resistance can be found in NEC Chapter 9 on Table 8. You can also review the reprinted version in Chapter 11 of the textbook.
Conductor Ampacity
Conductor sizing is based on a conductor’s ampacity rating.
Ampacity is the current that a conductor can carry continuously under the conditions of use without exceeding its temperature rating.
According to the NEC, nominal conductor ampacity at 30°C is determined by the conductor material (copper or aluminum), size, insulation type, and application (direct burial, conduit, or free air). In NEC, table 310.15(B)(16) (formerly 310.16) is used to look up the ampacity rating for any conductor.
Ambient Temperature Derating
Temperature affects conductor’s ampacity; nominal ampacity is derated (reduced) when ambient temperature is higher than the nominal 30°C. Temperature-based ampacity correction factors can be found in NEC table 310.15(B)(2)(a). The correction factor is then multiplied by the nominal ampacity (found in table 310.15(B)(16) to calculate the derated ampacity. Therefore, for a certain current-carrying capacity rating, the size of the required conductor must be increased to account for higher temperature deratings.
Number of Conductors Derating
Since most PV systems consist of multiple PV source circuits that run to the combiner box, more than three current-carrying conductors can be run together in a conduit or a raceway for longer than 24′′. In this case, conductor ampacities must be further derated by an additional correction factor that can be applied to the temperature-corrected ampacity using NEC table 310.15(B)(3)(a), where designers can look up the corresponding ampacity correction factor based on the number of current-carrying conductors.
Reflection
Why is it needed to derate the ampacity when more than three current-carrying conductors are installed together?
ANSWER: Because bundling several current-carrying conductors together affects their ability to dissipate heat.
For example, if USE-2 conductors are used for three PV source circuits and are run through a conduit, each with positive and negative conductors, the total is six current-carrying conductors. The correction factor from the NEC table is 0.80.
Note:
The neutral conductor in a three-phase AC system is not considered a current-carrying conductor. We touched base on the conductor's insulators on the electricity basics in the orientation of this class, and we noticed that insulators can be different in types and materials. As a recap, insulation protects the bare conductor from coming into contact with personnel or equipment. Conductor insulation types used in PV systems must be compatible with the environmental conditions and ratings of the associated equipment, connectors, or terminals.
Reflection
What are the properties of insulating material for a conductor?
ANSWER:
- Maximum operating temperature,
- Application and Environmental resistance (such as to sunlight, oil, or moisture),
- Permissible installation locations (such as direct burial, in conduit, or exposed).
PV module electrical connections are usually installed with full exposure to extreme temperature, sunlight (UV), and precipitation. PV conductors need to be rated for outdoor applications with high temperature, moisture, and sunlight resistance. Insulation types UF, SE, USE, and USE-2 are permitted in PV source circuits, provided they have the necessary weather resistances. Single-conductor USE-2 is recommended because it has high temperature, moisture-resistance, and sunlight-resistance ratings, and is widely available. In the NEC, table 310.15(B)(2)(c) is used for ambient temperature increment due to conduits being exposed to sunlight on or above rooftops.
Conductors and color codes
Since a PV system is a mixture of both AC and DC systems, conductor color codes are similar to any other electrical system with each side of the system. For example, when we look at the DC side of the PV array, we should consider applying the DC color code. Once we exit the inverter, the color code of conductors should comply with the AC color code of electrical systems. Below are main considerations for the color codes of conductors.
- Grounded conductor must be white, gray or have three stripes, not green.
- Module frame ground must be bare or have green or green with striped insulation or identification.
- Grounded conductor is the negative conductor (white). No NEC requirement for ungrounded conductor. Use AC convention Black and Red.
- In two wire negative-grounded PV system, the positive conductor could be red or any color with red marking, except green or white.
- In a three-wire, center-tapped system, Positive conductor Red, center tap conductor must be white, and the negative conductor could be black
Note:
NEC articles 250.119 article 200.6(A)(2) are used to find the conductor color codes.
PV Circuit Current Requirements (sizing, protection)
As instructed in NEC 690.8 Circuit Sizing and Current, the wires from the PV modules to the inverter must be able to carry 156% of the short circuit current (Isc). This 156% comes from multiplying 125% twice; the first 125% accounts for the continuous duty that is used as a safety factor, whereas the second 125% is a factor that accounts for the extra current that PV modules might deliver. This current, that is higher than the rated short-circuit current of PV modules, can be generated when the solar irradiance exceeds 1000 W/m2. Therefore, the maximum output current is derated by a factor of 125% x 125% or 156%.
Circuit current is the sum of the parallel source circuit's maximum current, as calculated in 690.8(A)(1). This applies mostly for central inverter configuration.
PV Source Current [690.8(B)]
The maximum PV source circuit current is 125% in addition to 125% of the short circuit current. In our example, if a PV module has Isc of 8.60 A
Conductor Sizing [690.8(B)(1)]
Conductor size is chosen to be the smallest size that can safely conduct the maximum conductor current of a circuit (Imax). As discussed previously, the maximum current that the PV system can generate is 156% of Isc. That means the conductor must carry this amount of current.
Voltage Drop
Definitions
Voltage drop is defined as the amount of voltage loss that occurs through all or part of a circuit due to conductor resistance.
Conductor resistance is determined by conductor material, size, and ambient temperature.
Voltage drop highly depends on the total length of conductors that carry the electrical current. In DC systems, the voltage drop length is the total (round-trip) distance that current travels in a circuit. So the total length used in calculations is usually twice the length of the conductor run. In some AC systems, the distance equals the length of the conductor.
Reflection
Why is the conductor length different for AC and DC circuits?
ANSWER: Since the current flows constantly in DC circuits, the current will travel back and forth. In this case, the distance is twice the length of a conductor. The same applies to two-wires single phase (120V in the USA or 220 in Europe), the AC Voltage Drop is calculated in the same way in which the distance is twice the length of the wire. (to account for the Phase and the Neutral wire lengths as the current travels back and forth through them).
- In the three-wires single phase (AKA split-phase in the USA), the voltage is still 120V between the phase and the neutral, but the current doesn't travel back through the Neutral wire. This is a result of the nature of the phases being split (with180 degree phase shifted) so the Neutral wire only returns the imbalanced current. In a balanced load condition, the return current (through the Neutral wire) equals Zero.
- In the four-wires three phases systems, the same situation arises, as the Neutral is not supposed to return any current under balanced load conditions.
Since most single-phase PV inverters are rated at 240V, the Voltage Drop for split-phase is calculated as follows:
One can calculate the voltage drop using the two-way trip distance at 240V (the same equation used for DC circuit) but your voltage will be the phase-to-phase 240V instead of the 120V phase-to-neutral.
Voltage drop from PV array to inverter
NEC doesn’t require the calculation of voltage drop because it’s not a safety issue. However, it does recommend a maximum voltage drop of 3%. It is recommended to have up to 2% voltage drop at the DC side while only 1% is accepted at the AC side of the system for a total of 3% in voltage drop for the entire system.
Wires should be sized to reduce resistive (heating) loss to less than 3%. This loss is a function of the SQUARE of the current times the resistance, which is another manifestation of Ohm’s law:
And the resistive loss is in Watts.
Note:
Use a wire-sizing table to choose the right wire size for the current and voltage you are working with. Visit Encorewire.com [111] for an example.
Example
Computing the voltage drop formula:
Where:
is the circuit operating current, which for source circuits is usually taken as the maximum power current, Imp,
L is the total conductor length.
is the voltage at which you want to find VD, and
is the wire’s resistivity in Ohms per 1000 feet and is found from NEC Chapter 9, Table 8 conductor Properties.
Example
If we have a PV array that is located 150’ away from the inverter (L=150 ft) and we are using wire # 14 AWG since it handles the current of 8.23A, and it has resistivity of 3.14 (Ω/kft).
The operating Voltage is
The voltage drop then is calculated as:
, which is not within the limit of 2%, but this wire is running to a combiner box and to the inverter. In this case, the voltage drop should be less and the size of conductor must go up.
Upgrading to a larger conductor size for the same length and conductor type:
The voltage drop then is calculated as:
As can be seen, both conductors sizes # 12 and #14 work for ampacity, but the voltage drop calculation shows that both of them still not the best option for the long term. As a result, cable # 10 AWG is a more conservative design, but it will cost more.
Note:
There are some freely available tools that can be used for voltage drop calculation. This is an example of an Online Calculator. [112] If there is no DC option for the calculator, you can use single phase and choose the right length.
Protection Devices and Disconnects
Overcurrent Protection Devices (OCPD)
Overcurrent protection devices are classified by how quickly they activate. Overcurrent protection devices can include fuses and circuit breakers.
A non-current-limiting device operates slowly, allowing damaging short-circuit currents to build up to full values before opening. An example is a fuse, which is a link that melts when heated by current greater than its rating to provide overcurrent protection due to extra loading.
A current-limiting device opens the circuit in less than one-quarter cycle of short-circuit current, before the current reaches its highest value, limiting the amount of destructive energy allowed into the circuit.
Overcurrent protection devices must be listed and specifically rated for their intended use, such as DC. For example, automotive fuses may not be used in PV systems.
Sizing OCPD
OCPD are highly recommended for PV systems and are sized not to be less than the highest current.
- DC array side
- Since the derate factor is 156% of the short circuit current of the PV module, the OCDP is sized not to be less than that value, since the 125% factor is included already as part of the calculation.
- AC side
- At the output of the inverter, OCPD are usually sized to be at least 125% of the highest inverter current possible, provided from the manufacturer’s datasheet.
Disconnects
A disconnect must be provided to open all current-carrying conductors of a PV power source from all other conductors in a building or structure. This disconnect is also known as the DC disconnect or PV disconnect. Disconnects used in the PV output circuit must be rated for DC and identified as such. Equipment such as PV source-circuit isolating switches, overcurrent protection devices, and blocking diodes are permitted on the array side of the array disconnect.
Disconnects Sizing
-
DC array disconnect
-
Since the derate factor is 156% of the short circuit current of the PV module, the DC is sized not to be less than that value, since the 125% factor is included already as part of the calculation.
-
-
AC disconnect
-
At the output of the inverter, disconnects are usually sized to be at least 125% of the highest inverter current possible, provided from the manufacturer’s datasheet. In an interactive system, the PV system’s AC disconnect should be located near the main utility disconnect. This facilitates the quick removal of all power to a building or structure in an emergency.
In stand-alone systems, the AC disconnect is typically located near the array disconnect or the AC power distribution panel. Disconnects must be provided to open all ungrounded conductors to every additional power source and each piece of PV system equipment. Other equipment that requires disconnecting means can be inverters, charge controllers, and other major components. If equipment is connected to more than one power source, each power source must have a designated disconnecting means. It is particularly important for battery bank circuits to include a specific DC disconnect.
-
Grounding and lightning
Grounding
Grounding provides a path for fault current or lightning surges to flow through to protect people and equipment from electric shock hazards.
Equipment Grounding Conductor (EGC)
PV modules mounted to metal racks are effectively grounded when the module frames are secured to and in electrical contact with the rack, and the rack is grounded. However, since the integrity of the electrical contact between the module frames and mounting structure cannot always be assured, individual module frames are connected together with equipment grounding conductors (EGC). This can be accomplished with a few continuous runs of bare conductor that are secured to each module with a special connector, or with many short bonding jumpers between adjacent modules.
Note:
Some exceptions apply to mechanical WEEBS or similar devices that bite into the modules frame and the raking rails, and they are UL listed as grounding devices. In this case, equipment grounding conductors are not required.
When ground-fault protection is used, PV circuit equipment grounding conductors are sized in accordance with Article 250, which establishes the minimum size for equipment grounding conductors based on the overcurrent protection rating in the circuit. NEC table 250.122 is used for sizing. For example, if the PV output circuit overcurrent protection device is 60 A, then a 10 AWG equipment grounding conductor is required. When the sizes of ungrounded conductors are increased above what is required (such as to decrease voltage drop), the equipment grounding conductors must be increased proportionally.
Grounding Electrode Conductor (GEC)
A grounding electrode is a conductor rod, plate, or wire buried in the ground to provide a low-resistance connection to the earth. NEC 690.47 establishes requirements for grounding electrodes used for PV systems. Most PV systems involve both AC and DC systems, and they are considered two separate systems according to NEC article 690 since the DC grounded conductor is not directly connected to the AC grounded conductor.
Array Grounding
Some AHJ may require an interpretation of some NEC editions to include an array grounding in addition to the DC grounding requirements. It is a grounding electrode that is buried in the ground as well.
Note:
For more information about the grounding and lightning, you can refer to Chapter 11 in the textbook.
Ground fault protection
Ground Fault is the undesirable situation where the current flows through grounding conductors. Ground Fault Protection is mentioned in NEC 690.5 and is not required for ground mounted arrays. It is required for PV systems mounted on roofs of dwellings. The ground-fault circuit breaker trips when current between the grounded and grounding conductors exceeds its rating and forces the other circuit breaker to open the ungrounded conductor. For low-voltage PV systems, a pair of circuit breakers can be used to provide array ground-fault protection. For interactive PV systems, ground-fault protection is usually built into the inverter, which includes a serviceable fuse. In order to fulfill the requirement to open the ungrounded conductor, the inverter is designed to immediately shut down if the fuse is opened.
A ground-fault circuit interrupter (GFCI) is a device that opens the ungrounded and grounded conductors when a ground fault exceeds a certain amount, typically 4 mA to 6 mA. It does this by sensing a difference between the current flowing out through the ungrounded conductor and returning through the grounded conductor.
A GFCI device is used in AC branch circuits to protect persons from electrical shock hazards. GFCI protection is often included in receptacles and is required in wet environments, such as bathrooms, with a greater potential for ground faults. Article 210, “Branch Circuits,” provides details and required locations for GFCI devices.
Lightning protection
Because PV arrays are mounted on elevated buildings and structures such as rooftops and poles, many PV systems are protected from potential lightning that can cause severe damage. Lightning protection system requirements are covered briefly in Article 250 and more extensively in NFPA 780 (Standard for the Installation of Lightning Protection Systems). Lightning protection is especially important in places where the probability is high, such as the southeastern United States.
Lightning protection systems consist of a low-impedance network of air terminals (lightning rods) connected to a special grounding electrode system and not connected to the DC or array electrode conductors.
PV System Electrical Design Project
This week, you will begin working on your PV System Electrical Design Project. This will be a two-lesson project.
| Activity | Details |
|---|---|
| Assignment | This project will help our solar professionals gain skills in designing the electrical documents for PV systems. The project asks to develop a one-line electrical design of a PV system showing all related calculations and details to comply with NEC article 690. The project then puts you in three different scenarios that require you to evaluate the interconnection requirements, depending on the size and rating of the electrical service of the property. Visit the PV System Electrical Design Project [113] page for the complete details of this assignment. Note: You will not be submitting this project within this lesson. You will be submitting the entire project at the end of Lesson 9. |
Summary and Final Tasks
After discussing PV system main components, system sizing strategies, and building and fire codes that govern the design and installation of any PV system, our design team is ready to dig deeper into the essential electrical code NEC articles to start preparing the required engineering design permitting documents to submit to the utility grid engineering reviewers. This process requires a detailed NEC interpretation of article 690 and 705 and other code articles that pertain to PV systems, as we saw in this lesson.
By now, our design team is one step away from being granted the permit. That missing part is the interconnection requirements by the utility grid where the system will be installed.
In the next lesson, we will discuss the interconnection requirements and methods where they apply to PV systems, and we will talk about some issue related to the interconnection of PV systems such as neutral loading, phase balance, and metering. See you next week!
Reminder - Complete all of the Lesson Requirements!
You have reached the end of this lesson. Before you move to the next lesson, double-check the list on the first page of the lesson to make sure you have completed all of the requirements listed there.
Lesson 9: Interconnection Requirements and Methods
Overview
Lesson 9 Scenario
You are working on the electrical design for the same PV system as you did in Lesson 8. As you complete the NEC design for the PV array, you reach the point of interconnection with the utility grid at the meter side. You ask yourself, "What are the requirements and methods to hook the PV system up to the grid? Is it as simple as connecting the power terminals to the utility meter? Or does it require a detailed study of the existing electrical service?"
In case the site evaluation documents provided by the sales team are missing the information regarding the main service distribution panel, what information do you need to gather from the site to be able to proceed with the electrical design? Do you need to consult with the utility plan reviewers to check on any additional requirements for interconnection? How can the customer sell back the produced energy from the PV system?
In this lesson, we will discuss issues related to the interconnection requirements and methods according to the NEC that will answer these questions. In addition, you will be prepared to complete the electrical permitting documents required before the installation process. PV designers and installers need to comply with the interconnection requirements referenced in the National Electrical Code (NEC) and IEEE standards to ensure the systems function properly and avoid safety hazards.
Learning Outcomes
At the successful completion of this lesson, students should be able to:
- Identify grid interconnection codes and standards for distributed generations DG.
- Identify and compare types of grid interconnection methods according to NEC article 690.
- Compare utility requirements for PV System interconnection at different locations in the US and how they affect PV design and installation.
What is due for Lesson 9?
Lesson 9 will take us two weeks to complete. Please refer to the Calendar in Canvas for specific timeframes and due dates. Specific directions for the assignments below can be found within this lesson and/or in Canvas.
Complete the following Lesson Assignments:
- Read through the Lesson Content
- Complete the Required Reading Assignments:
- Chapter 12, Photovoltaic Systems by James P. Dunlop (text)
- Look over the Recommended Reading:
- Expedited Permit Process for PV Systems [109] (Note: this is also the link to the electrical design project in Lessons 8 and 9.)
- Participate in the Lesson 9 Discussion
- Submit PV System Electrical Design Project
- Take the Lesson 9 Quiz in Canvas
Questions?
If you have lesson specific questions, please feel free to post to the Lesson 9 Questions discussion forum in Canvas. While you are there, feel free to post your own responses if you, too, are able to help a classmate with a question. If you have questions about the overall course or wish to share and discuss any "extra" course related commentary (interesting articles, etc.), please feel free to post to the General Questions and Discussion forum.
Review
Some of the content in AE 868 is directly related to topics that are already discussed in other courses. However, these topics are essential building blocks on what we will cover in AE 868. Please take the time to review the topics here or where noted throughout the lesson.
Distributed Generation (DG)
We discussed earlier the value of the utility grid and how it serves as the energy reservoir. Most traditional utility grids are built based on the central generation strategy that entails that the power plant is located somewhere with high capacity to supply loads at different locations through transmission and distribution lines.
Note:
For more information about the central power generation, please refer to EME 810 (The Power Grid System) [11]. This link is also provided in the review section of this lesson.
On the other hand, Distributed Generation (DG) is a system that generates power near the point of consumption, which is also referred to as the end user. Whether it is a diesel generator or PV array, all power will be injected into the grid system. DG can also be fuel cells, wind turbines, and other sources.
DG systems are becoming a more common supplement to the traditional central power generation. DGs have the advantages of lower power losses since the generation is close to the load, so both customers and utility can benefit from it. Customers can benefit from DG when there are power outages if the DG contains backup storage. Utilities can benefit from DG by expanding its capacity without physically adding new central plants. With these advantages also come some challenges, since the DG can be installed anywhere on the utility grid. Most utilities noticed the importance of assuring a safe and reliable DG interconnection without having any negative impacts on the utility grid - especially the distribution power system. This lesson will discuss some related codes and standards that are important to interconnect DG sources to the utility grid in the United States.
Interconnection Codes and Technical Issues
As we have discussed, most PV systems contain power conditioning units or inverters. In addition, in order for any PV system to be connected to the utility grid, there has to be a set of test standards and codes to govern the interconnection process for a safe and reliable power delivery. In this section, we will discuss main interconnection standards that relate to PV systems such as IEEE, UL, and NEC standards. Solar professionals and designers should always look for the most up-to-date standards in this regard and consult with the local AHJ for any additional legislation.
Main Interconnection Standards
IEEE 1547
IEEE 1547 [103] is a standard for interconnecting distributed resources with electric power systems. IEEE 1547 contains a family of standards, guides, and recommended practices. Solar professionals and designers should consult with all series of IEEE 1547 standards.
UL 1741
UL 1741 [114] is the testing standard related to DG equipment such as inverters and charge controllers. It is considered a supplemental standard to IEEE 1547. UL 1741 is important because it is listed in NEC article 690.
NFPA 70 (NEC Article 690)
In addition to the sizing requirements we discussed in Lesson 8, NEC Article 690 requires that all inverters be listed and identified for interactive operation. Most requirements are based on equipment testing under UL 1741. Inverters must meet anti-islanding and disconnect from the grid when voltage is lost, and must remain disconnected until grid voltage is restored to the accepted measure.
Interconnection Technical issues
All DG, including PV systems, introduces additional power at the customer location that has not been planned to exist when it was first designed. With this new addition, some technical issues and difficulties face the utility companies at the interconnection side. Some of these technical issues can be overcome by early adoption of standards, and some are enforced after the systems are installed.
Islanding
Islanding is the undesired condition when the DG source, such as a PV system, continues to supply power to the grid during a utility outage. This may cause a serious safety hazard to utility workers who are exposed to unexpected energized power lines. To prevent damage to personnel and equipment, all grid-bound inverters must be able to detect outages and block power transfer to meet UL 1741 equipment testing standard. Inverters with such capability are referred to as anti-islanding inverters. However, Bimodal inverters may function in stand-alone mode of operation while being disconnected from the utility grid line during outages.
Power Quality
Power quality is a topic that discusses several electrical performance parameters, such as voltage, frequency, and harmonic distortion. Power quality of a grid can be affected by loads and equipment connected to the grid, such as power electronics equipment that operates on discrete modes and causes quality issues, which may damage sensitive equipment or create hotspots in transformers. Since DG sources including PV inverters contain switching devices, most utilities are concerned about the interconnection of PV systems and power quality issues associated with it. For that reason, utilities mandate that all DG interconnected equipment must meet certain power quality limits such as current harmonics, voltage flickers, and other parameters and utilities must continuously monitor these parameters to insure a reliable grid operation.
Neutral Loading
A particular over current problem arises when one stand-alone inverter with a 120 V output supplies a 120/240 V distribution panel. A similar problem can occur with interactive systems of single-phase 3-wire or 3-phase, 4-wire wye configuration when loads are concentrated on one phase more than the other. The single grounded (neutral) conductor can become dangerously overloaded. Therefore, the grounded conductor may carry twice its rated circuit current, and this is a serious concern discussed on NEC 705.95 that requires the sum of the maximum load between the neutral and ungrounded conductor and the inverter’s output rating not to exceed the ampacity of the neutral conductor.
Note:
In AC electricity, there are two main configurations for the 3-phase systems "WYE," or "Star," and "Delta." Please look over this article regarding Three-phase electric power [115] for more information.
Unbalanced phases
Phase voltage imbalance can occur if a single-phase inverter is connected to a three-phase power system. NEC 690.63 (705.10) doesn’t allow this type of connection unless the voltage imbalance between phases is minimized, not to exceed 3 percent. Another solution is to use three similar single-phase inverters (one for each phase) that are equally loaded.
Interconnection Methods
The point of connection is the location at which the DG source including a PV system can be interconnected with the electric utility grid. Since adding power at that point is beyond the initial intended design of the existing electric system at the point of connection, all service equipment, such as main power distribution panel disconnects and conductors, must be sized and rated to allow this addition according to NEC 690.64.
NEC 690.64 [105] permits the output of the inverter to be connected to either load side (customer side) or supply side (utility side) service points, depending on the size of the PV system and marginal power available at that point. In large a PV system, the available service might not have enough capacity to handle the added power and, in this case, a separate service may need to be installed. A backfeed circuit breaker is a circuit breaker that allows current flow in either direction. The backfeed circuit breaker provides overcurrent protection of the branch circuits from the inverter, and the panel’s main service circuit breaker provides protection of the entire PV and load system from the utility. Regardless of the interconnection type, NEC 705 [105] requires that a permanent directory be placed at each service location showing all power sources for a building.
Load-side interconnection
Common in small PV systems, the main service disconnect at the customer facility has enough margin to handle the extra capacity added by the PV system, and that allowed an interconnection at the load side.
NEC permits that type of interconnection providing the following conditions (we will only mention the technical-related issues):
- In case multiple power sources are to be interconnected, each added power source (inverter in PV case) must have a dedicated circuit breaker or fused disconnect unless their outputs are first combined at a sub-panel.
-
In the 2011 National Electrical Code (NEC), the language in 705.12(D)(2) is straightforward. Fulfillment of the 120% rule that states that the sum of the rating of the OCPD in all circuits supplying power to a busbar or conductor must not exceed 120% of the rating of the busbar or conductor to prevent overloading conditions. This only applies to breakers that supply the load center with power, including the main utility fed circuit breakers and any back-fed circuit breakers from PV sources (load circuit breakers are not considered)
Here is what NEC 2014 - Article 705.12(D)(2) code states:
“Bus or Conductor Rating. The sum of the ampere ratings of overcurrent devices in circuits supplying power to a busbar or conductor shall not exceed 120% of the rating of the busbar or conductor.”
In the 2014 code, this straightforward sentence has been revised to include several paragraphs with different scenarios. The meaning might look the same, however, and once you understand the philosophy of the simpler 2011 version of 705.12(D)(2) you will be able to understand NEC 2014’s more sophisticated version. It really is the designer’s knowledge to correctly interpret the code, since NEC 2014 provides more flexibility to allow more PV capacity for the same circuit size.
Here is what NEC 2014 - Article 705.12(D)(2) states:
- The sum of 125 percent of the inverter(s) output circuit current and the rating of the overcurrent device protecting the busbar shall not exceed the ampacity of the busbar.
- Where two sources, one a utility and the other an inverter, are located at the opposite ends of a busbar that contains loads, the sun of 125 percent of the inverter(s) output circuit current and the rating of the overcurrent device protecting the busbar shall not exceed 120 percent of the ampacity of the busbar. The busbar shall be sized for the loads connected in accordance with Article 220.
- The sum of the ampere rating of all overcurrent devices on panelboards, both load and supply devices, excluding the rating of the overcurrent device protecting the busbar, shall not exceed the ampacity if the busbar. The rating of the overcurrent device protecting the busbar shall not exceed the rating of the busbar.
- Interconnection point to be on the supply side of all ground fault protection equipment.
- A back-fed circuit breakers in the panelboard shall be positioned at the opposite end from the main circuit breaker and marked with a warning label at the back-fed breaker from the PV system.
Note:
More requirements are listed on NEC 690 through the NFPA free access page [105], and designers are encouraged to read further.
Reflection
Assuming you have a service panel rated at 200A (maximum current) and the main circuit breaker is rated at 200A, what is the maximum allowable current that can be back-fed to this panel?
ANSWER: Applying the 120% rule, the 200A panel can only handle 240A current (1.2 x 200= 240A). Given the main circuit breaker is 200A and considering the rule that states that the sum of the current supplying power to the service panel cannot exceed 120% of the panel rating, or 240A. Then the allowable current from the additional current is the 40A (240 - 200= 40A). In other words: The maximum allowable back-fed current = 1.2 x 200A (panel rating) - 200A (main breaker rating) = 40A.
Note:
In some cases and based on load electrical study done by professional engineers, the main breaker can be taken down to a lower rating that will in return allow additional current to be back-fed to the panel.
Supply-Side Interconnection
For larger installation or in case the load-side strategy doesn’t provide the required capacity, a supply-side interconnection is the second resort for PV systems. NEC article 230 [105] requires any additional new service to have disconnect and OCPD. That said, the supply-side interconnection must include another service in parallel to the existing one with an additional OCPD and disconnect. The equipment and conductors must be rated to accommodate for that additional power coming from the PV system. The interconnection requires tapping the service entrance conductors, and that is done between the existing service panel and utility meter. A new meter might be needed when the service type cannot establish the tapping strategy. The added disconnect must meet local utility standards in terms of accessibility, interrupting rating, and visibility. The service conductor must be sized for at least 125% of the continuous load current, as stated in NEC article 230.
Metering and interconnection policies
Metering
Metering is required by the utility to measure how much electricity is used by the customers, and it is referred to as revenue meter. These meters are usually installed at service entrances of properties. Since the addition of DG sources will introduce another energy source, it is required to accommodate for that addition by measuring the added electricity based on the facility and DG system size and interconnection policies at the location of installation. This can be accomplished using one of the following methods:
Net metering
Using one meter that can operate in both directions (spins forwards and backwards) to measure the exported energy and subtract it from the imported energy. Some existing meters are capable of operating in both directions without any modifications, while other old meters need to be upgraded by the utility company. Designers and customers should consult with their state rules for the eligibility of the net metering.
Dual metering
In this case and as the name entails, two-meters (unidirectional meters) are required to be present at the facility. This is usually common for larger PV systems. In this case and due to what is referred to as “net purchase and sale” in most places, excess energy produced at the customer location from any DG source can be purchased by the utility at a different rate from the customer rate when the customer buys the electricity. The rate is agreed upon when signing the contract.
Utility interconnection policies
One of the main barriers to the expansion and adoption of PV systems is the utility interconnection policies that are established by federal, state, and local governments. Local utility companies may enforce interconnection policies where other governmental policies are absent.
Public Utilities Regulatory Policy Act (PURPA)
A number of policies have been developed over the past 30 years that impacted the interconnection of privately owned power generation systems at the state and federal levels. In general, PURPA specifies the qualifying facility and agreements to meet certain technical and procedural requirements to be interconnected to the utility grid. PURPA practices are overseen by the Federal Electric Regulatory Commission (FERC), which is responsible for overseeing the electric utility industry in the US.
Interconnection Agreements
Interconnection agreement is a contract between a distributed power producer and electric utility under specific interconnection terms and conditions. Interconnection of PV systems must be approved by the local utility with cooperation of the local AHJ.
The interconnection process begins after submitting an interconnection plan to the local utility along with the system design application for a permit with the local AHJ.
After the permit is granted, PV installation can be completed and then inspected by the AHJ, and utilities in some cases, to approve the interconnection based on national codes and standards. Interconnection documents must include a conceptual system design showing the location of main parts of the systems with distances and the electrical one-line diagrams that show the main electrical calculations for PV system components and interconnection methods, protection devices, and disconnects used. Finally, the system can be interconnected, commissioned, and operated.
Interconnection agreement by utility in most cases mandates that any interconnected DG source including a PV system have liability insurance, system inspection and monitoring, system maintenance, and disconnects on the outside of the facility, so the utility can have access to it at any time.
Lesson 9 Discussion
| Activity | Details |
|---|---|
| Assignment | Post original entry: We talked in class about applicable codes that govern the PV systems interconnection to the utility grid. Based on previous discussions, we learned that PV systems classification can include more specific market sector such as:
Discuss specific grid interconnection considerations for one of the options. Support your discussion with facts (you may research the same solar installation example you selected for previous discussions). Hint: the point of connection of the grid might have limitations. Post comments: Respond to two different opinions of others' posts. (For example, if you choose Option 1, you need to respond to one post for Option 2 and another post for Option 3 or 4.) |
| Requirements, Submission Instructions, and Grading | For more detailed instructions about the discussion component of this course, including how you will be graded, please visit the Discussion Activity [96] page. |
PV System Electricial Design Project
This week, you will finish up and submit your PV System Electrical Design Project.
| Activity | Details |
|---|---|
| Assignment | Visit the PV System Electricial Design Project [113] page for details on this overall assignment. You will be submitting your Project at the end of this lesson. |
Summary and Final Tasks
Going back to the scenario we started in this lesson, you are working on the electrical design for the same PV system as in Lesson 8. As you complete the NEC design for the PV array, you reach the point of interconnection with the utility grid at the meter side. By now, you know the requirements and methods to interconnecting the PV system to the utility grid. You can review the site evaluation documents provided by the sales team to decide it they are missing any information about the main service distribution panel in terms of location, type, and size (voltage and current ratings).
Upon the completion of this lesson, your next step is to decide on the interconnection strategy and recommend any service upgrade if needed. Furthermore, you may need to consult with the utility plan reviewers to check on any additional requirements they enforce in that location, such as additional metering or disconnects.
In the next lesson, we will combine all efforts to take it a step further to submit the permitting documents, and we will discuss project management strategies and safety issues associated with the interconnection process.
Reminder - Complete all of the Lesson Requirements!
You have reached the end of this lesson. Before you move to the next lesson, double-check the list on the first page of the lesson to make sure you have completed all of the requirements listed there.
Lesson 10: Construction Project Management and Safety
Overview
Lesson 10 Scenario
Imagine this scenario: you are assigned the role of project manager at the solar firm you work for, which designs PV systems for different market sectors. You have three new contracted PV projects that require planning for all logistics, the construction schedule, and the installation process. Your role is to get all of the systems installed in time by coordinating with different parties.
Assuming the first project is a small residential rooftop PV system, what are the considerations and planning process you should propose? In addition, you have another commercial pole mount PV system. Are the construction requirements any different from the rooftop system? Finally, you have a ground mount large scale PV system. Does the size affect the construction and logistics strategies?
In this lesson, we will disclose some construction considerations for these different systems and, in addition, we will discuss with our solar professionals the OSHA safety issues related to PV systems. This lesson helps our solar professionals, employees, and business owners get prepared to manage any solar project and understand the bigger picture of the design and installation process.
Learning Outcomes
At the successful completion of this lesson, students should be able to:
- Identify procurement and contracting strategies for project teams
- Identify electrical safety hazards associated with operating and non-operating to PV systems and components.
- List types of Personal Protection Equipment (PPE) and how they relate to PV installations and maintenance.
- Demonstrate how to apply OSHA regulations as they relate to specific safety hazards.
What is due for Lesson 10?
Lesson 10 will take us one week to complete. Please refer to the Calendar in Canvas for specific time frames and due dates. Specific directions for the assignments below can be found within this lesson and/or in Canvas.
Complete the following Lesson Assignments:
- Read through the Lesson Content
- Complete the Required Reading Assignments:
- Chapter 9 in Large‑Scale Solar Power System Design (GreenSource Books): An Engineering Guide for Grid-Connected Solar Power Generation. [116] Author Peter Gevorkian, Publisher McGraw Hill Professional, 2011ISBN 0071763287, 9780071763288 (*Penn State Login Required)
- United States Department of Labor - Green Job Hazards: Solar Energy [117]
- Look over the Recommended Reading Assignments:
- Submit the Lesson 10 Activity
- Take the Lesson 10 Quiz in Canvas
*Students who register for this Penn State course gain access to assignments, all readings, and instructor feedback, and earn academic credit. Information about registering for this Penn State course is available through the Renewable Energy and Sustainability Systems Online Masters and Graduate Certificate Programs Office. [38]
Questions?
If you have lesson specific questions, please feel free to post to the Lesson 10 Questions discussion forum in Canvas. While you are there, feel free to post your own responses if you, too, are able to help a classmate with a question. If you have questions about the overall course or wish to share and discuss any "extra" course related commentary (interesting articles, etc.), please feel free to post to the General Questions and Discussion forum.
Project Management
Considered one of the most critical roles in the PV system design and installation process, project management ensures the system delivery in the best desired timeline, quality, and budget. This role involves attention to details and coordination between different teams in terms of what steps to take next in the process. Project management tackles the methodology required for planning, scheduling, and managing resources including manpower and materials. In order for a project manager (PM) to be able to achieve that task, he/she should be qualified to prepare a plan that meets the requirements as specified in the contract with the PV system owners. The PM is usually a person who fully understand the technical aspects of PV projects, which include procurement, planning, scheduling, engineering, integration, and commissioning.
Project Development Phases
Electric solar projects go through certain stages to be fully completed. This includes the following phases:
- Project initiation
- Project planning and design
- Project installation
- Project monitoring
- Project completion
These stages can vary according to the system, type, and size. That will be discussed in the considerations later on this page.
Figure 10.1 illustrates an example of the workflow for a small residential/commercial PV system. The complete PV system process usually follows this order: prospective customer, site evaluation, proposal preparation, contract signed, design and engineering, permitting and plan review (utility and AHJ), installation, inspection, monitoring and commissioning, owner's manual.
The work starts once a new customer shows interest in installing a PV system. A team of analysts begins preparing a simple drawing and some calculations to estimate the size of the solar system and to prepare a proposal. Most utilities rely on “PVWatt,” the free online solar database and simulation tool published by The National Renewable Energy Laboratory (NREL), to predict the annual solar energy production for the site (as we learned in previous lessons). As can be seen, NREL tools give the user options to find potential locations for the solar systems and to estimate the size of the system without going to the actual site.
Once the proposal is generated and discussed with the customer, the company representative will conduct a brief survey to gather more information about the site, which is required in order to start the preliminary engineering design. Then, the project will be entered into the pipeline of projects, and it will be directed to the engineering department for a preliminary design. The role of project management is to oversee all the design and engineering progress on each potential PV system and then ensure the right coordination between the internal departments.
The first step in the design is to generate the three-dimensional model that matches the actual site dimensions. This preliminary design will then be sent back to the customer for any feedback or changes that he/she sees are essential for the PV system in terms of location selection, aesthetics, and finances. Once the customer approves the preliminary design and he/she signs the contract, the engineering team will finalize the structural and electrical diagrams and required calculations after a followup visit for final site evaluation, where more detailed information is gathered. These designs will be reviewed by other engineers to ensure design adherence to local and national engineering codes (NEC article 690 and any other local AHJ), as we discussed earlier. In some cases, the designs need to be reviewed by a third party, such as an independent engineering firm, and then sent to the utility and AHJ for permitting and interconnection. Upon acceptance of the design by the utility engineering department, the project will enter the last stage in the engineering department, which is construction documents preparation and installation.
The project manager should also pay attention to the review timeline for the permit to be issued. In some places, the utility review process may require a couple of months, depending on the workload and number of PV projects submitted.
Simultaneously, the project manager should coordinate with the procurement team to ensure system component availability and when these materials should be delivered to the site to be installed by the PV installers at a prescheduled time agreed upon by the customer. As can be seen, logistics coordination is essential for optimal performance of the teams and to guarantee timely delivery of the system.
The system can also be monitored remotely to ensure the real system meets production expectations through the Internet profile of this particular system, as illustrated in Figure 10.1. The system can also be monitored for any technical problems within the operation that may appear during the entire lifespan of the system.
Once the system is up and running, the solar firm usually provides the customer with an owner’s manual to ensure that the customer has enough basic information about the system (for small systems such as rooftop PV, the installer can prepare the manual).
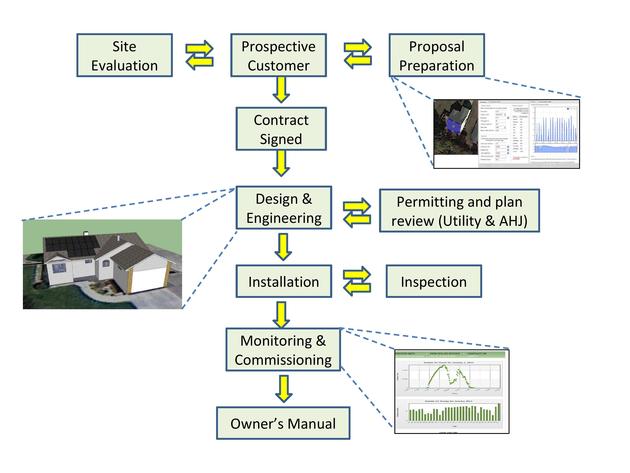
Considerations
Construction strategy depends highly on system type, size, and mounting structure used. When the project manager is preparing for different system requirements, he/she should consider various strategies to accomplish the design goal while meeting the construction timeline.
Ground mount systems:
As we discussed previously, this system mounting structure requires land space, and depending on the system size, land preparation, such as leveling and base preparation, which could raise a challenge to the PV system. In this case, the project manager should consider a thorough site evaluation of the land requirements before going forward with the scheduling of the delivery time of components and installation dates.
Pole mount system:
We remember from previous lessons that this mounting type requires less land space. However, in some cases, digging a hole in the ground may require detailed information about the type of sand and rocks in that area to prepare installers for the size of work needed and also to ensure delivery of the correct excavation equipment for earthwork.
Roof mount system:
Whether it is a simple residential or complex commercial roof mount system, any installation on the roof requires special attention to the roof age, allowable structure load, and installers' skills. The main concern for roof mount systems is leakage and liability.
PV System Safety
As we discussed earlier, PV systems consist of multiple mechanical and electrical components, and so safety practices and procedures are critical to reducing or eliminating installation errors, electrical hazards, or injury (or death) on job sites. We saw that NEC has guides for safety requirements for designing and installing PV systems such as voltage and current limits, OCPD and ground-fault devices, and disconnects.
Aside from the aforementioned regulations, this section describes safety practices and procedures that must be used to install PV systems. PV is an electrical system, and workers can get injured. Non-electrical hazards are usually caused by human error, due to carelessness or failure to adhere to safety requirements. Installers should be alerted to different non-electric hazards they may encounter on the installation site. Cuts, bumps, falls, and sprains can cause as much hazard and lost time as electrical shock and burn hazards.
Occupancy Safety and Health Administration (OSHA)
The Occupancy Safety and Health Administration (OSHA) creates a set of regulations that requires employers to provide a safe place for employees while reducing hazards. OSHA 29 CFR part 1926 applied to general construction practices includes several practices applicable to PV systems. OSHA 10 [120] is a recommended basic training for all workers.
In order for PV installers to reduce/eliminate their number of injuries, an awareness of potential hazards and a program where safety rules are frequently reviewed are required. This can be accomplished based on safety training series' offered to workers. Construction sites contain a number of risks that we will discuss in this section. Installers should know that these risks are continuously changing based on new materials and technologies, so regular updates on these topics are recommended.
Note:
There was a time when training was not available for workers to comply with safety regulations. One of the best, effective ways to convey the importance of complying with regulations is by illustrating real examples of incidents. For that reason, OSHA has put together a series of training videos to make training appealing to workers. Some of these videos on the following pages are directly related to PV installations, and some are general examples of construction work related hazards. We encourage our solar professionals to watch all videos to get an idea about the importance of OSHA training and safety regulations in general.
Electrical Hazards
Common electrical accidents are classified as:
- Direct injuries such as electric shocks, burns, or electrocution
- Indirect injuries, such as traumatic injuries associated with falls after an electrical shock
- Concussions
- Eye damage
These injuries can occur when electric current flows through the human body. The injury can become critical depending on the amount of current, the path through the body, and the duration. It is difficult to estimate when current will flow or the severity of the injury that might occur because the resistivity of human skin varies from just under a few ohms to several hundred thousand ohms depending primarily on skin condition and moisture. DC current generated by PV systems can cause continuous arc, and if it travels through a part of the body, it may cause serious burns. Power conditioning units are hazards, as they generate high AC voltage that can cause injuries as well.
This OSHA prevention video describes how to prevent deaths and injuries from employees' contact with overhead power lines while using ladders. Find more information on this topic on the OSHA website [121].
Video: Electrocution/Work Safely with Ladders Near Power Lines (5:41)
In the U.S., hundreds of construction workers die every year while on the job, with over 700 fatalities just in the year 2011. The third leading cause of these deaths is electrocution. Electrocutions cause one of every ten construction worker deaths, with nearly 70 deaths in 2011. But these deaths can be prevented. The video you are about to see shows how quickly contact with overhead power lines can result in the electrocution of a worker. The video will also show what employers must do so that the work can be done more safely. Employers have a responsibility to provide a safe workplace and protect workers against possible hazards. You’ll see that training workers, pre-job planning and taking the right precautions save lives. Please be advised. The scenes you are about to see deal with deaths at construction sites and might be disturbing for some people. All scenes are based on true stories.
Two workers were hired to caulk windows on a new three-story townhouse. There were overhead power lines located 20 feet from the house and about 25 feet above ground level. One worker was using a 40-foot metal extension ladder to reach and caulk the third story windows, while another worker was on the ground caulking windows. The ladder was extended to reach a vertical height of 31 feet above ground. The ladder’s base was set 8 feet from the side of the townhouse.
After the worker finished one window, he came down from the ladder. He tried to move by the ladder by himself, with the ladder still extended in the upright position. But the ladder was top heavy and too unstable and it fell backwards while the worker was still holding it. As it fell, the aluminum ladder contacted the overhead power line near the townhome. Because the worker was using a highly conductive metal ladder, it allowed the electrical current in the power lines to reach the worker. He died instantly.
Let’s look at the events leading up to this tragic incident, and see how it could have been prevented. Originally the worker climbed down the ladder and tried to move it by himself. Because the ladder was still in the upright position and extended, it was too hard to handle even though the worker was himself a safe distance from the power line. As a result, it fell over and hit the power line. Because the worker was holding the metal ladder when it hit the power line, it allowed current to pass through the worker’s body to the ground.
Now let’s take a look at the worker doing the same task safely: This time, before starting to work, the worker and his foreman inspect the area including checking for overhead power lines. After checking on the voltages with the utility company, the foreman and the worker discuss safe working distances from the power lines. The foreman reminds the worker of the need to keep himself and the ladder clear of the power lines at all times. As an added safety precaution a fiberglass ladder is selected for use in this area. While the fiberglass ladder is heavier, it has non-conductive side rails and two workers can safely handle it. As before, the worker climbs down the ladder to move to the second window, but this time he calls over to his co-worker to help move the ladder. The two workers first bring the extended section down, and then carry the ladder horizontally toward the second window to prevent the ladder from hitting the overhead power lines.
Now that you have seen how to perform this work safely, let’s go over some important points to prevent these types of electrocutions at work sites: All workers need to be trained about the hazards. Maintain clearance from overhead power lines. Working too close can expose the worker to an electric arc that could result in burns, a shock, or electrocution even if the worker does not contact the power line. In addition to maintaining clearance from overhead lines, use ladders with non-conductive side rails as an added safety precaution. Using ladders with non-conductive side rails is safer but not a guarantee of protection from an energized power line. In addition, ladders are not rated for electrical safety, so, it is important to always use safety precautions that maintain safe distances from overhead power lines.
Inspect ladders before and after each use. Only use ladders that are clean, dry and undamaged. For example, if a fiberglass ladder is not kept clean, dry, and in undamaged condition it can conduct electricity. Don’t carry or move extension ladders in the upright position. Get help moving ladders to keep control and prevent accidental contact with energized overhead power lines. If a ladder should accidentally hit an overhead power line do not touch it, quickly move away and call the electric utility company immediately. If appropriate clearance from an overhead power line cannot be met, contact the utility company to de-energize and ground the line or request the utility company install insulation over the lines to protect workers.
This example shows the importance of employers following OSHA standards to ensure that workers are provided with a safe workplace. These types of construction deaths are preventable. The protection measures shown here save workers’ lives. Use these protections on the job: it could be the difference between life and death. If you would like more information, contact OSHA at www.osha.gov or [122] 1-800-321-OSHA. That’s 1-800-321-6742.
This OSHA prevention video describes how to prevent deaths and injuries from contact with overhead power lines while using cranes. Find more information on this topic on the OSHA website [121].
Video: Prevent Electrocutions: Work Safely with Cranes near Power Lines (3:53)
In the U.S., hundreds of construction workers die every year while on the job, with over 700 fatalities just in the year 2011. The third leading cause of these deaths is electrocution. Electrocutions cause one of every ten construction worker deaths, with nearly 70 deaths in 2011. But these deaths can be prevented. The video you are about to see shows how quickly contact with overhead power lines can result in the electrocution of a worker. The video will also show what employers must do to ensure that the work can be done more safely. Employers have a responsibility to provide a safe workplace and protect workers against possible hazards. You'll see that training workers, pre-job planning and taking the right precautions save lives. Please be advised. The scenes you are about to see deal with deaths at construction sites and may be disturbing to some people. All scenes are based on actual events.
Two construction workers were replacing a section of pipe in a trench next to a road. They were using a crane to unload the pipe from a truck and place it on the ground close to the trench. While one worker operated the crane, another worker was on the ground to help direct the pipe toward the ground near the trench. The worker directing the pipe had one hand on the tagline, which was attached to the rigging used to lift the load. As the crane operator began to move the pipe, the crane's boom contacted an overhead power line. The electrical current traveled through the boom, down the load line, along the tagline, and reached the worker. He died instantly.
Let's look at the events leading up to this tragic incident, and see how it could have been prevented. The worksite did not have many of the required controls in place to protect workers from overhead power line hazards. For instance, before the work started, the employer had not set up the required clearance distance to keep the crane a safe distance from the overhead power line.
Let's take a look at the same work area, this time with proper precautions in place. All workers are trained, this includes the crane operator being certified and the rigger and spotter fully qualified. Because the line is "live" (or energized), the employer has taken steps to keep a safe distance from the power line: The foreman obtained the voltage of the overhead power line from the utility company. Based on the voltage, he determined the minimum required distance of the crane from the power line. A pre-job safety planning meeting was held. Flags are set up to show the boundary that must not be crossed. A non-conductive tag line is used to control the movement of the pipes. The truck is no longer directly below the power line. And a spotter is on site with a two-way radio to communicate with the operator.Higher voltage lines will require greater minimum safe distances and additional precautions than those shown here. Now, as the pipe is moved, the boom remains a safe distance from the power lines and the worker safely guides the pipe towards the ground near the trench.
This video shows one of several options employers can use to keep workers safe when operating cranes near power lines. Not all worksites are the same, and the precautions could be different than those shown here. Construction deaths from electrocutions are preventable. The precautions shown here save workers' lives. Follow safe crane operation requirements on the job: it could be the difference between life and death.
If you would like more information, contact OSHA at www.osha.gov or [122] 1-800-321-OSHA that's 1-800-321-6742.
Recommendations:
According to the OSHA website [124], Lockout/Tagout (LOTO) refers to "specific practices and procedures to safeguard employees from the unexpected energization or startup of machinery and equipment, or the release of hazardous energy during service or maintenance activities." This can be done by:
- Lockout AC or DC power source disconnects using appropriate locks.
- Labeling all deactivated circuits and equipment when they can be energized.
The following video (1:57) offers more information on this subject.
Video: Electrical Panel Repair Results in Electrocution (1:57)
An electrician was working on an open electrical panel on a ship. He needed to add a new cable and attach it to a breaker within the panel. The electrician identified the isolation breaker that fed the entire panel on the schematic drawing. The electrician de-energized the breaker and properly tagged out. As the electrician was fitting the new cable into the panel his left hand came into contact with the panel's main bust bars. Four hundred forty volts of current passed from the bus bars through his left hand, across his chest, and out his right hand that braced him against the panel electrocuting him. At some point the tagged out isolation breaker had been crossed wired with another breaker. The electrician did not know that the panel he was working on was never de-energized. (MUSIC)
Let's look at some of the contributing factors that led to this fatality.
Employees should verify the location of all energy isolation points. Employees must check or test electrical panels or electrically powered equipment to ensure they are in fact de-energized before working inside them or within the vicinity of exposed electrical circuits. Inform all contractors and subcontractors of the ship's systems and/or modifications to the systems prior to beginning work. (MUSIC)
Battery Hazards
Any system with batteries forms a potential hazard. Some areas of concern include:
- Electrical Burns: Shorting the terminals of a typical battery that might be found in a PV system can cause high currents to flow for a few seconds. Severe burns and death can occur even though the voltage is low.
- Acid Burns: Any battery acid can cause burns if it comes in contact with exposed skin or eyes.
- Gas Explosion or Fire: Most batteries used in PV systems release gas as a result of the charging process. This gas may be flammable gas and can create a hazard.
Recommendations:
- Safety gloves and goggles should be worn when dealing with such hazards.
- Keep all flames and equipment that could create a spark, such as a controller with relays, away from batteries.
- The battery should be located in a well-ventilated area.
Falling Hazards
A fall is considered the primary cause of death in the construction industry. OSHA fall protection regulations apply to PV systems since PV systems can be installed in locations where climbing a ladder, working on roof, or use scaffolds is required.
A training on fall protection should be offered to workers on how to use fall protection systems and devices to avoid injuries that include:
- Personal fall arrest systems (PFAS): Such as anchorages, lifelines, and body harnesses
- Guardrails: For open-sided floors with top rail 39”-45” tall, mid rails, and lower rail at least 3 ½” high.
- Safety nets : Required for work sites 25’ and more above ground to catch falling workers and reduce fall-related injuries.
- Stairways and ladders
: OSHA requires all elevations 19” and more to have stairways or ladders with certain regulations to meet safety requirements.
- Ladder
- Position ladder at an angle such that the horizontal distance from the top support to the foot of the ladder is 1/4 the working length of the ladder
- Ladder rail extension: When using a portable ladder for access to an upper landing surface, the side rails must extend at least 3 feet above the upper landing surface—the ladder must be tied-off and a grab rail provided if the 3-foot extension cannot be achieved. 29CFR1926.1053(b)(1)
- Face the ladder when going up or down when climbing a Ladder
- Use at least one hand to grab the ladder when going up or down
- Do not carry any object or load that could cause you to lose balance
- 29 CFR 1926 1053(b) (20), (21) and (22) [125]
- Ladder
- Warning line systems: A barrier erected on a roof to warn employees that they are approaching an unprotected roof side or edge. They contain an area where roofing work may take place without fall protection systems 1926.500 (b)
- Safety monitors: to warn workers when it appears they are unaware of a fall hazard or are acting in an unsafe manner. A safety monitor must be:
- A competent person
- At same level
- Within sight
- Able to communicate
- Free from other responsibilities that could distract the monitoring
The following video discusses OSHA's fall protection policies for residential construction.
Video: OSHA's Fall Protection Policies for Residential Construction (26:25)
Insert transcript here
The following videos cover various falls in construction.
Video: Falls in Construction/Bridge Decking (3:21)
More than 800 construction workers die every year while on the job. Falls are the number one cause of fatalities in construction. Falls cause one of every three construction worker deaths. These falls happen in a split second while workers are on roofs, scaffolds, ladders, bridges, and other work surfaces. But these deaths can be prevented.
The video you are about to see shows how quickly falls at construction sites can lead to workers'deaths. The video will also show what employers must do so that the work can be done more safely. Employers have a responsibility to provide a safe workplace and required protective equipment. You'll see that using the right type of fall protection saves lives.
Please be advised. The scenes you are about to see deal with deaths at construction sites and might be disturbing for some people. All scenes are based on true stories.
Two workers were installing deck pans onto a bridge. They were not wearing any personal fall protection and there was no safety net below the bridge. One of the workers was preparing to weld the next deck pan into place.
While walking toward a deck pan that needed to be secured, the worker tripped and fell onto an unsecured deck pan. The deck pan slid away from her, creating an opening. She fell for 75 feet, landing on the ground below. She died instantly from her injuries.
Let's look at the events leading up to this tragic incident, and see how it could have been prevented. The workers had no fall protection, which OSHA requires the employer provide when working at heights of 15 feet and above.
Let's see what happens when these workers use fall protection. Now there is a temporary horizontal lifeline attached along the beams. Each worker wears a full-body harness and connects to the lifeline using a self-retractable lanyard with self rescue capabilities The horizontal lifeline system can use two or more anchors connected to one of the concrete beams. Once attached to the beam, a cable is run between the anchors, and the lanyard is connected to the cable.
As before, while walking toward a deck pan that needed to be secured, the worker tripped and fell onto an unsecured deck pan. The horizontal lifeline stops her from falling to the ground. The worker is lowered slowly to the ground.
Another way to protect these workers is to use a safety net. So now, when the worker trips and falls onto the unsecured deck pan, the net stops her from falling to the ground.
This example shows the importance of employers following OSHA's fall protection standards to ensure that workers are provided with a safe workplace. These types of construction deaths are preventable. The fall protection measures shown here save workers' lives.
Use fall protection on the job: it could be the difference between life and death.
If you would like more information, contact OSHA at www.osha.gov or [122] 1-800-321-OSHA that's 1-800-321-6742.
Video: Falls in Construction/Fixed Scaffolds (2:58)
In the U.S., more than 800 construction workers die every year while on the job. Falls are the number one cause of fatalities in construction. Falls cause one of every three construction worker deaths. These falls happen in a split second while workers are on roofs, scaffolds, ladders, bridges, and other work surfaces. But these deaths can be prevented.
The video you are about to see shows how quickly falls at construction sites can lead to workers' deaths. The video will also show what employers must do so that the work can be done more safely. Employers have a responsibility to provide a safe workplace and required protective equipment. You'll see that using the right type of fall protection saves lives.
Please be advised. The scenes you are about to see deal with deaths at construction sites and might be disturbing for some people. All scenes are based on true stories.
A worker was installing vinyl siding on a two-story townhome. He was standing on a ladder that was placed on top of a scaffold. A co-worker was on the scaffold cutting pieces of siding. The scaffold had no guardrails. The workers were not wearing any fall protection.
While standing on the top step of the ladder, the worker putting up siding overreached to one side and the ladder overturned. He fell nearly 20 feet and landed on the driveway below. He died later that day from injuries caused by the fall.
Let's look at the events leading up to this tragic incident, and see how it could have been prevented. Originally, the worker installing siding was standing on a ladder that was placed on top of a scaffold. This is a very serious and dangerous OSHA violation.
Also, there was no fall protection for these workers. OSHA requires employers to provide workers with fall protection when they are working on scaffolds more than 10 feet above a lower level.
Let's look again at the worker installing siding. But now, the worker is standing on a fully-decked pump-jack scaffold. It has guardrails at the top, middle, and ends. So, instead of being at risk from falling while installing siding, this worker is now protected from fall hazards.
This example shows the importance of following OSHA's fall protection standards. These types of construction deaths are preventable. The fall protection measures shown here save workers' lives.
Use fall protection on the job: it could be the difference between life and death.
If you would like more information, contact OSHA at www.osha.gov or [122] 1-800-321-OSHA that's 1-800-321-6742
Video: Falls in Construction/Floor Openings (3:05)
More than 800 construction workers die every year while on the job. Falls are the number one cause of fatalities in construction. Falls cause one of every three construction worker deaths. These falls happen in a split second while workers are on roofs, scaffolds, ladders, bridges, and other work surfaces. But these deaths can be prevented. The video you are about to see shows how quickly falls at construction sites can lead to workers'deaths. The video will also show what employers must do so that the work can be done more safely. Employers have a responsibility to provide a safe workplace and required protective equipment. You'll see that using the right type of fall protection saves lives.
Please be advised. The scenes you are about to see deal with deaths at construction sites and might be disturbing for some people. All scenes are based on true stories. Two workers were framing the walls of a new two-story house with a basement.
They were working on the second floor near an open stairwell. There was no guardrail or floor cover, and the workers were not wearing personal fall protection. After framing one section of a wall, the workers raised it and moved forward to put it into place. While moving forward, one of the workers stepped towards the unguarded stairwell to hold the side of the wall section.
He fell down the unguarded stairwell opening. He fell 20 feet and landed on the concrete basement floor. He died from fatal head and internal injuries. Let's look at the events leading up to this tragic incident, and see how it could have been prevented. Originally, the workers were nailing in the boards to frame a section of the new wall, and the stairwell was not protected by a guardrail. Now, the stairwell is protected by a guardrail as required by OSHA.
As before, the workers are moving forward to install the completed wall section. This time, as the worker steps toward the stairwell, the guardrail stops him; he continues forward to place the framed section in place. Another way to protect workers is by putting a proper cover over the stairwell opening.
The cover must be secure. As shown here, the worker steps onto the cover and continues to put the section in place.
This example shows the importance of following OSHA's fall protection standards. These types of construction deaths are preventable. The fall protection measures shown here save workers' lives.
Use fall protection on the job: it could be the difference between life and death.
If you would like more information, contact OSHA at www.osha.gov or [122] 1-800-321-OSHA that's 1-800-321-6742.
Video: Falls in Construction/Leading Edge Work (3:01)
More than 800 construction workers die every year while on the job. Falls are the number one cause of fatalities in construction. Falls cause one of every three construction worker deaths. These falls happen in a split second while workers are on roofs, scaffolds, ladders, bridges, and other work surfaces. But these deaths can be prevented.
The video you are about to see shows how quickly falls at construction sites can lead to workers'deaths. The video will also show what employers must do so that the work can be done more safely. Employers have a responsibility to provide a safe workplace and required protective equipment. You'll see that using the right type of fall protection saves lives.
Please be advised. The scenes you are about to see deal with deaths at construction sites and might be disturbing for some people. All scenes are based on true stories.
Four workers were insulating the roof and applying the top layer of sheet metal roof decking on a tall, pre-engineered building. The roof was fairly flat, there was no controlled decking zone, and the workers were not wearing any personal fall protection. The workers were using drills to screw the metal sheets into the purlins.
As one of the workers walked down the roof, he lost his footing. He fell through the space between the purlins, and landed on the floor below. He died the next day from his injuries.
Let's look at the events that led up to this tragic incident, and see how it could have been prevented. Originally, the workers had no fall protection, which OSHA requires the employer to provide when working at heights of 15 feet and above.
Let's look again at the workers installing the metal roofing sheets and see what happens when these workers use fall protection. They are now using a temporary horizontal lifeline. This involves a horizontal cable attached to two or more anchor points on the roof. In this system, the workers connect their harnesses to a horizontal lifeline that is secured to the roof structure instead of individual anchor points.
Again, as the worker loses his footing and falls between the purlins, his lifeline stops him from falling to the floor below. While he is hanging from his fall arrest system, a co-worker brings over a lift and rescues the worker.
This example shows the importance of employers following OSHA's fall protection standards to ensure that workers are provided with a safe workplace. These types of construction deaths are preventable. The fall protection measures shown here save workers' lives.
Use fall protection on the job: it could be the difference between life and death.
If you would like more information, contact OSHA at www.osha.gov or [122] 1-800-321-OSHA that's 1-800-321-6742.
Video: Falls in Construction/Reroofing (3:02)
More than 800 construction workers die every year while on the job. Falls are the number one cause of fatalities in construction. Falls cause one of every three construction worker deaths. These falls happen in a split second while workers are on roofs, scaffolds, ladders, bridges, and other work surfaces. But these deaths can be prevented.
The video you are about to see shows how quickly falls at construction sites can lead to workers'deaths. The video will also show what employers must do so that the work can be done more safely. Employers have a responsibility to provide a safe workplace and required protective equipment. You'll see that using the right type of fall protection saves lives.
Please be advised. The scenes you are about to see deal with deaths at construction sites and might be disturbing for some people. All scenes are based on true stories.
Two workers were reroofing a two-story home with a pitched roof. They were not wearing any personal fall protection. The workers used nail guns to install shingles over an old layer of shingles.
One of the workers was close to the edge of the roof. As she reached to pick up another shingle, she lost her balance. She slipped off the edge of the roof. She fell more than 20 feet and landed on the driveway below. She died instantly from her injuries.
Let's look at the events leading up to this tragic incident, and see how it could have been prevented. Originally, the workers had no fall protection, which OSHA requires when working in residential construction at heights of 6 feet and above.
Let's look again at the workers installing shingles. Now, they are both wearing personal fall arrest systems. Each system has a full-body harness, a rope-grab lifeline, and connectors. Snaphooks connect each worker's rope-grab lifeline to secure roof anchors, which are located higher up on the roof. D-rings connect the workers' safety harnesses to their rope-grab lifelines.
As before, the worker reaches over to pick up a shingle, loses her balance, slips, and falls. But now, because she is wearing a fall arrest system, she only slips 2 feet and doesn't fall off the roof.
This example shows the importance of following OSHA's fall protection standards. These types of construction deaths are preventable. The fall protection measures shown here save workers' lives.
Use fall protection on the job: it could be the difference between life and death.
If you would like more information, contact OSHA at www.osha.gov or [122] 1-800-321-OSHA that's 1-800-321-6742.
Video: Falls in Construction/Skylights (3:08)
More than 800 construction workers die every year while on the job. Falls are the number one cause of fatalities in construction. Falls cause one of every three construction worker deaths. These falls happen in a split second while workers are on roofs, scaffolds, ladders, bridges, and other work surfaces. But these deaths can be prevented.
The video you are about to see shows how quickly falls at construction sites can lead to workers' deaths. The video will also show what employers must do so that the work can be done more safely. Employers have a responsibility to provide a safe workplace and required protective equipment. You'll see that using the right type of fall protection saves lives.
Please be advised. The scenes you are about to see deal with deaths at construction sites and might be disturbing for some people. All scenes are based on true stories.
Two workers were reroofing a two-story townhome. They were not wearing any personal fall protection, but guardrails were installed on the roof. The roof of the building was pitched and there was one skylight in the area that the workers were reroofing. One worker was using a nail gun to install new shingles over the single layer of old shingles. He was installing shingles in the center of the roof near an unguarded skylight. A co-worker was setting shingles.
As the worker nailed shingles near the unguarded skylight, he stepped backwards onto it. The skylight was not strong enough to hold his weight, and it broke. He fell through the skylight. He fell 15 feet, and landed on the floor below. He was badly injured and died two days later at the hospital.
Let's look at the events leading up to this tragic incident, and see how it could have been prevented. The roof already had guardrails, so the employer thought his workers were protected from fall hazards. But, he was wrong. Originally, when the worker was installing shingles near the skylight, the skylight was only covered by a translucent plastic dome. Now, the skylight is guarded by a cover that meets OSHA requirements. As before, the worker is nailing in shingles. Now, as he steps backwards, instead of stepping onto the skylight, he bumps into the cover, regains his footing, and continues installing shingles.
This example shows the importance of following OSHA's fall protection standards. These types of construction deaths are preventable. The fall protection measures shown here save workers' lives.
Use fall protection on the job: it could be the difference between life and death.
If you would like more information, contact OSHA at www.osha.gov or [122] 1-800-321-OSHA that's 1-800-321-6742.
Special Consideration
Different slopes for rooftop PV and fall protection
There are two types of slopes that exist on roofs, and special attention should be taken:
- Steep-slope roof = a roof having a slope greater than 4’ in 12’ (vertical to horizontal)
- Low-slope roof = a roof having a slope less than or equal to 4’ in 12’ (vertical to horizontal)
Conveyors and hoists
Require emergency stop switches at the operator station or the motor
Scaffolding
At heights greater than 10 feet, the fall protection requirement for workers on scaffolds is different from the general construction requirement at 6 feet or greater, as mentioned in section 29CFR1926.451(g)(1). See the following video for more.
Video: Scaffolding Collapse, Welder Falls (1:27)
A welder was erecting scaffolding inside a vessel that was under construction. The welder attached the scaffolding to the bulkhead using brackets clips that are temporarily tack welded in place. The welder was trained and certified to install and weld these type of clips. After he finished assembling the scaffold structure with temporary welds, the welder walked out onto the scaffold boards. One of the bracket clips failed, causing him to fall 18 feet to the deck below. He died from massive injuries. (MUSIC)
What went wrong?
The bracket clips which require full welds were only tack welded. The welder should not have climbed onto the scaffolding with tack welded clips. Welds must be inspected before a scaffolding structure is placed into use. The welder was wearing a body harness, but did not tie off. Always wear a full body harness and tie off at heights of five feet or more. When accessing scaffolds, ladders should extend three feet above scaffold boards. (MUSIC)
Signal Persons
OSHA requires a signal person when:
- Point of operation (load travel or load placement) is not in full view of operator
- During crane travel, the direction of travel is obstructed
- The operator or person handling the load determines that it is needed because of site specific safety concern s
Hand and power tools
Each power tool has its own set of requirements for use, and some come with safeguards. For most PV systems, workers will use electric power tools, air-filled tools, hydraulic tools, and tools that require liquids such as gasoline. Good understanding of the hazards associated with the power source will reduce the number of potential incidents and injuries.
Personal Protective Equipment (PPE)
Personal protective equipment (PPE) protects worker dangers, such as falling items, unsecured materials, and loud noises, that can cause injury. Examples of PPE include:
- Safety glasses
- Face shields for eye and face safety
- Hard hats for head protection
- Steel-toed safety shoes for foot protection
- Armor for hands and arms, such as gloves
- Hearing protection devices, such as earplugs or earmuffs
Other Hazards
Exposure to sun
PV systems are installed where the sun is brightest and no shade exists. Sunburn and dehydration due to extreme temperature may occur.
Insects, Snakes, and Other Vermin
Installers should pay attention to any of inhabitant in the site where the PV system will be installed. Serious injuries may occur due to neglect. The site may be treated against these hazards before the installation starts.
Cuts and Bumps
Most PV systems contain metal items with sharp edges and can cause injury if you are not careful. Installers should wear gloves when handling metal, particularly if you are drilling or sawing.
Falls, Sprains, and Strains
Many PV systems are installed in remote areas in rough terrain with different altitudes. Walking to and around the site, particularly carrying materials or test equipment, can result in falls and/or sprains. Installers should follow correct dress codes from head to toe.
The following videos offer more on sprains and strains.
Video: Sprains and Strains in Construction/Pulling Cables (2:47)
Each year in the U.S., 31,000 construction workers seek medical attention due to sprains and strains suffered on the job. These injuries happen when the human body is forced to work beyond its limits. Lifting, pulling, pushing, reaching, bending, and other common construction activities can cause these injuries. The pain resulting from these injuries can last a lifetime and affect construction workers' lives at work and at home. But these injuries can be prevented.
This video shows how overexertion at construction sites can lead to worker injuries. The video will also show what employers must do so that the work can be done more safely. Employers have a responsibility to provide a safe workplace and required protective equipment. You'll see that taking the right protective steps can help prevent these injuries.
An experienced commercial electrician was wiring a newly built commercial building. He had been doing this kind of work for several years. While standing on a ladder that was too short for the job, he pulled long runs of a heavy gauge wire. He then attached the wiring above his head to the ceiling. The job involves awkward pulling movements while reaching overhead.
After several days on the job, the stress on the electrician's arms, neck, back, and shoulders has become too much. As a result, the pain the electrician feels has affected his ability to do the work.
Let's look at the events leading up to these injuries, and see how they could have been prevented. As before, the electrician is attaching wiring to the ceiling.
But this time, he is standing on an elevated platform that is the right height for the job. This reduces his overhead movements, and prevents stress to his body. Also, as he attaches the wiring, he is now using a mechanical wire puller to get the wire he needs. This way, he doesn't hurt himself by pulling the wire by hand and straining his body as he did before. Making these types of small changes in work activities can prevent painful injuries.
This example shows the importance of employers using OSHA's ergonomics guidelines. These are guidelines designed, so workers can avoid stress and injury to their bodies. These types of injuries are preventable.
Follow OSHA's guidelines at work sites. By following the guidelines, workers can avoid suffering a lifetime of pain from these injuries.
If you would like more information, contact OSHA at www.osha.gov or [122] 1-800-321-OSHA that's 1-800-321-6742.
Video: Sprains and Strains in Construction/Laying Stone (2:44)
Each year in the U.S., 31,000 construction workers seek medical attention due to sprains and strains suffered on the job. These injuries happen when the human body is forced to work beyond its limits. Lifting, pulling, pushing, reaching, bending, and other common construction activities can cause these injuries. The pain resulting from these injuries can last a lifetime and affect construction workers' lives at work and at home. But these injuries can be prevented.
This video shows how overexertion at construction sites can lead to worker injuries. The video will also show what employers must do so that the work can be done more safely. Employers have a responsibility to provide a safe workplace and required protective equipment. You'll see that taking the right protective steps can help prevent these injuries.
An experienced stonemason and her tender were using large stone pieces to build a walkway for a new two-story town home. A concrete slab was already in place, and the workers were putting the stone on top of the slab. The tender was mixing the mortar in five-gallon buckets and carrying the mortar to the mason.
After the mason spread some of the mortar onto the concrete slab, the workers bent over at the waist to pick up one of the heavy stone pieces. They kneeled down and hunched over to lay the stone piece on top of the mortar. After several days of carrying these heavy loads and kneeling and hunching while doing their work, both of these workers are experiencing severe lower back and knee pain.
Let's look at the events leading up to these injuries, and see how they could have been prevented. As before, the tender is mixing mortar. This time, a cement mixer is being used and the tender wheels the mortar over to the stonemason. The stone pieces have also been placed off the ground, and both workers are now wearing knee pads. After the mason spreads some of the mortar, the workers pick up and lay one of the stone pieces into the wet mortar. Making these types of small changes in work activities can prevent painful injuries.
This example shows the importance of employers using OSHA's ergonomics guidelines. These are guidelines designed, so workers can avoid stress and injury to their bodies. These types of injuries are preventable.
Follow OSHA's guidelines at work sites. By following the guidelines, workers can avoid suffering a lifetime of pain from these injuries.
If you would like more information, contact OSHA at www.osha.gov [123] or 1-800-321-OSHA or 6742.
Burns
Metal left exposed in the sun can reach high temperatures that can cause serious thermal burns. In addition, most stand-alone PV systems contain acid batteries that can create acid burn hazards. Chemical burns will occur if the acid makes contact with an unprotected part of the body. Safety glasses and gloves are recommended for installers.
Lesson 10 Activity
| Activity | Details |
|---|---|
| Assignment | Assuming you are working on the installation of the PV systems and your task is to plan and manage the entire project from design to installation stages. Part 1: For each scenario, prepare an Excel spreadsheet that specifies each task and timeline that should be followed to complete the design and installation of the PV system:
Part 2: Identify the safety procedures and equipment for each of the scenarios to align with OSHA regulations in regard to PV installation. (Hint: use the Required Reading, "Green Job Hazards: Solar Energy," as a reference.) DeliverablePrepare a report showing Parts 1 and 2. The report is to be no more than three double-spaced pages in a 12 point font. Include the tables from the Excel spreadsheets. |
| Submission Instructions and Grading | Please visit the Lesson Activity [76] page for submission instructions and grading information. |
Summary and Final Tasks
This lesson discussed one of the most essential duties of any PV project, which is project management. We learned that PV systems require planning and scheduling that ease the project development and installation processes. In addition, we talked about PV systems safety and OSHA regulations that pertain to construction sites. PV systems are green energy systems that contribute to the safety of our environment, therefore, we have to make sure that the work places comply with all safety regulations for our working personnel.
In the next lesson, we will talk about the final stages of PV projects. This includes PV System Commissioning, Operation and Maintenance (O&M), and Monitoring. Finally, we will introduce the final project, which will serve as the final evaluation for this class. See you next week!
Reminder - Complete all of the Lesson Requirements!
You have reached the end of this lesson. Before you move to the next lesson, double-check the list on the first page of the lesson to make sure you have completed all of the requirements listed there.
Lesson 11: Commissioning, System Monitoring, and Operation & Maintenance
Overview
Lesson 11 Scenario
Imagine this: your crew has finished installing the PV system you designed and managed within the timeline of the project. The owner's manual is prepared and ready to be delivered. Your team is ready to connect the PV system to the utility grid. Upon arrival of the utility personnel, what are the steps to initializing the system the first time? Are there any procedures to be followed? The owner knows that because PV systems are installed outdoors, there must be some cleaning routine and checkups to ensure the system is operating at the maximum possible performance. What are the main maintenance considerations needed for any PV system? How will the owner know if the system is producing energy or not?This lesson is a guide for PV professionals and system owners. The lesson will walk you through the basic understanding of the commissioning, operation and maintenance, and monitoring topics that relate to PV systems. This lesson prepares solar professionals to become PV system operators. Similar to any other construction that exists, O&M and monitoring are pivotal aspects of PV systems, and they are key components in driving the PV system to succeed under different operating conditions. Understanding the main concepts of O&M and system monitoring prolong the operation of PV systems and guarantee expected energy production throughout the systems' lifetimes.
Learning Outcomes
At the successful completion of this lesson, students should be able to:
- Describe steps to commissioning a PV system.
- Identify operation and maintenance tasks involved to maximize PV system output and operation.
- Identify monitoring strategies of array, components, and warranty coverage.
What is due for Lesson 11?
Lesson 11 will take us one week to complete. Please refer to the Calendar in Canvas for specific timeframes and due dates. Specific directions for assignments below can be found within this lesson and/or in Canvas.
Complete the following Lesson Assignments:
- Read through the Lesson Content
- Complete the Required Reading Assignments:
- Chapter 14, Photovoltaic Systems by James P. Dunlop (text)
- Addressing Solar Photovoltaic Operations and Maintenance Challenges A Survey of Current Knowledge and Practices July 2010 [126]
- SolarABCs-35-2013 PV System O&M Fundamentals [127]
- PV System Commissioning [128] (you can sign up for free and download related articles from Archive)
- Look over the Recommended Resources:
- Participate in the Lesson 11 Discussion
- Begin working on Final Project
- Take the Lesson 11 Quiz in Canvas
Questions?
If you have lesson-specific questions, please feel free to post to the Lesson 11 Questions discussion forum in Canvas. While you are there, feel free to post your own responses if you, too, are able to help a classmate with a question. If you have questions about the overall course or wish to share and discuss any "extra" course related commentary (interesting articles, etc.), please feel free to post to the General Questions and Discussion forum.
Commissioning Procedure
After the installation of any PV system is completed and the inspection is done, the system will be ready to be plugged to the grid to transfer energy. That process is referred to as Commissioning the system. At the same time, the installer will hand the responsibilities to the owner or operator of the system.
There are steps and requirements to commissioning PV systems that vary depending on system size and complexity of design. However, there are general guidelines that apply to most systems.
Final checkout
The system should be checked thoroughly before the commissioning starts.
A highlight of the main electrical items to consider:
- All disconnects are in (OFF) position during the final checkout.
- Installation matches the design documentation.
- Conductors, OCPD, and disconnect are sized appropriately.
- Compliance with all local AHJ and national codes (including NEC) is met.
- Terminals connections and screws are securely tightened.
A highlight of the main mechanical and structural items to consider:
- Equipment is securely mounted (such as modules, racking, inverters, panels, and disconnects and so on)
- Roof penetrations are properly weather sealed
- Installations are matched to the manufacturer's specifications and recommendations.
Other safety items to consider:
- Applicable warning signs and labels are posted appropriately
- The job site is clean and orderly
- The documentation package is complete
- Attention has been paid to details such as removing tools from the site before commissioning
Commissioning Procedure
When intending to start the PV system the first time, the procedure starts at the array and ends at the point of connection. This will reduce hazards and make the diagnostic and testing of subsystems easier in case there is a problem in the installation.
Reading
PV commissioning is a procedure that requires a lot of attention to details. Solar professionals are encouraged to refer to the required reading "PV System Commissioning" available on the overview page of this lesson.
1: Connect power sources to systems (this includes connecting PV module wire runs)
- Considerations
- AC and DC disconnects need to remain in “OFF” position
- Fuses are not connected
2: Test DC voltage and polarity
- Make sure to use proper meter settings for DC
- Test after connecting PV modules in series and measure
- Expected voltage (from calculation of modules)
- Voltage polarity
- Considerations
- AC and DC disconnects need to remain in “OFF” position
- Fuses not connected as well
- Watch for negative sign on meter that means lead positions of meter is not correct or circuit is not wired properly!!!
3: Test AC voltage at inverter output
- Make sure to use proper meter settings for AC
- Test Line to Line and Line to Neutral
- Compare with inverter AC voltage (specs sheet)
- If inverter has settings for more than one connection, match your service setting for voltage
- After this step, return fuses if applicable
4: Start-up procedure
- Lift AC disconnect lever (inverter to grid)
- Lift DC disconnect lever (PV to inverter)
- Considerations
- Check with manufacturer’s manual for specific startup procedure
- Most inverters have Delay to check on grid and synchronize before connecting
Operation and Maintenance (O&M)
Maximizing the performance of any PV system is one of the priorities of owners and integrators. This can be done with routine maintenance to ensure optimal operation conditions. Since PV systems can be owned by individuals, organizations, or utilities, there must be a set of practical guidelines to operate and maintain these systems to minimize downtimes and maximize the return on investment. The maintenance requirements vary depending on the system size, installation type, and locations. For example, stand-alone systems require more maintenance consideration due to the addition of batteries. Furthermore, manufacturers may provide maintenance guidance or procedure for components.
Maintenance Approaches
There are several major O&M approaches that exist in the market today, and each comes with tradeoffs. In simple words, each approach aims to achieve the three key goals of an effective O&M:
- Reduce costs
- Improve availability
- Increase productivity
There are three main strategies for maintenance: Preventative Maintenance, Corrective or Reactive Maintenance, and Condition-based Maintenance.
Preventive Maintenance (PM)
This strategy includes routine inspection and servicing of equipment to prevent breakdowns and unnecessary production losses. PM strategies can lower the probability of unplanned PV system downtime. However, the upfront costs associated with PM programs are moderate and requires more labor time, and the increased inspection and maintenance activity contribute to site wear and tear and perversely expedite system malfunctions.
Corrective or reactive maintenance
This strategy addresses equipment breakdowns after their occurrence to mitigate unplanned downtime. This strategy allows for low upfront costs, but it brings with it a higher risk of component failure and higher costs on the back end ( negotiating warranty terms). A certain amount of reactive maintenance will be necessary over the system lifetime, but this strategy can be minimized if more proactive PM and condition-based maintenance (CBM) strategies are adopted.
Condition-based maintenance (CBM)
This strategy uses real-time data to prioritize and optimize maintenance and resources, and can be done through third party integrators and turnkey providers. Different CBM regimes have been developed by third parties to offer greater O&M efficiency. However, this comes with a high upfront cost due to communication and monitoring software and hardware requirements.
Routine maintenance Considerations
In general, most PV systems share basic maintenance elements such as modules, inverters, charge controllers, and batteries.
PV module
A thorough inspection of PV modules can be done visually by the owner or installers. Main signs to look for when inspecting a PV system include:
- Physical damage to frame and glass
- Delaminating or change in color of the module's outer layer due to separation of bonds between glass and frame that allow moisture or corrosion to seep into the modules
- Burned connections inside module (hot spots)
- Grounding corrosion of wires or frame
- Array mount weakness or corrosion
Shading control
As we learned in lesson 2, shading can significantly reduce the electrical output of PV array. Even after a careful site evaluation is performed before installing the system, a routine maintenance is recommended to avoid:
- Soiling
- Tree growing
- Leaves and debris accumulation
Battery maintenance
Batteries are considered one of the most maintenance intensive components in the PV system. We discussed in lesson 4 that lead-acid batteries are still widely used in PV systems and a special maintenance attention is needed. A careful consideration and review of the manufacturer’s maintenance recommendations is important to ensure safety on the site.
Electrical Equipment Maintenance
Besides visual inspections of inverters, chargers, transformers, and all other electrical equipment; there are other industry tools that can be used to find the weak points of the system. An infrared (IR) thermometer can be used to find the points where higher temperatures occur, such as circuit breakers, terminals, wires, and others.
Maintenance plan
A checklist of all required maintenance tasks and their recommended intervals to ensure the best economic scheduling is referred to as a maintenance plan. The intervals can vary according to the site condition and system type. For example, a PV array installed in the desert requires more frequent scheduled cleaning of modules due to dust and soil accumulation.
Reflection
What is the main cause of system downtime in any PV system?
ANSWER: Inverters
Note:
More information about the recommended maintenance strategy practices in terms of frequency for main elements and main causes of downtime are available for students in Table 3 and Figure 2 on the EPRI report on “Addressing Solar Photovoltaic Operations and Maintenance Challenges: A Survey of Current Knowledge and Practices” posted on the Overview page of this lesson.
Monitoring
PV systems consist of different components to transfer energy. Measuring the electrical parameters at certain intervals can help gather more information about system operating status and alert users to possible problems. As we discussed earlier, measuring the output of the system is essential for production-based financial incentives offered by federal and local agencies.
The traditional monitoring method entails simply comparing actual energy generation to that predicted from the simulation software. The advantage of this approach is simplicity, affordability, and reliability. There are multiple levels at which a PV system can be monitored. Depending on system size and type, they can be classified as:
Inverter Monitoring
Inverter-level AC and DC monitoring offers insights into an inverter’s status, given the strategic location of the inverter to monitor the performance of the PV system. Nowadays, most inverter manufacturers embed their devices with monitoring functionality.
Advantages
- Relatively low costs (for central inverter)
- Monitoring of DC power being fed into the inverter
- Monitoring the level of AC power being produced on the back end
- The efficiency of power inversion
Disadvantages
- Limited level of resolution
- Information gathering, which must be done either manually on-site or via remote Ethernet link established through the inverter’s communications port, can be time consuming and labor intensive.
Array Monitoring
Going a level deeper into the system, array monitoring involves information from DC circuits located in various sections of a PV array.
Advantages
- Provides an additional level of data with a relatively small upfront investment.
- It can isolate array level problems to a more specific array segment
Disadvantages
- A single shaded or faulty panel is not easily recognized. Several panels will need to fail before a detecting a problem.
String Monitoring
A little closer to the modules, string level monitoring narrows the focus even further to individual strings of modules.
Advantage
- Failure or shading of one panel in a string is easily located
Disadvantages
- Additional monitoring complexity
- Increases installation cost
Module Monitoring
Once we reach the module, Micro Inverter Level Monitoring is installed at the PV module level. They are more common in smaller systems than large commercial or utility scale.
Advantage
- Provides more information about each individual module in the PV system.
Disadvantage
- Not very cost competitive due to the huge number of inverters
An example of monitoring is shown in the video produced by the Northern Mid-Atlantic Solar Education and Resource Center, part of The Pennsylvania State University.
Video: Monitoring Methods for PV Systems (22:47)
SPEAKER: In this recording, we discuss the monitoring of PV Systems. Monitoring often involves data or sensor wires which are separate from the power wires, along with data recording or transmitting devices. So, we will refer to monitoring equipment as a monitoring subsystem of the PV Systems.
When we are monitoring the performance of a PV System, we would like a digital record of the performance of the system as measured at known times. The most important parameters accumulative electricity generated by the system. This can be compared to models that tell how much energy of the system should produce during some period of time to determine whether or not the system is operating properly.
Such measurements are useful even if they are only made monthly or less frequently. Another useful parameter is the AC output power of the system at a given time. This information can be evaluated in combination with weather measurements decide whether the system's output is what it should be under the existing conditions.
The DC voltage and current are also valuable performance characteristics. They can indicate shading or bad connections between or within modules in the array. The DC power coming in from the array, which is the product of the DC voltage and the DC current can be compared to the AC output power to give the efficiency of the inverter.
Monitoring subsystems also sometimes record the grid voltage and frequency. These values tell you how close the grid is to the values at which the inverter is programmed to shut itself down. Lastly, weather measurements are often recorded with PV system data with these measurements you can compare the PV system voltage and current to what they ought to be under the existing weather conditions.
Back when the PV industry was much less developed than it is now, around the year 2000, PV monitoring subsystems were made for specific PV systems by combining off-the-shelf sensors and monitors that were mainly sold for other applications. Measurements were stored in the data logger at some regular interval. Eventually, the measurements were uploaded to a computer every week or less frequently.
The computer might remain connected to the data logger or it might be carried to the PV site and connected to the data logger for each data upload. Some systems also stored measurements from weather sensors. One problem with this approach is that it is very difficult to measure safely the high DC voltages that are common in PV systems.
The currents may also be difficult to measure with the accuracy needed. A good measurement system requires a lot of careful design by someone who understood the PV system, as well as additional sensor wires and system components. But the measurements are also redundant, after all the most important measurements were already made inside the inverter.
These include the DC voltage and current which are needed by the maximum PowerPoint tracker. The inverter also needs to monitor the AC voltage and frequency set by the grid in order to turn off if either one is too high or too low. The inverters control operations, including those of the maximum PowerPoint tracker are all digital anyway.
So many of the important values already existed digitally inside the inverter. However, systems like this were built with data loggers and sensors that are connected to the inverter outputs, but otherwise operate independently of other parts of the PV system. Some are undoubtedly still in use.
As PV industry developed, inverters became available with digital connections. When connected to a data receiving device, the measurements from these inverters include values that the inverter needs to measure and digitize anyway and typically some others. Diagnostic information may be available from an inverter when it is not working and in some systems control information can be sent to the inverter over the digital connection.
The inverters digital interface to the outside world may be a standard part of the inverter or it may be an extra added in the factory or in the field. Most inverters have an LCD display on the front, which also shows performance data. The digital output includes the display data and perhaps other data as well.
The digital outputs of some inverters can be read by a computer with the standard connector and software from the inverter manufacturer. More often, the output is intended for a data logger that is also sold by the inverters manufacturer. It can typically read the output from several of the manufacturers inverters at once and also data from a weather monitoring station if there is one.
However, it cannot receive data from another manufacturers inverters. The newest and presently a very popular type of monitoring is by a Web Service. In this type of monitoring, data is sent from an inverter to the manufacturer's website. The system owner can view and download the data from the website using any internet connection.
The data may be password protected or it may be available to the public. The Web monitoring service may be included with the purchase of the inverter or it may be extra. The web interface may be built into the inverter or it may be a separate device.
This type of monitoring requires internet access at the PV site. In a home, the access is over the home owners internet connection using either a wired or Wi-Fi link to the homeowner's router. However, such access is not available in some places, especially for mobile PV system. Some monitoring subsystems can also send data over the cell telephone network.
Since the manufacturers have all of this data from their installed inverters, they can use it to diagnose problems, improve designs and perhaps for promotional or business purposes. Overall, there is no standard for PV monitoring subsystems. So now, we'll simply discuss a few of the systems that have been used for PVR system monitoring.
You should consider the available monitoring process when evaluating an inverter and it may be a factor in choosing between different inverters. This is a picture of the Inverter Independent monitoring subsystem that was made by a company called fat Spaniel. The company was a pioneer in using Web services to monitor PV systems.
It was named after a pet dog which appears in its logo. This product is no longer made and very little information is available about it. The product allowed an independent measure of a PV systems AC output, which was then sent by the communication gateway to the company's website.
These inputs apparently were to measure the DC voltage of the array. The communication gateway can also receive the digital output from a compatible utility grade electric meter as well as from inverters with digital outputs. Fat Spaniel was originally an independent company but it has now been purchased by the inverter manufacturer power one.
There are many PV systems that are monitored by Fat Spaniel equipment. This shows the information on a PV system on the township library in Springfield Pennsylvania. The graph shows the hour by hour production of the system.
In general, the output of the system increases towards midday and then decreases with some fluctuations due to weather even at its peak on this day the system was generating well under its rated capacity due to the weather. And at 3 o'clock daylight savings time, the power output was less than one fourth of the array is rated output. The website can show day by day generation where we will see a lot of fluctuation due to the weather. This month by month graph is much smoother.
We see here a decrease from July down to the minimum in December, when the winter solstice occurs. And then the output begins to increase again. This picture shows a Solectria 1800 watt inverter that PennState uses for some demonstrations.
It's an older product that does not have built in disconnects a DC disconnect and an AC disconnect are mounted next to it. The inverter has an RS232 output that can be connected by a cable to a computer or compatible data logger the inverter does not have any data storage except for its lifetime electricity generation. The data must be collected and stored by a separate unit as it is output by the inverter.
This is output from the inverter on August 10th, 2011 as collected by a laptop computer connected to the inverter. Since the laptop does not have an RS232 connection and RS232 to US peak adapter had to be used. The system was turning on at about 9:23 in the morning.
In the first column, we see the dates and times of the data records. One line of data is output by this inverter about every minute, although many of the parameters change much more quickly. The maximum PowerPoint tracker changes the DC voltage and current at least every few seconds, if not more frequently.
The timestamp is followed by the inverter identification and serial numbers. Here, in the first performance data column, we see the lifetime total electricity that has been generated by this inverter. In this case, 9.0 kilowatt hours have been generated during uses on previous days.
During the six minutes shown here, the lifetime generation went from 9.0 to 9.1 kilowatt hours. In the next column, we see the AC output of the inverter it may be an average value over some time interval to avoid showing rapid fluctuations. Over the six minutes of data shown here, the AC output increased from 916 watts to 957 watts.
The rated power of the array connected to the inverter was 1980 watts. The sky was clear but the array was pointing close to due south while the sun at this time of the day was well east of due south. Next column shows the AC voltage of this grid connected PV system.
208 volts is a common line to line voltage in a low voltage three phase system. The computer connection can be used to set this inverter for an AC voltage of either 208 volts or 240 volts. The next column shows the AC output current of the inverter.
The last that a column shows the DC voltage of the array. This is the maximum PowerPoint voltage as found by the maximum PowerPoint track. Note that it does not always go up, even when the output power goes up.
After the DC voltage is a column for other information. The demonstration on this day ran until about 1 o'clock in the afternoon with another line of data collected about every minute. By then, the lifetime generation was at 12.8 kilowatt hours.
So on those four hours the system generated about 3.8 kilowatt hours. Note that the DC voltage of the array went down because the array got hotter as the day progressed. This graph shows the AC output power as a function of time.
For the first few hours, the sky was clear and the output increased fairly smoothly as the position of the sun changed to be closer to due south where the array was pointed. Then, scattered clouds appeared in the sky. When a cloud covered the sun the system's output dropped to between 250 and 500 watts.
Between clouds, the output of the system was up near where it would have been if the sky had been clear. A few times, the inverter actually exceeded its rated output of 1800 watts. The recorded outputs were as high as 1,893 watts and there were several greater than 1,880 watts.
Collecting this data required keeping a laptop computer operating for the four hours that the inverter was operating that day this is not very practical for collecting data over a long period of time. A simpler data logger could also be used as long as it is able to collect the data in the format that the inverter outputs it. Solectria also sells a Datamonitor which can collect data from up the 16 Solectria inverters and transmit it through a router and the internet to the manufacturers server.
It can then be viewed and displayed from anywhere with an internet connection. The Datamonitor can also receive data from a revenue grade and meter and transmit it along with the inverter data. The company charges for the Web Service.
The inverter manufacturer Fronius, sells a PV monitoring subsystem shown in the schematic diagram. Multiple Fronius inverters can be connected to the same data logger using communications cables. Simultaneous weather measurements can also be recorded by connecting the weather transducers to a sensor box which is also part of the data network.
A communications card needs to be added to each inverter to allow it to communicate with the data logger, this card can be installed in the field or by the vendor. The data logger can store the information sent to it for a period ranging from several days to several weeks, depending on how many inverters or other devices are sending data to it and how often they're sending it. Data can be uploaded from the data logger using an RS232 connection to a computer.
As shown, that computer needs to be near the data logger. However, there are options for transmitting the RS232 signal for longer distances. For example, if there is an internet connection near the data logger than an RS232 internet interface can be used.
And then a computer anywhere else on the internet can communicate with the data logger. Newer versions of the Fronius data logger use an ethernet connection either directly to a computer or to a local area network. When the data logger is connected to a local area network, it can be read by any other computer on the network.
Fronius also has a Web Service, which can receive data from the new version of the data logger. Accessing data about a PV system from the company's website generally requires a password but the graphs above are available to the public. These graphs were available on March 20th, 2013 the upper graph shows the total electricity generation for each day of the current month.
The lower graph shows the output power for the current day and two previous days. The jagged lines are caused by fluctuations in cloud cover. It was mid-afternoon in Europe when these graphs were seen on the website, which is when the data ends.
The inverter manufacturer SMA has two different PV monitoring subsystems. The first provides a local display but is not linked to the internet, and the second sends the information on the PV array to a company Web Service but does not have a local display. SMA may also sell so whether sensor interface that sends weather data to the Web Service.
This is a picture of the SMA Sunny Beam. It communicates by Bluetooth to up to 12 inverters within its range and it can store data for at least 90 days. The display here is showing power output of 2.5 kilowatts and electricity generation for the day of 24 kilowatt hours and a lifetime electricity generation of 1,178 kilowatt hours by the inverter it is linked to. The SMA a Sunny WebBox also communicates by Bluetooth and can receive data from up to 50 inverters.
The WebBox then communicates by an ethernet connection either to a local computer or to a router connected to the internet. It also has local memory. A version for large PV systems has wired connections to the inverters.
This graph shows some of the data available from the companies monitoring website for a 6.11 kilowatt PV system in Bryn Mawr, Pennsylvania. The blue line is the output power of the inverter and the red line is accumulative electricity generated up to various times in the day. This graph is also available on the monitoring website and shows the electricity generated on each day during the month.
The variations were due to the weather on different days. Other graphs and information are also available about various PV systems on the company's website. The last monitoring subsystem we will discuss here is by the micro inverter manufacturer Enphase.
In a system using micro inverters, there is a micro inverter for every module. Each one needs to be monitored individually. A residential system typically has only 10 to 40 micro inverters, which is not a large number to communicate with.
However, large systems have over 100 micro inverters and communicating with all of them can be more of a challenge. The Enphase monitoring subsystem uses a data device called the Envoy. The Envoy communicates with the micro inverters over the AC power wires.
In a house, the Envoy can often be plugged into a convenient outlet, which it will then use for both power and communication. The unit also needs an ethernet connection to an internet router. This is a picture of the front of the Enphase Envoy.
The display shows the present AC power output of the system and also the lifetime electricity generated by the entire system. But the display is not able to show the data from individual micro inverters. A local computer can be connected to the convoy to read some system diagnostic information.
This includes system events such as a shut down for the night or a shutdown because the grid frequency or voltage is too high or too low. A local computer can also read the information on the front display. However, a local computer connected directly to the convoy cannot read data from individual micro inverters.
Thus, even though data from individual micro inverters pass through the Envoy to the company intranet service it can only be read over a connection to the company's website. This means that in places where an Internet connection is not available, it is not possible to get data on performance of individual micro inverters. This is a disadvantage of this system in some places.
An electrical filter is sometimes needed with the Envoy and micro inverters on one side and the grid on the other. One reason that such a filter might be needed is electrical noise and the power wires. This can be the situation in an industrial building with large electrical equipment.
Another reason might be interference from other nearby Envoy that are also communicating over the power lines. There may be multiple on voice and a large PV system using micro inverters. This is Enphases webpage about a system in Philadelphia.
The diagram shows the layout of the array. The odd shape is due to various obstructions on the roof. The little rectangles and the drawing represent individual PV modules and the color is related to the most recent output transmitted to the website.
The system has 444 micro inverters and a rated output of 81 kilowatts. When this image was taken, the power output was 19.3 kilowatts and mostly cloudy conditions. And the maximum power output for the day so far has been 22.7 kilowatts.
We also see the electricity generated so far in that day, week, month. And over the lifetime of the system. Various reports are also available but they require a password that the system owner has. Two issues are indicated, possibly underperforming micro inverters but access to this information also requires the password.
Various graphs can also be displayed. This one shows the system's output for the previous 24 hours. The image was taken in the morning so it shows the previous afternoon generation followed by nighttime with no generation and then output beginning again in the morning.
This graph shows a week of generation. We see that the system generated a lot more electricity on some of these days than others due to the weather. There were also some relatively large fluctuations within the days.
Public information on many other systems with Enphase micro inverters is available on the monitoring website. In summary, we have seen monitoring subsystems that are available from different inverter manufacturers. These subsystems are not compatible with inverters from other manufacturers. It is good to consider monitoring when choosing between different inverters.
Reflection
Is micro inverter monitoring level suitable for utility scale PV systems?
ANSWER: No, due to the large number of modules. String and Inverter level are more feasible.
Lesson 11 Discussion
| Activity | Details |
|---|---|
| Assignment | Post original entry: In this lesson, we covered PV systems monitoring concepts. Based on previous discussions, we learned that PV systems classification can include more specific market sector, such as:
Post comments: Respond to two different opinions of others' posts. (For example, if you choose Option 1, you need to respond to one post for Option 2 and another post for Option 3 or 4.) |
| Requirements, Submission Instructions, and Grading | For more detailed instructions about the discussion component of this course, including how you will be graded, please visit the Discussion Activity [96] page. |
Final Project Introduction
This week, you will begin working on your Final Project. This will be a two-week project.
| Activity | Details |
|---|---|
| Assignment | This final project will highlight the main concepts we discussed in the class. The questions are designed to evaluate your understanding of the basic PV system design principles and the impact that the additional PV might have on the utility grid. Visit the Final Project [133] page for the complete details of this assignment. Note: You will not be submitting this project within this lesson. You will be submitting the entire project at the end of Lesson 12. |
Summary and Final Tasks
Let's revisit the scenarios from the beginning of this lesson. By the end of this lesson, you should be able to communicate well with the utility personnel to ensure that safe commissioning steps and procedures are followed before starting the PV system. Furthermore, you should be able to address the main O&M and monitoring questions the client asked at the beginning of this lesson. At this point in the class, our solar professionals are loaded with all basic information for design and installation of any PV systems with different sizes and types.
Being a solar professional requires a broad understanding of technologies and strategies in addition to solar design and installation knowledge such as: project management, financial analysis, communication, maintenance scheduling, monitoring networks and communication for data acquisition systems, and the list goes on.
In the next lesson, we will wrap up our class by discussing the impact of PV systems on the utility grid. As more PV are being added to the grid, there must be technical challenges to consider and understand when dealing with utilities to better negotiate and understand their requirements. So stay tuned!! See you next week.
Reminder - Complete all of the Lesson Requirements!
You have reached the end of this lesson. Before you move to the next lesson, double-check the list on the first page of the lesson to make sure you have completed all of the requirements listed there.
Lesson 12: Impact of PV into the Utility Grid
Overview
Lesson 12 Scenario
You work at one of the utility companies that is analyzing a renewable rebate structure. The ultimate plan is to allow higher renewable penetration to meet the vision for the next decade of the company’s clean energy portfolio. You are in charge of analyzing the load profiles at certain electrical feeders to predict the impact of the additional capacity on the grid. After reviewing the data collected on these feeders, your task is to accurately determine the maximum allowable renewable capacity at each interconnection point that will result in minimal grid effect. What do you look for when deciding the system size in regard to the load demand profile? Is there an impact of massive grid-connected PV systems at each point on the grid? What are the main concerns that the utilities face when dealing with different levels of renewable penetration.
For many decades, the electricity demand has followed what can be considered as a predictable daily pattern. This pattern allows utilities to perfectly predict future demand so that they can prepare themselves for buying and selling the electricity as in the energy market.
As more electricity is being generated from renewable resources, with the largest share of solar technologies, this addition to the utility grid introduces changes to the traditional daily profile of the electricity demand. These changes bring challenges with them to utilities to address reliability issues. In this lesson, we will introduce the electricity demand profile and the challenges to utilities after adding solar systems in large capacities. In addition, we will introduce this effect by what is referred to as the "Duck Curve," and later in the lesson we will talk about a proposed solution to that effect.
Ultimately, this lesson helps our solar professionals understand the back-end effect on PV and other renewable energy resources in the utility grid. Whether you work for an electric utility or you are a PV designer at an engineering firm, understanding the bigger picture on deploying PV technology helps in analyzing how the industry is driven and how to adapt to these changes.
Let’s get started!
Learning Outcomes
At the successful completion of this lesson, students should be able to:
- Describe predicted load profile viewed from the utility side.
- Discuss challenges of excessive PV interconnection on the utility grid.
What is due for Lesson 12?
Lesson 12 will take us one week to complete. Please refer to the Calendar in Canvas for specific time frames and due dates. Specific directions for the assignments below can be found within this lesson and/or in Canvas.
Complete the following Lesson Assignments:
- Read through the Lesson Content
- Complete the Required Reading Assignment:
- IEA PV roadmap [20] page 32-39
- The Future of Solar Energy [134], Chapter 7 – Integration of Distributed Photovoltaic Generators (pages 153-174), AN INTERDISCIPLINARY MIT STUDY 2015
- Look over the Recommended Reading:
- David Roberts, Why the "duck curve" created by solar power is a problem for utilities [135]
- Continental U.S. power transmission grid [136]
- Submit the Final Project
- Take the Lesson 12 Quiz in Canvas
Questions?
If you have lesson specific questions, please feel free to post to the Lesson 12 Questions discussion forum in Canvas. While you are there, feel free to post your own responses if you, too, are able to help a classmate with a question. If you have questions about the overall course or wish to share and discuss any "extra" course related commentary (interesting articles, etc.), please feel free to post to the General Questions and Discussion forum.
Electricity Demand
As we learned previously, the demand for electricity varies throughout the day and year, and so does solar irradiance. For example, the residential electricity demand rises in the morning to peak just before noontime, and then it levels out up until the evening peak, when everyone gets home from work and starts using electricity. And that pattern repeats itself over and over with some variations between summer and winter seasons, as seen in the left curves on Figure 12.1. We can also see that this curve is location dependent. There are key characteristics to this daily demand profile, such as the two daily peaks and then a base load demand.
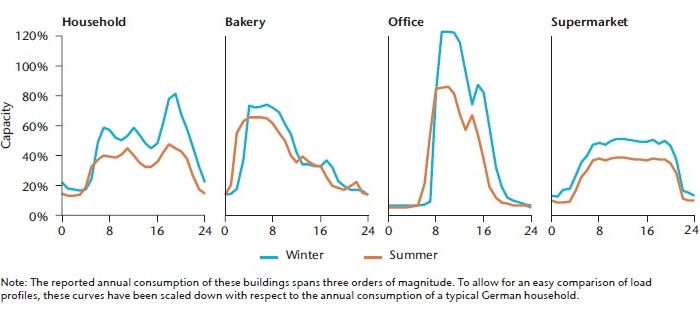
As we said earlier, utilities became experts at predicting these values to better trade their electricity, and also, more importantly, to plan the operating schedule for the power plants. This planning helps optimally and economically operate their power plants to meet the base loads (usually coal or nuclear) and the additional capacity to meet the peak demands (such as Natural gas).
The load demand had been under control up until the distributed generation sources got introduced to the grid, which are variable and unexpected. Although the idea of meeting the peak demand is very appealing and is actually beneficial, excessive addition of these resources such as solar will change the load profile in such a way that utilities have to get out of their comfort zones and address these changes by meeting the new demand profiles.
Since our class focuses on solar systems, let’s take the solar effect as an example: Integrating a small amount of PV capacity doesn’t raise any technical issues to the grid, as long as the PV capacity is not concentrated in areas where the grid is weak and demand is low. However, when adding PV capacity in larger scales, the main concern from the grid and utilities point of view will be the supply and demand balance. One of the main issues that the solar arrays have are the inability to schedule its operating as compared to traditional coal plants, for example. The sun may shine as predicted, or it might not shine at all. In addition, solar only contributed in the best scenario to the daytime demand profile rather than the daily profile, and that contribution lowers the base load on the utility demand, but it disappears in the evening time.
Solar Duck Effect
So what is that fundamental change that solar adds to the daily demand profile?
The effect that solar power has on the daily profile is referred to as the "Duck Curve" or "Duck Chart." This change in the load shape of the daily curve starts to look like a duck. If we look at solar from the grid point of view, the additional solar looks like a load reduction and that is at the same time unpredictable and uncontrollable. In other words, the solar disturbs the operation of the bulk power plants such as coal by lowering the base load demand, as seen in Figure 12.2.
As said earlier, there are key characteristics to this daily demand profile, such as the two daily peaks and then a base load demand. Usually loads don’t fall below a certain value, as we see on the 2012 curve provided by the California Independent System Operators (ISO) as shown in Figure 12.2.
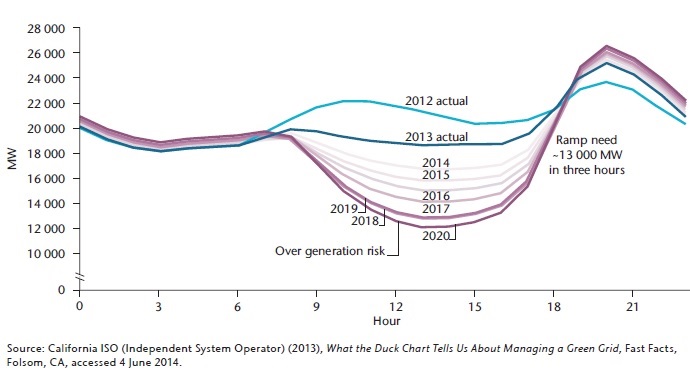
We can see some greater challenges as solar becomes larger in capacity. The load demand can fall down to closer to very small demand value, which means the massive base power plants need to shut down, and that is not an easy task since starting a traditional power plant requires hours, and the process is slow and might not meet the steep ramp demand in the evening after the solar is gone. This can result in a serious stability issue and power outages. For this reason, solar is sometimes viewed as a disruptive technology to the grid and utilities. A prediction of the duck effect on the daily demand curves can also be seen on the 2020 prediction for the daily profile in Figure 12.2.
Proposed Solutions to Duck Effect
Solar arrays may produce more solar energy than the grid needs. When such oversupply exists, there are two main scenarios to propose solutions from the grid point of view - the grid operator side and the load side.
Grid Operator Side
- Utility operators can manually "curtail" solar production, cutting some solar capacity off from the grid. As a result, this wastes the energy produced from the sun, but it saves the grid. This is considered a short term solution.
- Another solution is interconnection with other electricity networks, such as the Texas and western interconnection at the transmission level to expand the capacity of the grid so it can handle more PV capacity. As it sounds, this is a long term solution and usually it takes a long time to expand the grid.
Note:
You may wish to read "Continental U.S. power transmission grid" in the recommended resources on the Overview page for more information about the U.S. grid interconnection.
Load Side or Demand Side Management (DSM)
- The first DSM strategy refers to Demand Response (DR) including storage systems. This can shift the peak to other times during the day, which is usually done either through incentivizing the customers to use electricity when it is cheaper or by storing the electricity for later use. However, this might require more capital investment at the customer side due to the additional storage systems cost.
- The other type of DSM is the Energy Efficiency that lowers the total demand in general. This strategy has great potential, as our peak demand keeps growing due to additional appliances and devices connected to the grid.
Note:
More solutions are being researched to come up with the best scenarios to solve this technical issue. You are encouraged to keep yourselves updated with the new solutions in the market.
Final Project
This week, you will finish up and submit your Final Project.
| Activity | Details |
|---|---|
| Assignment |
Visit the Final Project [133] page for details on this overall assignment. You will be submitting your Final Project at the end of this lesson. |
Summary and Final Tasks
In this lesson, we talked about the electricity demand and load profile changes due to the addition of solar into the grid. We also discussed the duck effect and the shape of the curve as a result of solar energy availability during the daytime and its absence during the nighttime.
Our class has reached its end, and we hope we covered all information needed to prepare you as a future solar professional and equipped you with the right tools. Our main goal as a solar option is to expose you to various scenarios you might face in the real-world when dealing with solar systems in terms of system main components, sizing and design, permitting, documentation, code compliance, interconnection methods, safety regulations, commissioning, operating and maintenance, monitoring, and most importantly the effect of PV on the grid.
Reminder - Complete all of the Lesson Requirements!
You have reached the end of this lesson. Please double-check the list on the first page of the lesson to make sure you have completed all of the requirements listed there.