Additional reading from www.astronomynotes.com
The Big Bang Model is sometimes challenged in some of the same ways we see evolution being challenged. Since astronomers provide evidence that the Universe is about 13.7 billion years old, those who believe in a young Earth also attack the validity of the Big Bang model. However, astronomers consider the Big Bang to be quite successful in explaining a number of observations of the Universe, and although it does have some limitations, its fundamental ideas are not in doubt. One of the strongest pieces of evidence that supports the Big Bang model is the presence of a Cosmic Microwave Background Radiation, or CMB, observed throughout the Universe.
Want to read more?
The American Astronomical Society has put together a concise booklet called "The Ancient Universe," which is subtitled, "How Astronomers Know the Vast Scale of Cosmic Time." This booklet is an excellent resource, and it provides in one place the multiple lines of evidence we have found to support the age of the Universe.
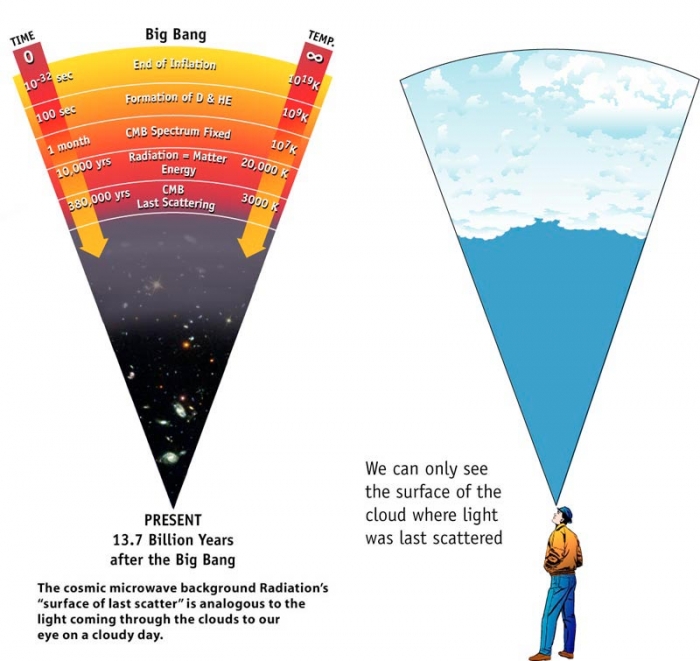
Consider the Universe shortly after the Big Bang. It was still quite small, so all of the matter present was extremely hot and extremely dense. The temperature was so high that atoms could not exist. Instead, the Universe was filled with electrons, atomic nuclei, and photons of light. At this time, the Universe was opaque, because the free electrons in the Universe scatter the photons of light. The analogy you often hear to describe this process is one that compares the passage of photons through the Universe to the passage of photons through the clouds in Earth's atmosphere. Clouds scatter light, too, so although you can see through the clear air to the base of the clouds, you can't see beyond the clouds because photons of light are scattered by the clouds. At some point in time during the Universe's early expansion, the temperature cooled enough for the free electrons to combine with the nuclei, creating atoms. This epoch of time in the Universe's history is referred to as recombination. After recombination, the Universe is no longer opaque, so all of those photons of light could freely move through space, eventually reaching Earth. Recall the phenomenon of lookback time—by looking to large distances in space, we are also looking earlier and earlier in the Universe's history. So, we should be able to see the transition from our currently transparent Universe to an opaque Universe at very large lookback times just like we can see through the transparent air to the opaque clouds on an overcast day. This is illustrated below.

In the illustration above on the left, you see that the right side is labeled with the temperature of the Universe at that time. At the time when recombination occurred, the Universe was filled with an opaque gas with a uniform temperature of approximately 3000 kelvin, so its spectrum was that of a blackbody of 3000 K. As those photons from that 3000 K blackbody have traveled through the Universe to reach Earth, they have been redshifted by the expansion of the Universe. When they reach us, the peak of the blackbody spectrum is not seen to correspond to a temperature of 3000 K, but to a temperature of 2.7 K, which is in the microwave part of the spectrum. Hence the name the Cosmic Microwave Background Radiation.
This is another area of astronomy that has generated Nobel Prizes. In the 1960s, two researchers from Bell Labs, Penzias and Wilson, detected a "hiss" in their radio telescope that seemed to be detected no matter where the instrument was pointed. After eliminating every possible source of the noise (a famous part of their story is that they also considered and rejected the pigeons living in their telescope and the pigeon droppings they left behind as a potential source of this noise), they concluded that they had detected a cosmic background. At the time, other astronomers had made theoretical calculations suggesting there should be a CMB and had predicted its temperature. By comparing their predictions to the results of Penzias and Wilson, they determined that this radiation provided evidence supporting the Big Bang Model. Penzias and Wilson won the Nobel Prize in 1978. However, the theorists who made the predictions about the nature of the CMB did not share the prize.
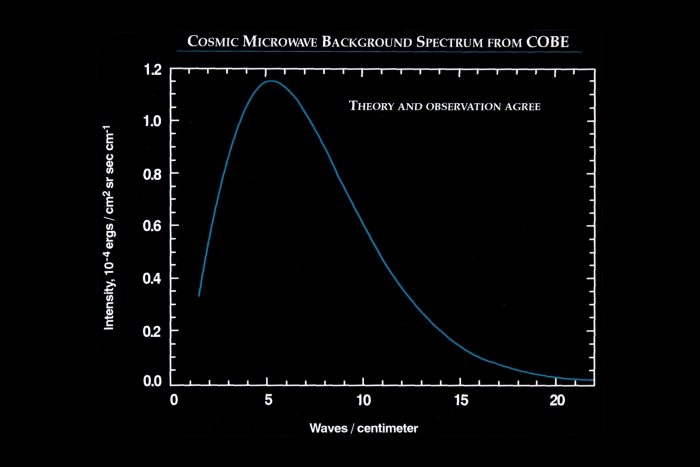
Since the work of Penzias and Wilson, NASA has launched two satellites to study the CMB in detail. There have also been a large number of ground-based, and even balloon-based, experiments to study this radiation. The Cosmic Background Explorer, or COBE, was launched in 1989. It studied the CMB for a number of years. COBE measured the spectrum of the CMB and found the data shown below.
This plot shows that the spectrum of the CMB is exactly the shape of a blackbody curve emitted by an opaque gas with a temperature of 2.726 kelvin. This and other results from the COBE mission were considered so important to the study of cosmology and the Big Bang model that John Mather and George Smoot were awarded the Nobel Prize for Physics in 2006.
The WMAP mission followed COBE, and it measured the CMB more precisely than COBE was able to do. Both missions found the same thing, though. The map of the CMB over the sky is remarkably smooth. Here is an image of the entire sky of the CMB as detected by WMAP.
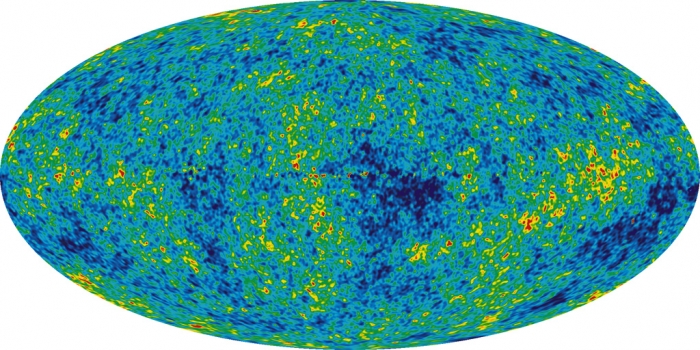
This image may seem like a joke, but it is an accurate representation of the data. It shows that over the entire sky, WMAP measured the intensity of the CMB radiation to be uniform to about 1 part in 100,000. However, if you enhance this image after removing variations caused by the redshift and blueshift of the CMB caused by the Earth's motion through the Universe and removing the foreground microwave radiation from the Milky Way Galaxy and other bright point sources in the Universe, you can produce a map of the intrinsic anisotropies in the CMB. Below is the enhanced image.
The areas of red and dark blue show the maximum deviations from uniformity. They correspond to differences in the temperature of the CMB of approximately +/- 200 microKelvin (that is 0.0002 Kelvin). Astronomers interpret these fluctuations as small differences in the density of the plasma that filled the Universe right after the Big Bang. Astronomers have devoted a great deal of effort to studying these anisotropies, because they allow us to further refine our model for the Universe. The way this process works is that astronomers can choose the parameters for a particular model of the Universe (for example, they set in the model the current value of Hubble's constant, the current density of normal matter in the Universe, etc.) and, based on those parameters, they can create a simulated map of the expected anisotropies in the CMB in a Universe with those parameters. They can compare their predicted map to the measured anisotropies from WMAP and determine how their chosen parameters match the real values for our Universe. In this way, this map has allowed us to refine our measurements for the cosmological parameters to higher precision than has been previously possible.
Want to Learn More?
- WGBH Public Broadcasting and Bell Labs both have websites with information about the 1978 Nobel Prize to Penzias and Wilson.
- NASA provides information about the 2006 Nobel Prize awarded to John Mather.
- The Lawrence Berkely Lab has a website with information about the 2006 Nobel Prize awarded to George Smoot.
- Proving that astronomers have a sense of humor, Nobel Laureate George Smoot has guest starred as himself on the sitcom "The Big Bang Theory."


