Additional reading from www.astronomynotes.com
In the lesson on star clusters, you learned that these objects are excellent tracers of the size and shape of our galaxy. What this means is that since these groups of stars are part of our galaxy, their distribution in space helps define the boundaries of our galaxy. Star clusters are big and bright, so they stand out above the background, making them easy to spot even at large distances. An analogy in this case may be to think of them like the tallest skyscrapers in a city. From a distance, you can see these tall buildings very easily, allowing you to determine roughly your distance from the city. You can also estimate how big the city is by how many skyscrapers it contains and how spread out they are.
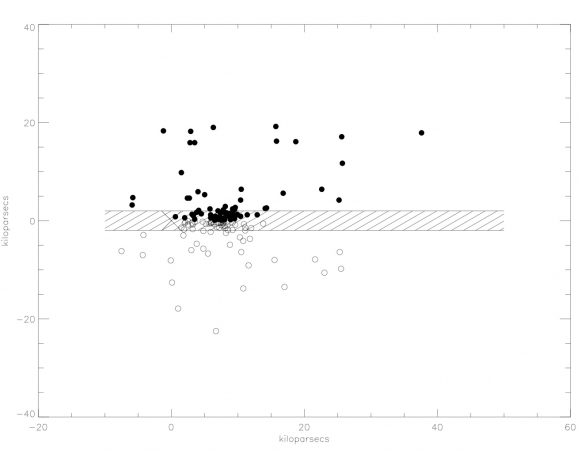
In 1917, Harlow Shapley used the globular clusters in the Milky Way to gain a better understanding of the Milky Way Galaxy. He measured their positions and distances and plotted their locations on a two-dimensional chart. I have reproduced his work in the two-dimensional plot below, but using modern data for the distances and locations of all known globular clusters.

In this figure, the X and Y axes are in units of distances in kiloparsecs (1 kiloparsec = 1,000 parsecs). The hatched region represents the plane of the Milky Way (that is, roughly the part of the sky where the Milky Way is visible to the eye), and the X located at (0,0) marks the location of the Sun in the plane of the Milky Way. The Galaxy fills a 3D region in space, so this 2D plot only shows a slice from the top to the bottom through the plane of the Milky Way.
Shapley's data was not as extensive as in the plot shown above, nor was it as accurate. Similar to Herschel and Kapteyn, dust extinction and reddening affected his distance measurements to the clusters, and thus his conclusions as well. Because dust makes stars appear fainter than they truly are, if you do not account for the amount of extinction, you will overestimate the distances to these objects. This is just what Shapley did. However, the data he did have allowed him to make two very important discoveries:
- The globular clusters trace out a roughly spherical region in space. (Remember, a slice through a sphere is a circle.)
- The Sun is significantly offset from the center of this distribution.
There appears to be a significant discrepancy between the work of Shapley using the globular clusters and much of our early discussion about the appearance of the Milky Way in the sky. Why are the globular clusters tracing out a round, spherical distribution on the sky if the Milky Way itself appears to be a flattened plane? The answer is that the Milky Way is actually a little of both!
If we use a different type of object to trace the structure of the Milky Way, we find a different size and shape. If we use open clusters as tracers, they do match well the shape of the visible band of the Milky Way. Open clusters are predominantly young objects, so if we select other objects that also trace out the regions in the Milky Way that contain newly forming or newly formed stars (e.g., giant molecular clouds, O and B stars, emission nebulae), they also show that the Milky Way is a flattened, disk-shaped object. So the globular clusters (which contain very old stars) reveal a spherical component of the Milky Way, while the open clusters and other young stars and star-forming regions reveal a disk-shaped component of the Milky Way.
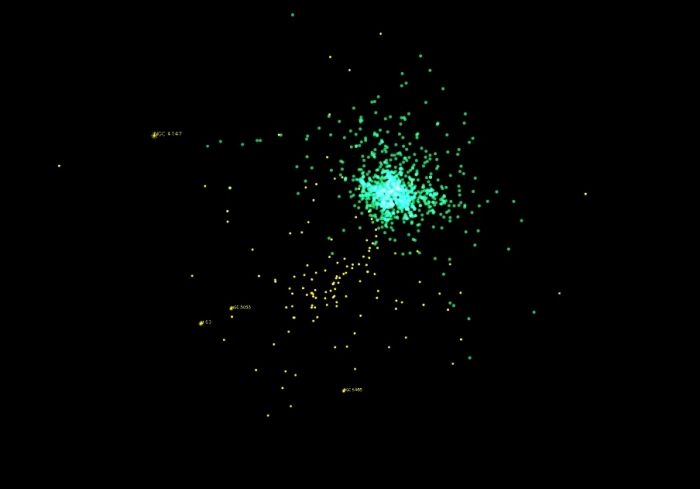
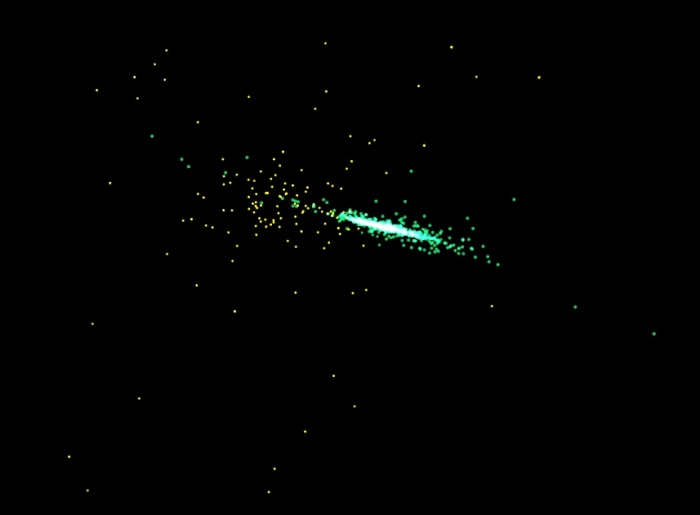
Again, we can use modern data and plot the locations of both open clusters and globular clusters to compare and contrast their locations. Below are two different views of this data. The first is a top-down view and the second is an edge-on view. In both images, the green dots represent open clusters, and the yellow dots represent the globular clusters. The scale is approximately the same as the plot above.
Viewing the Milky Way from the top down in the plot below, you can see that the open clusters and the globular clusters are not observed in the same location. This is misleading because it is a selection effect. What this means is that there are more open clusters in the Milky Way than the ones shown in green, we just are not able to observe the more distant ones given the current state of telescope and detector technology. In this image, the Sun is located in the center of the dense group of open clusters, and like with Herschel's map of the Milky Way, the only reason the Sun is in the center is because that is the location from where we are observing and we are prevented from observing the objects far beyond the edge of that group. In the case of the globular clusters, you can see the Sun is offset from their center (just as you can in the plot above), and in this case, we are able to observe the majority of these objects in the Milky Way, so that offset is real.

If you take the top view image above and picture rotating it by 90 degrees, you will get the edge-on view of the Milky Way below:

Now when we look at the Milky Way edge-on, we can see how the globular clusters still describe a circular region, but the open clusters do not. This shows you how you can use the distribution of the open clusters to measure the thickness of the Milky Way, but the globular clusters to measure its radius.