Lesson 9
Overview
About Lesson 9
Our view of the Earth's place in the universe has been evolving during this course. Originally, we considered the view of the night sky from a location on Earth. Our observations from the Earth can lead to the biased view that the Earth is the center of the universe, and in fact, this was the dominant theory for centuries. Careful observations and related advances in the theories created to explain these observations led to the revolutionary proposal that the Earth is really just one planet in orbit around the Sun. Subsequent studies of the stars and gas in the Milky Way have now established that the Sun is just one of many billions of stars located in the outskirts of the disk of the Galaxy.
In this lesson, we are going to continue to expand our understanding of the Earth's location in the universe. This time, we are going to place the Milky Way in context by studying the number and distribution of other galaxies like our own, as well as the variety of galaxies that are unlike our Milky Way.
What will we learn in Lesson 9?
By the end of Lesson 9, you should be able to:
- Compare and contrast the other galaxies in the Universe using the traditional tuning fork model;
- Qualitatively describe the process by which galaxies evolve;
- Compare and contrast a normal galaxy and an active galaxy;
- Describe the spatial distribution of galaxies within the Universe and the environments in which galaxies reside.
What is due for Lesson 9?
Lesson 9 will take us one week to complete.
Please refer to the Calendar in Canvas for specific time frames and due dates.
There are a number of required activities in this lesson. The chart below provides an overview of those activities that must be submitted for Lesson 9. For assignment details, refer to the lesson page noted.
| Requirement | Submitting your work |
|---|---|
| Lesson 9 Quiz | Your score on this quiz will count towards your overall quiz average. |
| Unit 3 Lab, Part 1 | During Lesson 9, you will begin work on the Galaxies lab listed under Lab 3, Part 1. |
Questions?
If you have any questions, please post them to the General Questions and Discussion forum (not email). I will check that discussion forum daily to respond. While you are there, feel free to post your own responses if you, too, are able to help out a classmate.
The Spiral Nebulae and the Great Debate
Additional reading from www.astronomynotes.com [1]
- Other Galaxies [2]
We have defined the Milky Way as the conglomeration of objects that are mutually bound to each other by the force of gravity. The Milky Way thus consists of stars, gas, and dust. The gas in the Milky Way takes many forms, but the most visible forms are the different types of bright nebulae.
Many different nebulae were well known to astronomers in the early part of the 20th century, but their nature was not yet entirely understood. Recall that the Messier Catalogue from the 18th century included a number of nebulae, and the NGC catalogue of the 19th century included thousands more. By the early part of the 20th century, one specific type of object in these catalogues, called “spiral nebulae,” was generating a lot of debate because the nature of these nebulae was not understood. Below is an example image of M51 (unfortunately, it is not very well reproduced in this image), published in 1910 by George Ritchey. Note that the label he uses is "Spiral Nebula Messier 51."

The two sides of the argument over the spiral nebulae had to do with the size of the Milky Way and its relationship to the universe as a whole. On the one hand, some astronomers argued that the Milky Way was a large part of the entire universe, and that the spiral nebulae were just one other type of gas cloud inside of our Galaxy. On the other hand, some astronomers argued that these spiral nebulae were “island universes” like the Milky Way, and they were simply so far away that their stars were not resolved into point sources of light but were instead blurred together so they looked like a nebula. This argument culminated in a debate between two astronomers in 1920 that is now referred to as the “Great Debate.”
The topic of the debate was the “Scale of the Universe,” and one of the debaters was Harlow Shapley. Shapley is the astronomer who used globular clusters to determine the size of the Milky Way, and this research was also his contribution to the debate. Heber Curtis was the other participant in the debate. His main assertion was that the spiral nebulae are objects like the Milky Way, not objects contained in the Milky Way. In the late 90s, additional debates were held on modern topics to celebrate the 75th anniversary of the Great Debate, and a lot of information on the original program was collected and published on The Shapley-Curtis Debate website. [4]
The data used by both Shapley and Curtis in their debate were not of high enough quality to conclusively solve the debate over the nature of the spiral nebulae. However, even though they drew other conclusions that have since been proven incorrect, both astronomers made points that fundamentally altered the understanding of our place in the Universe. Shapley did show that the Milky Way is larger than it was believed at the time and that the Sun is offset from the center. His incorrect conclusion was that he believed that the Milky Way was so large that it could encompass the spiral nebulae. Curtis' main contribution was to argue that the data available were not of sufficient quality to conclude that the spiral nebulae were inside of the Milky Way, and he believed that we would eventually find them to be external objects similar to the Milky Way. His argument relied on his belief that the Milky Way was much smaller than it truly is, however. So, although Curtis was proven correct about the nature of the spiral nebulae, he came to that conclusion based on a faulty assumption!
One observation was made shortly after the Great Debate that conclusively settled the debate on the nature of the spiral nebulae. Using the 100-inch telescope on Mount Wilson, Edwin Hubble took images of M31, the Andromeda Nebula. He discovered that M31 was composed of stars, and he even identified several Cepheid variable stars useful for measuring the distance to M31. If you remember our discussion of Cepheid stars, they have a very specific relationship between their variability period and their luminosity. Thus, if you measure the period of a Cepheid variable, you can estimate its luminosity. Then, if you measure the apparent brightness of the Cepheid (which you can do using the same observations you took to get its period), you can measure its distance. When Hubble calculated the distance to Andromeda, he found that it was much larger than the size of the Milky Way, confirming that this was another galaxy like the Milky Way, and not a “spiral nebula” inside of the Milky Way.
Want to learn more?
The discovery of the first variable star in M31 was one of many discoveries by Edwin Hubble that fundamentally revised our understanding of the Universe. You can learn a bit more about this discovery at the following websites:
- Astronomy Picture of the Day [5]
- The American Institute of Physics has an excellent website called "Cosmic Journey: A History of Scientific Cosmology. [6]"
- There is a page on "Island Universes [7]," which goes into many of the same topics discussed here.
- Near the bottom of that page are quotes from Hubble, images of his notebook [8], and a better reproduction of his famous M31 image [9] than available at APOD.
We will learn more of Hubble's accomplishments later in this lesson and in the next lesson, but if you would like to read more about the man who is widely considered the greatest astronomer of the modern age, you can consult the following:
The discovery that the spiral nebulae are other galaxies similar to the Milky Way again caused a large shift in our understanding of the Universe and our place in it. For example, prior to Hubble's discovery, Shapley believed that the Universe was filled almost entirely by the Milky Way. Hubble showed that, in reality, the Milky Way is just one object in a universe filled with many billions of other similar objects, which forces us to realize that the universe is much larger than the Milky Way. One popular astronomy textbook has a nice expression that summarizes our current understanding: “Galaxies are the fundamental units of the Universe, just as stars are the basic units of galaxies." (The Cosmos: Astronomy in the New Millenium [11]. Pasachoff & Filippenko , 3rd edition, p. 367.)
Hubble's Tuning Fork and Galaxy Classification
Additional reading from www.astronomynotes.com [1]
- Types of Galaxies [12]
- Spirals [13]
- Irregulars [14]
Coincident with his discovery of Cepheid stars in Andromeda, Edwin Hubble was working in the mid 1920s to study other galaxies in more detail (although, at that point, it was still common terminology to refer to them as nebulae). It is often the case with the discovery of a new class of objects that astronomers invent a classification scheme as a first step to try to understand these objects. Hubble is credited with creating a classification scheme for galaxies, which is usually referred to as his “Tuning Fork” diagram.

The Hubble Tuning Fork has been reproduced many times with many different sets of galaxy images. A particularly detailed version was produced by the Spitzer Infrared Nearby Galaxies Survey [16] (SINGS) group. The group wrote a brief article describing their work [17] for you to read. If you want to print this out as a full-size poster for your classroom, they have made available a 4200x3600 TIFF file [18] that provides enough resolution to do so.
It becomes very apparent after observing just a few galaxies, like Hubble did, that there are a great variety of types. Some are featureless, while others have very distinct spiral arms. Below are links to a number of images of the various galaxy types. After you look at a number of different galaxies, we will discuss Hubble's classification scheme below.
Try this with Starry Night!
You should repeat some of what Hubble did when he developed his tuning fork classification system. You should investigate the images of several galaxies, and then compare and contrast their features. First, open Starry Night, and do the following (Note: The Digital Download core application does not have galaxy images. So, if you have that version, you will have to skip this part of the exercise):
- Using the find tool, locate galaxies, M51, M81, M95, M61, M87, M49, M59 one at a time.
- When you center on the galaxy, using the zoom tool, zoom in so that you can see the image at a reasonable level of detail.
- Keep a mental list of the similarities and differences between these 7 objects.
Next, study some specific examples in detail to familiarize yourself with their differences:
- Hubblesite image of a normal spiral: M51 Image tour [19]
- Hubblesite image of a barred spiral: NGC 1300 image tour [20]
- Hubblesite image of a dwarf irregular galaxy: NGC 4449 image tour [21]
Finally, if you want to look at images of galaxies of a specific type, below is a list of galaxies with their types in Hubble's classification scheme:
- Sa spiral M81 [22]
- Sb spiral M51 [23] (note, M51 has a companion galaxy, and it is the main object that is classified as an Sb spiral)
- Sc spiral NGC 2997 [24]
- SBa barred spiral M95 [25]
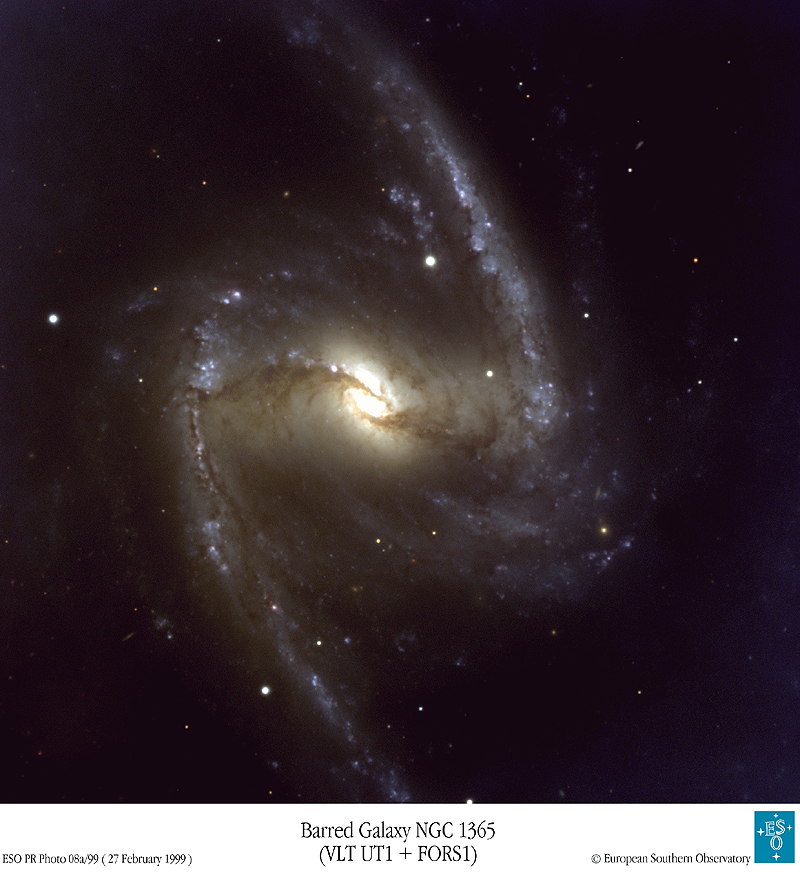
- SBb barred spiral NGC 1365 [26]
- SBc barred spiral M61 [27]
- E0 elliptical M87 [28]
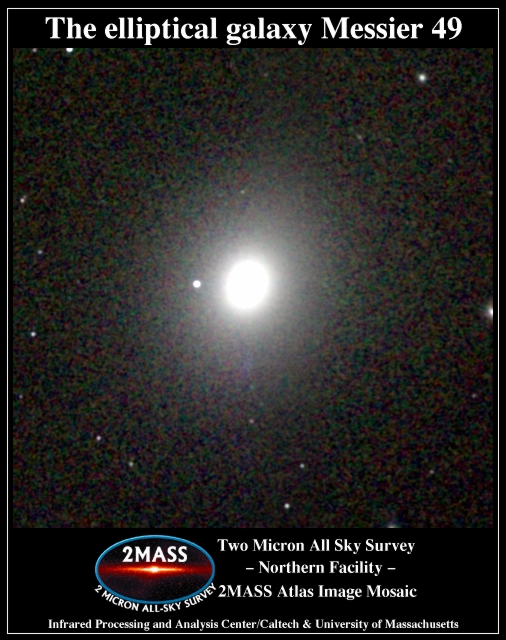
- E1 elliptical M49 [29]
- E5 elliptical M59 [30]
- Irregular II galaxy M82 [31]
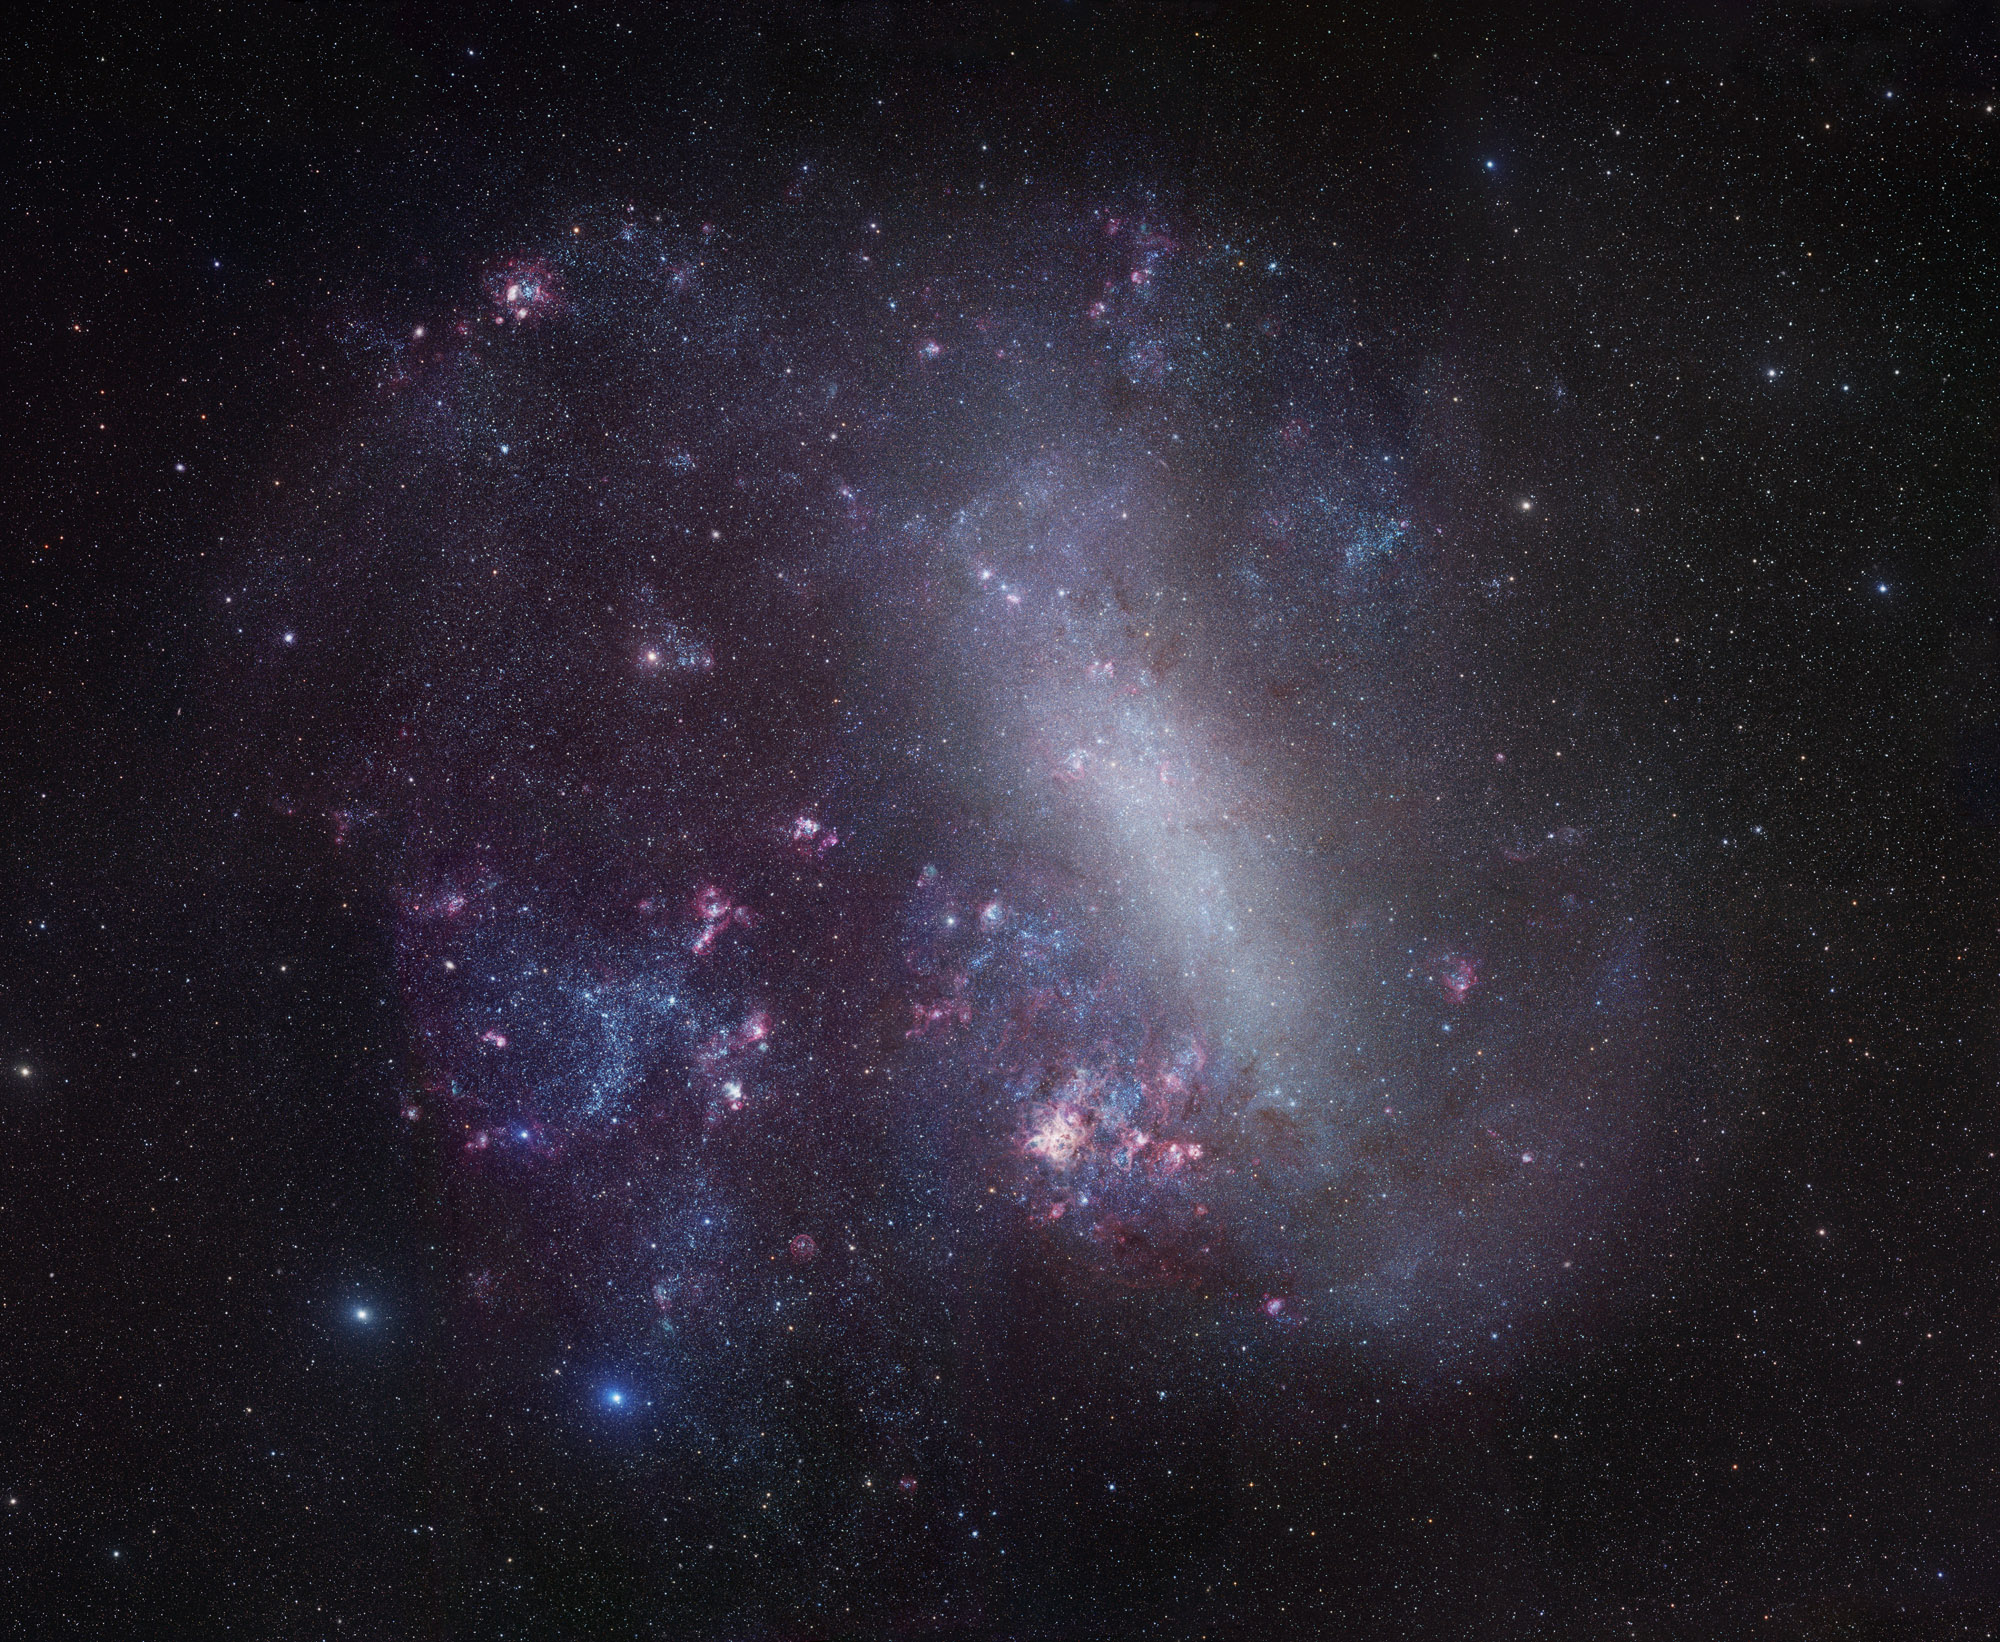
- Irregular I galaxy Large Magellanic Cloud [32]
Want to Learn More?
- You can find many, many more images of galaxies at a variety of websites, but here is one source at the National Optical Astronomy Observatory [33] with an excellent sample of many of the well-known types.
Edwin Hubble classified galaxies using the types that you see illustrated on the two tuning fork images; the one above and the SINGS image. His main types are:
- Spirals,
- Barred Spirals,
- Ellipticals,
- and Irregulars.
Within each of these groups, there are also sub-classifications.
Spirals
A spiral galaxy is classified as an S galaxy with subclassification a, b, or c, so for example, M51 above is classified as an Sb galaxy. The subclasses are divided based on the dominance of the bulge component of the galaxy. In Sa galaxies, the bulge dominates the galaxy, while in Sc galaxies, the bulge is much smaller. This is labeled on the SINGS Tuning Fork.
The appearance of the spiral arms also changes between the a, b, and c subclasses. In Sa galaxies, the arms are tightly wrapped around the bulge, while in Sc galaxies the arms are much looser, and often appear to be more clumpy than the smooth arms of an Sa galaxy. Sb galaxies have intermediate properties between those of Sa and Sc galaxies.
We can classify edge-on spiral galaxies based on the appearance of their bulge, even without being able to see the spiral arms. So for example, the edge-on spiral M104 - the Sombrero galaxy, seen below, can be classified as an Sa galaxy.

Here is another edge-on spiral galaxy, NGC 4565. Can you guess what type it would be assigned, Sa, Sb, or Sc? What is the most obvious difference between NGC 4565 and M104?

Since the Milky Way is a spiral galaxy, you can consider its properties as illustrative of spiral galaxies in general. Spiral galaxies like the Milky Way often contain large amounts of gas and dust, and given the presence of gas, are found to contain many young stars and star-forming regions. The colors of spiral galaxies vary from location to location within the galaxy, but because of the presence of O&B stars in these galaxies, their overall colors tend to be towards the blue end of the spectrum.
Barred Spirals
In some spiral galaxies, the bulge has a well-defined BAR that passes through the bulge. Hubble classified these galaxies by referring to them as SB galaxies with subclasses a, b, and c, just like the normal spirals. The spiral arms in barred spirals appear to originate at the ends of the bar, instead of in the bulge, like they do in normal spirals. We believe that the Milky Way is a barred spiral, perhaps an SBb or SBc type. The schematic image of the Milky Way [36] that you studied in a previous lesson shows the Milky Way bar. Besides the presence of the bar, the properties of barred spiral galaxies are very similar to normal spirals.
Ellipticals
Elliptical galaxies (type E in Hubble's scheme) are featureless galaxies that appear to be just a ball of stars. They do not have obvious dust lanes and gas clouds like we see in spiral galaxies, either. There is no Hubble image tour of an elliptical galaxy, because there are no features to tour! With no gas and no dust, there are no young stars or star-forming regions seen in typical elliptical galaxies. The overall colors and spectra of elliptical galaxies are very similar to K stars, since they are dominated by these older, red stars.
The subclasses of the elliptical class are assigned numbers based on how round they appear. The roundest ellipticals are referred to as E0 galaxies, and the most elliptical-shaped galaxies that we have observed are labeled E7 galaxies. The numerical designation is determined by the ratio of the major axis (a) to the minor axis (b) of the object. The ellipticity is defined as e = 1 - (b/a), so a circle will have an ellipticity of 0, and a highly elliptical galaxy with a minor axis 30% of the length of its major axis will have an ellipticity of e = 1 - (3 / 10) = 0.7. An E0 galaxy has an ellipticity of 0, and an E7 galaxy has an ellipticity of 0.7, so to determine the Hubble classification, you multiply the ellipticity by 10. Be aware that just like with spiral galaxies, our image of that object is a 2D projection of a 3D object, and so the classification only tells you how it appears from your point of view. If you consider a football as a decent analogy for an elliptical galaxy (see image below), if you look at it from the side view as in the picture, you can see its elliptical nature. However, if you look at it from the point of view of the tip of the football, it will appear to be circular. So, an elliptical galaxy that appears to us as an E0, might appear as an E7 to an observer living in a distant galaxy with a different point of view from ours.

There are some galaxies that appear to be intermediate between ellipticals and spirals. They are disk galaxies with bulges, but they have very little or no gas and dust like other spirals. Their disks do not show evidence of spiral arms, either. These galaxies are usually called lenticular galaxies or S0 galaxies.
Irregulars
Finally, we have the "miscellaneous" category. Anything that is so unusual that it can't be fit into any of the normal categories is called an irregular galaxy. There are two subclasses in this group, too. Irregular I galaxies (like the Magellanic Clouds) appear to have some spiral structure, but it appears to have been disrupted. Irregular II galaxies are much more disturbed than Irr I galaxies and look like they have been victims of some type of violent event that has completely disrupted their original shape. Many irregular galaxies are found to contain many young stars and to be experiencing significant ongoing star formation.
In conclusion...
At this point, it should be noted that classification of galaxies is not a very precise enterprise. In fact, if you do any follow up research on some of the galaxies above, you will find a variety of classifications given for the same object. For example, M81 can be found labeled Sa or Sb. Depending on the type of observations made (e.g., optical observations vs. infrared observations), a barred spiral may have a prominent bar in one image, and it may be almost unobservable in another. So, you may find the same galaxy classified as an Sb or an SBb depending on how it was observed.
There are many other properties of galaxies we can discuss in some detail, but to conclude our discussion of normal galaxies, we should briefly discuss the size of typical galaxies. Among spirals and barred spirals, there is a reasonable amount of uniformity. Some spiral galaxies, like M33 [38], are measurably smaller than others, like M31 [39], which is approximately four times larger. However, in general, the differences are small. Within the class of elliptical galaxies, however, there is a much larger range of sizes. Some galaxies are referred to as dwarf ellipticals because they share many of the properties of elliptical galaxies but are significantly smaller and less massive. NGC 205 is an example [40]. If we take a census of the galaxies in the Universe, it appears that by number, dwarf ellipticals are the most common type of galaxy in the Universe.
Exotic Galaxies
Additional reading from www.astronomynotes.com [1]
- Active Galaxies: Quasars [41]
- Active Galaxies [42]
- Power Source for Active Galaxies and Quasars [43]
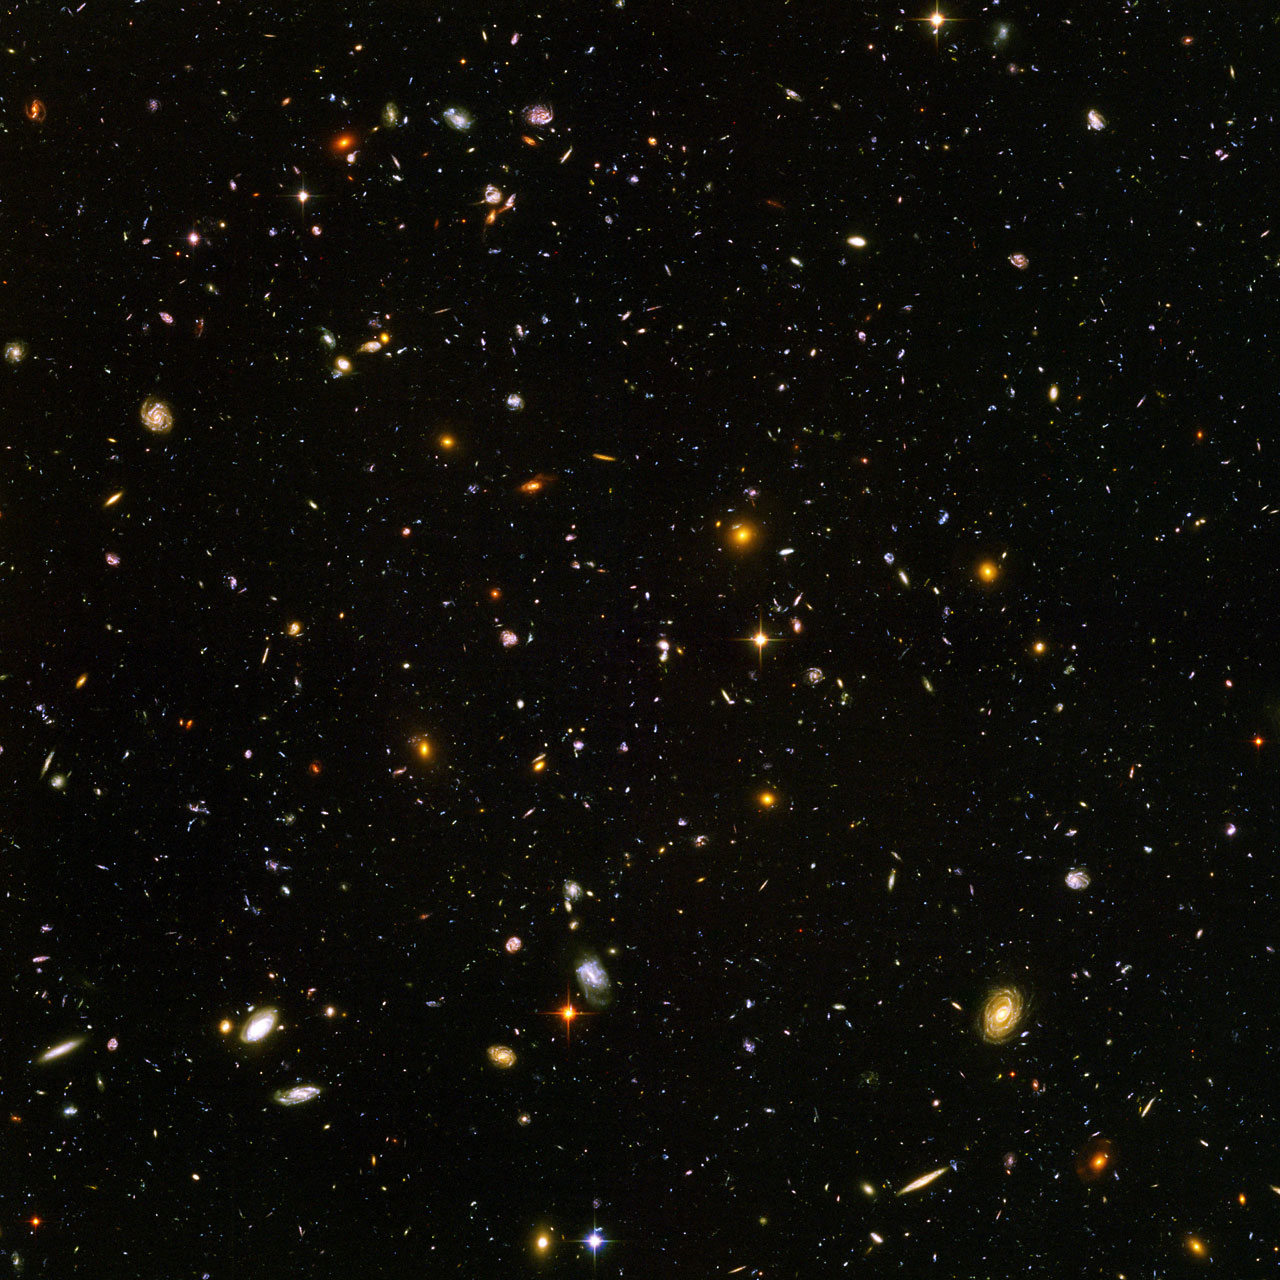
One technique for studying galaxies that astronomers have been using with modern, space-based observatories is to take deep fields. The longer you leave the shutter of your camera open while pointing at a particular part of the sky, the fainter the objects you will be able to see. In astronomical jargon, the fainter the faintest object in your image is, the "deeper" the image. In 1996, Hubble released the "Hubble Deep Field," which was a revolutionary image in its day. It is reproduced below.

If you look closely, the few objects with spikes on them (a white one near the lower left and a yellow one on the center-left) are stars in the Milky Way Galaxy, but every other object in this image is a distant galaxy. Thus, by taking a deep field, astronomers are presented with an excellent representative sample of the types of galaxies in the universe. We will return to the Hubble Deep Field for Lab 3.
For the most part, all of the galaxies that we observe locally, and that we find in deep fields, are normal galaxies. They contain billions of stars, clouds of gas, and dust. When we take a spectrum of the integrated light from the entire galaxy, it looks like the sum of the light from a large group of stars. Remember, stars have spectra that are very similar to blackbodies, but with absorption lines. So, for the most part, a galaxy's spectrum looks like a blackbody spectrum, but also with a lot of absorption lines.
Try this!
See for yourself the spectra of galaxies. The Sloan Digital Sky Survey has measured the spectra for many galaxies. In the window of data on each SDSS object, click on the thumbnail image of the spectrum in the lower left to bring up a full sized image of the spectrum.
- Bring up the SDSS Object Explorer for Object ID 587722982271090881 [45].
- Bring up the SDSS Object Explorer for Object ID 588015507682230507 [46].
- Bring up the SDSS Object Explorer for Object ID 587731513690095801 [47].
At the same time that astronomers were spending much of their time studying galaxies and classifying them, several astronomers were finding peculiar objects unlike many of the other galaxies. One type of peculiar galaxy, identified by astronomer Carl Seyfert, had the following properties that were unique compared to the average galaxy:
- The total luminosity of the galaxy is much larger (perhaps 1,000 times larger) than a normal galaxy.
- The spectrum of the galaxy is very different from a typical galaxy; it gives off more light at all wavelengths than a normal galaxy does, and there are many bright emission lines in its spectrum.
The extra luminosity from these “Seyfert Galaxies” comes almost entirely from the nuclear region of the galaxy, not from all areas of the galaxy equally. In general, any galaxy that shows evidence for a source of radiation that is not being created by stars is called an active galaxy. Because the non-stellar light from these galaxies is concentrated in the nucleus, they are usually called Active Galactic Nuclei or just AGN. Below is a sample image of a Seyfert galaxy, and it is a particularly nice example where it is quite obvious how much brighter the bulge region is compared to some of the other spiral galaxies you have seen previously.

AGN are bright radio and x-ray sources. In particular, in the radio, the galaxies show narrow jets of plasma being ejected out of the galaxy at high speeds, which end in extremely large lobes of bright radio emission. Remember, in the optical, the extent of the Milky Way is something like 30,000 parsecs in diameter. In general, the distance from lobe to lobe in a radio galaxy can be several hundred thousand parsecs, and the two largest are 4 million and 6 million parsecs from lobe to lobe! The National Radio Astronomy Observatory has spent more than 50 years studying AGN and has a large archive of images from their observations of these objects. For example, see:
There are many different types of galaxies that are called AGN, but broadly speaking, astronomers have separated them into three main classes with the following properties:
- Seyfert Galaxies:
- These appear superficially to be normal spiral galaxies.
- One clue to how they differ from normal galaxies is that the "extra" luminosity from Seyferts appears to come from an extremely bright core.
- In some cases, the core of a Seyfert galaxy is brighter than the entire Milky Way.
- Seyfert galaxies are particularly bright in the infrared, and this is likely due to dust surrounding the core.
- The light from the core of a Seyfert can vary on a very short timescale, which suggests that the energy emitting region is less than 1 light-year across.
- Radio Galaxies:
- Radio galaxies are often found to be associated with elliptical galaxies, but not always normal elliptical galaxies. Instead, radio galaxies tend to be associated with "disturbed" ellipticals like Centaurus A [52].
- Much of the nonstellar radiation from these objects is in the radio part of the spectrum. Also, the morphology of the radio emission isn't always just a point source, instead, we often see a core, jet, lobe structure.
- In other wavelengths (X-ray, for example), the core of the radio galaxy stands out as a bright point source.
- The total energy output of these objects is roughly 1,000 times larger than the Milky Way, making them some of the brightest single objects in the universe.
- Quasars:
- In the optical part of the spectrum, Quasars look like bright, blue stars. The name Quasar stands for "Quasi-stellar radio source," because they look like stars, but are in many ways unlike stars.
- They are bright in the optical, x-ray, and radio portions of the spectrum, and the brightest of these objects is 100,000 times brighter than the Milky Way.
Try this!
See for yourself the spectra of active galaxies (AGN). The Sloan Digital Sky Survey had as one of its major science goals the discovery and study of a large number of quasars. Identical to the data on the normal galaxies, in the window of data on each SDSS object, click on the thumbnail image of the spectrum in the lower left to bring up a full sized image of the spectrum.
- Bring up the SDSS Object Explorer for Object ID 587725074457821263. [53]
- Bring up the SDSS Object Explorer for Object ID 587725074995019808. [54]
How do these spectra appear? How are they similar to each other? How do they differ from the galaxy spectra you studied above?
If you want to explore more objects beyond the few listed here, you can bring up all of the SDSS objects from a single observation with the Plate Explorer [55].
A question that astronomers asked, and a question you should be asking yourself now, is: What is the source of the difference between normal galaxies and active galaxies?
To answer this question, we need to return briefly to the topic of black holes. When a massive star creates a black hole, the mass of the black hole is a fraction of the mass of the star's core. We think that stellar black holes have masses of about 3 times the mass of the Sun. In the core of the Milky Way, we have found that the central black hole is several million solar masses. We think that supermassive black holes (SMBHs) like Sgr A* in the Milky Way are common in the cores of galaxies, and we are able to theorize what happens when a star or other object gets too close to the SMBH.
When matter gets close to a SMBH, it will swirl around the SMBH, and we expect this to create a disk of material around the SMBH. This is exactly analogous to the accretion disks we considered when we studied binary star systems. We believe that in many ways they look similar. As shown below, the material in this disk falls into, or accretes onto, the SMBH. As the material swirls closer and closer to the SMBH, it speeds up. Friction among the particles in the disk causes the gas to heat up, and it can reach temperatures of millions of kelvin. These disks full of hot, fast moving gas emit radiation, and the amount is large enough to power quasars and other AGN.

The jets that we see in radio galaxies and quasars are likely to come from the disk, too, but these are not well understood at all. It is thought that the disk helps to “focus” the jets (see the image above for an example), but the exact mechanism of the creation of the jet and how it stays so narrow over such large distances (a few hundred thousand parsecs) is a topic of ongoing research.
The Milky Way has an SMBH in its core, but the Milky Way is not an AGN. So, clearly, just the presence of an SMBH alone cannot be the only requirement for the creation of an AGN. The answer to this again rests with the accretion disk. The accretion disk fuels the central power source in AGN, and if there is no fuel or not enough fuel, then the galaxy will not be seen as an AGN. When we look at AGN in detail, it appears that many of them appear to show evidence for the host galaxy absorbing another galaxy. This act of galaxies merging with each other can funnel gas into the core, providing ample fuel to power the SMBH. This idea does imply that AGN will "shut off" over time as they run out of fuel. In 2016, Penn State astronomer Jessie Runnoe and her collaborators discovered a quasar [57] that appears to have run out of fuel in between observations!
Where do Galaxies Live?
Additional reading from www.astronomynotes.com [1]
- Clusters of Galaxies [58]
When we studied stars, we discovered that they were found in specific groupings that you might see as analogous to how people populate communities on Earth. For example, we see star clusters, which are in some ways like "cities" filled with about half a million stars. We also find stars in groupings of billions of stars inside of galaxies, so you might consider galaxies to be similar to "countries" of stars, although no country on Earth has 100 billion people!
Now that we are studying galaxies, we can use observations of the environment around the Milky Way to inform us of the types of communities in which galaxies are found.
The Local Group
If we survey the local universe around the Milky Way, we find that there are a few dozen galaxies in our neighborhood. More specifically, we define our “group” to include those galaxies that we believe to be mutually bound to each other by the force of gravity. Collectively, we refer to this group of galaxies that includes the Milky Way as the Local Group of galaxies. The Local Group contains only a few large galaxies, all of which are spiral galaxies. These are the Milky Way, Andromeda (M31) and M33, which is also called the Triangulum Galaxy.
Most of the rest of the Local Group members are different types of dwarf galaxies. There are irregular galaxies, like the Large Magellanic Cloud (LMC) and Small Magellanic Cloud (SMC), there are dwarf elliptical galaxies like M32, which is a satellite of Andromeda, and there are dwarf spheroidal galaxies like Sculptor, Fornax, and Ursa Minor (named after the constellations in which they are found). For the most part, though, these objects are all much smaller and less massive than the Milky Way and Andromeda. If we compare the galaxies by their luminosities, for example, the Large Magellanic Cloud is about 1/10th as bright as the Milky Way, which suggests that it has about 10% of the mass of the Milky Way. Some of the smallest dwarf spheroidal galaxies in the Local Group are as faint as 1/50,000th the brightness of the Milky Way. Therefore, even though the dwarf galaxies are dominant in number in the Local Group, the three spirals dominate the mass of the Local Group. This is common in most environments. There are a range of galaxy sizes and masses, and there are fewer of the most massive galaxies and many more of the dwarf galaxies.
The galaxies of the Local Group are distributed within a volume of about 1 Megaparsec (Mpc) in radius. The volume of a sphere with a radius of 1 Mpc is about 4 cubic Mpc. This means that there are about 10 galaxies per cubic Mpc in the Local Group.
If you move outward from the Local Group, you encounter several other groups that are superficially similar to our own. M81 and M82 are two of the largest members of their group about 4 Mpc away from us, which also includes a total of about two dozen known galaxies. Centaurus A is a member of the M83 group, which is about 5 Mpc away. The Local Group, the M81 group, and the M83 group are examples of what are generally called “loose groups,” which are just what they sound like: bound groups of galaxies that are not very densely packed together.
You have already seen images of the Milky Way Galaxy from the Digital Universe Atlas, where the disk of the Milky Way was represented as a flat image, and the dark matter halo of the Milky Way was represented with a wire frame sphere. Below is a short movie, captured from the Digital Universe Atlas, showing the point of view of an observer flying around the Milky Way. The green dots that you see represent the 3D positions of the galaxies in the Local Group. In this view, you see primarily the satellites of the Milky Way (e.g., Fornax, Leo I, Leo II, Sculptor) because Andromeda, M33, and their satellites are more distant (in fact, they are the dense group of green dots you see at the edge of the field of view of the movie).
Try this with Starry Night!
For much of this unit, we are studying objects that we simply are unable to see by casually observing the night sky with the unaided eye. However, there is one prominent exception. If you happen to live in or visit the southern hemisphere, you can see two Local Group galaxies without a telescope. The Large and Small Magellanic Clouds are visible as faint, fuzzy patches of sky distinctly separate from the plane of the Milky Way. If you use Starry Night to change your location to Sydney, Australia, you should be able to find the Clouds in the night sky.

The Virgo Cluster
About 17 Mpc away from the Milky Way Galaxy is a much larger group of galaxies. This group is found inside of the constellation Virgo, and it is usually called the Virgo Cluster. The Virgo Cluster is not much larger than the Local Group (about 3 Mpc in radius), but it contains approximately 2,500 galaxies. If you calculate the volume of a sphere 3 Mpc in radius, you will find that there are only about 25 galaxies per cubic Mpc in Virgo. However, like the stars in a globular cluster, the galaxies inside the Virgo Cluster are very densely packed in the inner region of the cluster, and the density drops off as you get farther from the center. So, the conditions in the core of the Virgo Cluster are very different from those in the Local Group. Actually, clusters show a range of central concentrations, and Virgo is a pretty bad example to use here, since it is one of the least concentrated of galaxy clusters.
The galaxy M87 is the dominant member of the Virgo Cluster. It is a large, massive elliptical galaxy and it also harbors an AGN that is creating a powerful jet and lobes of radio emission. If you take a look at the wide-field image of the Virgo Cluster above, you will notice that M87 is very easy to pick out by eye. It is very obviously the largest galaxy in the image. Many clusters contain a dominant, giant elliptical galaxy, and these are called “cD” galaxies. In general, the types of galaxies found in clusters are different from the types found in groups. Clusters tend to contain a higher percentage of ellipticals, while the lowest density environments tend to contain more spirals.
Clusters like Virgo are enormous objects. If you consider that these gravitationally bound groups contain usually about 1,000 or more galaxies, that means their mass is about 1015 solar masses! They are considered to be the largest gravitationally bound objects in the universe.
By studying the velocities of galaxies inside of clusters like Virgo, we also find that galaxy clusters must contain dark matter (over and above what is in the galaxies themselves). X-ray observations of galaxy clusters show that they contain a large amount of very hot (millions of kelvin) gas, but even adding the mass of this gas to the mass in the visible galaxies cannot account for all of the mass needed to keep these clusters gravitationally bound.
In the neighborhood around the Milky Way, the local Universe contains a few small groups of galaxies and a cluster. As we continue to survey out from the Milky Way, we find that these types of structures are common throughout the Universe. Single galaxies are not found in complete isolation, without any companions in their neighborhood.
Galaxy Interactions
Additional reading from www.astronomynotes.com [1]
Remember from our lesson on stars in the Milky Way, that, on average, inside of a galaxy, the stars are separated by vast distances. However, on average, in the universe, galaxies are only separated by about 20 times the size of the diameter of the average galaxy. In all galaxy environments, we see examples of galaxies apparently in the process of interacting with each other. In fact, if you look back closely at all the images of galaxies that you have seen so far (the Hubble Deep Field, images of the Virgo Cluster, etc.), I am sure that you can pick out examples of galaxies that appear to be right on top of each other.
So, what happens when galaxies do encounter each other? There are a few quantities that control the interaction:
- The mass ratio of the galaxies: Are their masses nearly equal, or is one much more massive than the other?
- The relative velocity of the galaxies: Are they zooming past each other, or are they slowly passing by each other?
- How close is it to a direct hit?: Are the galaxies going to pass right through each other, or just pass close to each other?
In general, there are three different types of interactions that fall into the following rough categories:
Major mergers
When two nearly equal mass galaxies with small relative velocities pass very close to each other, or even right through each other, a major merger occurs. If the galaxies are moving too fast relative to each other, a major merger is unlikely to occur, because the collision will not slow the galaxies down enough. For this reason, major mergers do not often occur in the cores of galaxy clusters. Instead, we find that they occur in loose groups (e.g., the Milky Way and Andromeda appear to be on a path to collide several billion years from now), compact groups, and in the lower density outskirts of galaxy clusters.
If you look at images of the most well-known example, NGC 4038 and NGC 4039—the Antennae Galaxies—you will get a sense for what happens in one of these collisions.

We estimate that the complete process of an interaction between two galaxies takes about half a billion years. For this reason, when we see an example of two interacting galaxies (like the Antennae Galaxies), we are only seeing a snapshot of one stage of the evolution of the interaction. In order to get an understanding of the entire process of the interaction between two galaxies, astronomers have used computer models to simulate what happens when two realistic representations of galaxies collide.
Watch this!
Watch this movie of a computer simulation of the interacting galaxies known as the "Mice." [64]
Next, watch this movie of a computer simulation of two interacting spiral galaxies [65] seen from different points of view.
- How do the disks of the spiral galaxies respond to the collision?
- What is the primary cause of the different appearances of interacting galaxies undergoing major mergers?
- What does the end product of the major merger appear to be?
To explain the physics of the Mice movie, what you saw were two spiral galaxies approaching each other. Recall that we believe that both of these galaxies are enclosed in large halos of dark matter. When their dark matter halos collide, this produces drag, slowing the galaxies down and altering their paths so that the cores of the two galaxies spiral ever closer to each other and eventually merge. This drag is referred to as dynamical friction.
Another effect that you see in the simulation is that when the disks first interact, the shape of the galaxies is altered. What is happening is similar to the interaction between the Earth and the Moon. The stars in both galaxies feel a tidal gravitational force from the other galaxy. The outermost stars in these galaxies feel the weakest gravitational pull from the center of their parent galaxies, so they get pulled out of their parent galaxy by this tidal force and spray out into long tails that are larger than the original galaxies themselves. What is happening is that the energy that the galaxies had as they moved through space has been converted into kinetic energy of the stars in the galaxies. These stars get a “kick” to a higher velocity, which puts them on an orbit that takes them much farther from the center of the galaxy than their original orbit.
As the interaction proceeds, the cores of the two galaxies eventually merge into a single galaxy, which appears to be very similar to an elliptical galaxy. Most of the stars in the tidal tails eventually fall back into this new galaxy, while some of the debris drifts away into intergalactic space. Although it appears that elliptical galaxies can be made by the merger of two or more spiral galaxies, it is still unclear what percentage of all elliptical galaxies are formed this way.
One very interesting point to note about these collisions between galaxies is that no stars actually collide! Although the process of a galaxy collision rearranges the stars into new structures (first tidal tails and eventually into an elliptical galaxy), because the space between stars is so large, it is extremely unlikely that even one single star had a direct collision with another star during this process.
During the interaction/merger process, however, the gas clouds in the disks of the two galaxies get compressed by the tidal forces of the interaction. If you recall our study of star formation, stars form out of gas clouds that get compressed by some external force. In galaxy collisions, most of the gas in the two galaxies gets compressed all at once, which can trigger huge bursts of star formation simultaneously. For example, look at the image of the Antennae Galaxies again.
All of the bright blue areas in the image on the right (taken by Hubble) are huge clumps of new stars formed within the past 10 million years or so. We call galaxies that are undergoing a massive amount of star formation Starburst Galaxies, and it appears that most starbursts are caused by galaxy interactions.
Want to learn more?
Major mergers between two galaxies is a topic we could explore in significantly more depth than we have the space to do here. If you wish to explore the topic in more depth on your own, you can choose any or all of the following topics and resources:
- A description of the possible collision between the Milky Way and Andromeda [66], and an animation of how that might appear. [67]
- A Hubblesite Image Tour of the Tadpole Galaxy [68].
- Astronomer Chris Mihos' Simulations of interacting galaxies. [69]
- Mihos' "Galaxy Crash [70]"
Galaxy Cannibalism
When a massive galaxy has smaller satellite galaxies orbiting it, the massive central galaxy can disrupt and then absorb the stars from its smaller companions. Many of the satellite galaxies in orbit around the Milky Way and Andromeda in the Local Group appear to be undergoing this process to one degree or another. We find, for example, that as the Sagittarius dwarf galaxy has orbited the Milky Way, the tidal force from the Milky Way has pulled out long debris trails from Sagittarius that completely encircle the Milky Way. Over time, the stars that originated in the Sagittarius dwarf are being absorbed into our Galaxy's halo, and eventually, it will be almost impossible to distinguish halo stars from Sagittarius stars. Astronomers have traced the stars from this dwarf galaxy completely encircling the disk of the Milky Way, as shown in the following visualization.
As mentioned above, the mass ratio between the two galaxies influences the interaction. In this case, the massive galaxy is not affected very much, even though the satellite galaxies may be completely destroyed in this process. In recent years, we have found examples of the debris from these types of galactic cannibalism events (e.g., the stars that were pulled out of the dwarf galaxy during the disruption) around more distant galaxies. By coincidence, in the same image as the Tadpole major merger (and visible in the image tour), Hubble appears to have caught evidence of the ongoing disruption of a dwarf galaxy by a massive spiral galaxy.

Want to learn more?
I have also been involved in the search for, and discovery of, the ongoing galactic cannibalism of dwarf galaxies by their parent spiral galaxies. There are two other excellent examples of this process published by me and my colleagues:
There is another environment where Galactic Cannibalism takes place, and that is the center of galaxy clusters. Most galaxy clusters have giant ellipticals, which we call cD galaxies, in their cores (for example, remember M87 in Virgo). Look at the following image of the cD galaxy in the core of cluster Abell 3827.

Inside the boundaries of this giant elliptical are what appear to be six distinct clumps. These are presumably the remnants of six massive galaxies (probably the size of the Milky Way) that are being cannibalized by the cD galaxy. If you look, there are at least four others near this galaxy that look like they may be next. It appears that the origin of the cD galaxies inside of galaxy clusters is a direct result of Galactic Cannibalism. These objects probably started out as normal ellipticals, but again, the process of dynamical friction caused the nearby galaxies to slow down as they pass the proto-cD galaxy and eventually spiral in and get consumed. As the cD galaxy grows more massive, the magnitude of the dynamical friction effect on nearby galaxies grows, allowing it to continue to consume more and more of the galaxies in the core of the cluster.
Galaxy Harassment
The relative velocity between galaxies plays a very important role in galaxy interactions. If two galaxies are moving too fast with respect to each other, the strength of the dynamical friction between them will not be large enough to slow them down and cause them to merge. The question is: Do these galaxies remain completely unchanged or do they experience some changes as they have a “near miss” collision? Inside of galaxy clusters, spiral galaxies should experience multiple weak encounters as they pass by many of the other galaxies in the cluster with large relative velocities. Although we do not expect each of these weak encounters to produce dramatic tidal tails, bursts of star formation, and eventual mergers, the galaxies are not unaffected. Each minor encounter is likely to alter the shape of the spiral galaxy and to strip off some of its outer, weakly bound stars. This process is called Galaxy Harassment, and the effect that it has on the galaxies is also known as “tidal truncation” because the galaxies should slowly shrink as they lose more and more stars.
Remember that clusters like the Virgo cluster are known to contain a much higher percentage of elliptical galaxies than we find in poor groups. We think that the reason for this is that the spiral galaxies are altered by processes inside the cluster. It is likely that some combination of major mergers in the outskirts of the cluster and galaxy harassment in the inner regions causes the spirals to become elliptical galaxies. The Galaxy Harassment model also predicts that there should be a population of stars floating around inside of the cluster, unattached to any particular galaxy. Recently, astronomers have identified both red giant stars and planetary nebulae in the Virgo Cluster that are not associated with any one galaxy. These “intracluster stars” appear to be those predicted by the models of Galaxy Harassment.
Want to learn more?
Although there are no nice images of this particular set of stars, you can read more about the project at Hubblesite: Discovery of Stars in Virgo Cluster. [76]
Galaxy Formation and Evolution
Additional reading from www.astronomynotes.com [1]
- Galaxy Origins [77]
Since Hubble's work on galaxies in the 1920s, astronomers have continued to observe more and more galaxies at larger and larger distances from us. The goal of much of this work has been to determine the mechanism by which galaxies form and how they evolve. For example, one of the major undertakings of the astronomical community in recent years has been the Sloan Digital Sky Survey. If you read the "The SDSS Science Legacy, [78]" they say that their team was responsible for:
Systematic characterization of the galaxy population: By providing high quality images, distances, and stellar masses and ages of hundreds of thousands of galaxies, the SDSS transformed the study of galaxy properties and the correlations among them into a precise statistical science, yielding powerful insights into the physical processes that govern galaxy formation.
When we studied stars, we saw that using star clusters, which contain stars in various stages of evolution but all of the same age, astronomers were able to construct and verify a model for the evolution of stars. In order to do the same for galaxies, you would like the same set of information. You would like to find galaxies of different ages so we can see how galaxies change over time. We can certainly use our own Milky Way and the Local Group galaxies as examples of old galaxies, but we need a sample of young galaxies for comparison. To find young galaxies, what we need to do is identify very distant galaxies. The reason distant galaxies = young galaxies is the finite speed of light. If you observe an object 1 million light years away, you are not seeing it as it is today. The light you see today left the object 1 million years ago. This phenomenon is called the lookback time. So, if you want to find a galaxy 5 billion years younger than the Milky Way, you should search for galaxies 5 billion light years away. Then, you can compare those galaxies to the ones you find 10 billion light years away, because those will appear as they were 10 billion years ago.
The phenomenon of lookback time is crucial to the study of galaxy formation and evolution. We can directly observe how galaxies appeared when they were forming if we can find galaxies at very large lookback times. In recent years, astronomers have been using the technique of observing deep fields (like the Hubble Deep Field you've seen previously, and more recently, the Hubble Ultra Deep Field [79]) to pursue the most distant galaxies in the universe. The question that these deep fields have helped answer is: “How did galaxies look billions of years ago?” The answer appears to be that when galaxies were young, they looked very irregular. Galaxies with spiral arms like the Milky Way did not appear until about 10 billion years ago. We think that galaxies apparently formed from the bottom up; that is, more than 10 billion years ago, small, irregularly shaped sub-galaxies appear to have collided and merged, leading to the formation of the large spiral and barred spiral galaxies that we see today. Although the Milky Way continues to form new stars today, the star formation rates in these subgalaxies were much higher. Observations suggest that the peak of star formation occurred about 8 billion years ago. Below is an image of several very distant, and therefore very young, galaxies observed in the Hubble Ultra Deep Field. Compare these to the images of nearby galaxies that you have seen previously.

By comparing local galaxies to distant galaxies and supplementing these observations with numerical simulations of the early universe, astronomers believe that galaxies form in roughly the following way:
- The first objects are sub-galaxy sized "pieces."
- Several of these pieces coalesce to form a larger mass object.
- The gas in the larger galaxy can collapse, increasing the rotation speed of the galaxy.
- Stars will rapidly form inside this disk, and their orbits will sort into the familiar spiral structure.
- Disk galaxies will continue to evolve by the various interaction processes we saw previously, and major mergers will create elliptical galaxies.
In this general prescription for the evolution of galaxies, we did not fit AGN into the scenario. The AGN phase appears to be a short phase in the overall lifetime of a galaxy, and it occurs when the SMBH in the core of that galaxy has enough fuel to power the enormous luminosities these objects emit. Again, using lookback time, we see that quasars are most numerous about 10 billion years ago. So, the quasar phase appears to be an early phase that perhaps most galaxies went through before settling down as normal galaxies.
The Distance Ladder
Additional reading from www.astronomynotes.com [1]
Now that we have a reasonable understanding of the formation, evolution, and properties of galaxies, we can begin to use them as tracers of the properties of the entire Universe. If we consider again the historical context, scientists like Einstein, Hubble, and others were pursuing these types of questions during the early part of the 20th century. One of the breakthroughs that we will study in the next lesson is Hubble's Law. The foundation of that discovery was the accurate measurement of the distances to large numbers of galaxies. So, to transition from this lesson to the next one, we will consider in some detail the "distance ladder" for determining the distances to ever farther galaxies. Astronomers use the analogy to a ladder, because each type of distance measurement relies on the previous one to move you further and further from the Earth.
First, let's review the first few "rungs" of the distance ladder:
- Trigonometric parallax: By measuring the apparent motion of nearby stars against the background, we can directly calculate their distances. This technique has been used to measure the distances to many nearby stars and star clusters out to approximately 100 parsecs from the Earth.
- Spectroscopic parallax: Using the flux / luminosity / distance relationship, we can calculate the distance to any star with a known luminosity if we measure its flux on Earth.
By comparing just these first two steps, you can already see how the ladder analogy comes into play. In order to use step 2, you need to know the luminosity of a comparison object. How do we know the luminosities for comparison objects? Well, we can measure the distances to a sample of comparison objects (e.g., O stars) using trigonometric parallax, measure their fluxes, and then calculate their luminosities since we have 2 out of the 3 quantities in the flux / luminosity / distance relationship equation.
So far, we have talked about measuring distances to single stars because we can estimate their luminosities based on their positions in the HR diagram. Then, we considered variable stars. They are useful because the period of their variability is directly related to their luminosity. So, we can measure their luminosities very easily. Using observations of Cepheid variable stars from, for example, the Hubble Space Telescope, we can calculate the distances to galaxies approximately 20 million parsecs (20 Mpc) from Earth.
Cepheid variable stars are one of the most useful objects for measuring distances, and are called standard candles. Any object that is considered a standard candle has the following properties:
- Easy to identify. That is, it is not easily confused with the many other objects in the sky.
- Has a known luminosity that is almost constant from object to object to object.
- Is very bright, so it is easily visible even at large distances.
In practice, the best standard candles have some easily measurable property that is directly related to their luminosity, just like in Cepheid variables where the period of the variability is directly proportional to the luminosity. Some other examples of standard candles are:
- Type I Supernovae
- Spiral Galaxies with measured rotation speeds (The Tully-Fisher Relation relates the rotation speed to the luminosity for these objects).
Let's consider the Tully-Fisher Relation briefly. Recall that the orbital speeds of objects are directly related to the sum of the masses of the orbiting objects by way of Newton's version of Kepler's third law. So, if you increase the mass of a galaxy, the rotation speeds of stars in that galaxy will increase, too. So, faster rotating galaxies must be more massive. More massive galaxies are also more luminous, because they contain more stars. So, if you can measure a galaxy's rotation curve (which you can do for some galaxies using the Doppler shifted lines in their spectra), you can estimate with some accuracy that galaxy's luminosity. Then, if you measure its flux, you can calculate its distance, just like we do for stars.
In order to determine the luminosity of a new potential standard candle (say, Type I supernovae), we have to measure the distance to a few of them first using some other technique. We calibrate new standard candles using distances measured to them with old standard candles. For example, if you have a single galaxy with a distance measured by the presence of Cepheid variables in it, and that galaxy has a Type Ia supernova go off, you can calibrate the luminosity of that Type Ia supernova by measuring its flux and using the Cepheid variable distance to its host galaxy. Type Ia supernovae and entire spiral galaxies are brighter than Cepheid variables, so they extend our capability to measure distances out to billions of parsecs.
Because there is always going to be some error associated with a distance measurement, the errors get larger and larger as we get higher and higher up the distance ladder. Given this set of techniques, though, we can measure distances to most galaxies.
Additional Resources
Below are some resources related to the galaxies beyond the Milky Way:
- The Fermi Gamma-ray Space Telescope has produced an "Active Galaxy Education Unit [82]."
- The Galaxy Evolution Explorer (that is, GALEX) has a few activities for teachers [83].
- You and your students can contribute to a project to classify galaxies from the Sloan Digital Sky Survey with Galaxy Zoo [84]. This has been incorporated into a newer resource from the SDSS team called Voyages [85], and there is a Voyages activity on galaxy shapes [86].
- Phil Plait's Crash Course Astronomy has "Galaxies, Part 1 [87]" and "Galaxies, Part 2 [88]".
Summary
We are now nearing the edge of the observable Universe. From our start, considering the sky seen from Earth, we have progressed through the Milky Way, to the local galaxy neighborhood, and have seen some of the most distant galaxies astronomers have detected. You now have been introduced to almost every type of object astronomers have identified. The next goal is to try to explain where it all came from, and what may be its fate.
Activity 1 - Lesson 9 Quiz
Directions
First, please take the Web-based Lesson 9 quiz.
- Go to Canvas.
- Go to the "Lesson 9 Quiz" and complete the quiz.
Good luck!
Activity 2 - Lab 3
Directions
During this week, you should begin work on the lab exercise that will be completed and submitted by the end of Unit 3.
- In the Course Outline box underneath Lesson 9, click on "Lab 3 Part 1."
- Follow the instructions to study the Hubble Deep Field.
Reminder - Complete all of the lesson tasks!
You have finished the reading for Lesson 9. Double-check the list of requirements on the Lesson 9 Overview page to make sure you have completed all of the activities listed there before beginning the next lesson.
Lab 3
Lab 3: The Hubble Ultra Deep Field
Used with permission from "Engaging in Astronomical Inquiry," by Stephanie Slater, Timothy Slater, and Daniel Lyons. Copyright W.H. Freeman and Company, New York, 2010.
Background
It is difficult to overestimate the impact that the Hubble Deep Field (HDF) image had on astronomy in the mid-1990s. Although astronomers had undertaken observations with similar goals prior to the release of the HDF, when it was new, it provided a wealth of data on galaxies that allowed astronomers to address a number of unsolved questions about the galaxies in the Universe. The later Hubble Space Telescope image known as the “Hubble Ultra Deep Field” reveals a variety of previously unknown objects in the very distant universe that can be systematically and scientifically counted, organized, and classified.
NOTE: If you are taking the course for credit, complete the open-ended responses within the 'Lab 3' Module link in Canvas.
Computer Setup and/or Materials Needed:
a) Access the Hubble Ultra Deep Field Image [89].
b) Access the SkyWalker website [90].
Note: There is no expectation that students have studied galaxies prior to completing this research project.
Phase I: Exploration
1) Access the online Hubble Ultra Deep Field Image [89]. You might be able to make it larger and smaller by “left clicking” on the image with your mouse. Most of these objects are galaxies far, far from Earth. However, a few objects are nearby stars, as indicated by “four points” on the image, as displayed in the image below.
 How many stars can you find?
2) Again, most of the objects in the Hubble Ultra Deep Field image are not individual stars, but actually distant galaxies—isolated collections of millions or billions of stars that look like a tiny dot or cloud. Determine how many galaxies are found in the image. Since counting each galaxy is not practical, one strategy for estimating the total number is to precisely count the number of galaxies in one small section of the image, then multiply the result by the appropriate number so that we have an estimate for the number of galaxies in the whole image. For example, if we counted the number of galaxies in 1/4 of the image, then we would multiply the result by 4 to find the approximate number of galaxies in the entire image (note that even this is impractical, as 1/4 of the image still contains too many galaxies to count one by one). Keep in mind, every point of light that is not a star that you identified above is indeed a galaxy... even the smallest dots!
What is the total number of galaxies in this image?
3) a. Some of the galaxies are orange-red in color, while others are white and still others are blue. What is the most common color of galaxy in the image? b. Precisely explain how you determined this, not just “I looked and saw more of this color.” A precise explanation should enable someone to repeat your process and (hopefully) obtain the same results.
4) a. If we assume that all of the galaxies in this image have the same diameter, then the ones that are close appear larger and the ones that are more distant appear smaller. Are most of the galaxies in this image relatively near or relatively far? b. What is your evidence?
Phase II: Does the Evidence Match a Given Conclusion
5) Access the interactive Ultra Hubble Deep Field site through the SkyWalker website [90].
The green circle in the top left hand corner is a sort of “magnifying glass” that you can drag around that will let you look at close up portions of the Hubble Ultra Deep Field. Note that the picture is about 8 green circles wide and 10 green circles tall, for a total of about 80 green circles over the whole image.
Make rough sketches of the five closest galaxies you can find in the image, concentrating on the galaxy itself and not any background galaxies in the circle.

6) a. Consider the research question,"What is the most common type of nearby galaxy?" If a fellow student proposed a generalization that "nearby galaxies are equally split between round, featureless galaxies and elongated, spiral shaped galaxies," would you agree or disagree with this generalization based on the evidence you collected above on the shapes of nearby galaxies? This is not your opinion. It can be read as: "Would you draw the same conclusion?" b. State specific evidence you will use. c. Explain your reasoning which should cite the evidence previously stated.
Phase III: What conclusions can you draw from this evidence?
The Hubble Ultra Deep Field is one of the most important images in astronomy because it shows some of the most distant galaxies in the universe. What conclusions and generalizations can you make from the following data collected by a student by randomly positioning the green circle in an effort to answer the question, "What is the general distribution of galaxy colors?" Explain your reasoning and provide the specific evidence you are using, with sketches or pie charts or graphs if necessary, to support your reasoning.
|
Green Circle Sample Number |
Number of Red-Orange Galaxies |
Number of Blue-White Galaxies |
|
1 |
7 |
27 |
|
2 |
10 |
16 |
|
3 |
15 |
19 |
|
4 |
10 |
29 |
|
5 |
12 |
27 |
Data collected at UDF SkyWalker V1.0 [90]
Phase IV: What evidence do you need to pursue?
Imagine your team has been assigned the task of writing a news brief for your favorite news blog about the differences between the numbers of nearby and extremely distant galaxies in the universe. Describe precisely what evidence you would need to collect, and how you would do it, in order to answer the research question of, “Are there more nearby galaxies or more extremely distant galaxies?” You do not need to actually complete the steps in the procedure you are writing.
8) Create a detailed, step-by-step description of evidence that needs to be collected and a complete explanation of how this could be done—not just “move the green circle around and look at how many big and how many small,” but exactly what would someone need to do, step- by-step, to accomplish this. You might include a table and sketches—the goal is to be precise and detailed enough that someone else could follow your procedure.
Phase V: Formulate a question, pursue evidence, and justify your conclusion
Your task is to design an answerable research question, propose a plan to pursue evidence, collect data using the interactive Ultra Hubble Deep Field site (or another suitable source pre- approved by your lab instructor), and create an evidence-based conclusion about the characteristics of galaxies in our universe that we have not previously addressed.
Specific Research Question:
Step-by-Step Procedure to Collect Evidence:
Data Table and/or Results:
Evidence-based Conclusion Statement:
Phase VI: Summary
Create a 50-word summary, in your own words, that describes the characteristics and distribution of galaxies in our universe. You should cite specific evidence that you have collected in your description, not describe what you have learned in class or elsewhere. Feel free to create and label sketches to illustrate your response.
Submit your work in Lesson 11
This lab assignment is not due in Canvas until the due date indicated on our course calendar during Lesson 11.
Links
[1] http://www.astronomynotes.com
[2] http://www.astronomynotes.com/galaxy/s2.htm
[3] http://articles.adsabs.harvard.edu/cgi-bin/nph-iarticle_query?bibcode=1910ApJ....32...26R&db_key=AST&page_ind=10&plate_select=NO&data_type=GIF&type=SCREEN_GIF&classic=YES&high=49beb5749119894
[4] http://antwrp.gsfc.nasa.gov/diamond_jubilee/debate20.html
[5] http://apod.gsfc.nasa.gov/apod/ap960406.html
[6] http://www.aip.org/history/cosmology/index.htm
[7] http://www.aip.org/history/exhibits/cosmology/ideas/island.htm
[8] https://www.aip.org/history/exhibits/cosmology/ideas/larger-image-pages/pic-island-notebook.htm
[9] https://www.aip.org/history/exhibits/cosmology/ideas/larger-image-pages/pic-island-m31.htm
[10] http://antwrp.gsfc.nasa.gov/diamond_jubilee/1996/sandage_hubble.html
[11] https://thecosmos4.com/
[12] http://www.astronomynotes.com/galaxy/s3.htm
[13] http://www.astronomynotes.com/galaxy/s4.htm
[14] http://www.astronomynotes.com/galaxy/s5.htm
[15] http://hubblesite.org/newscenter/archive/releases/1999/34/image/o/format/large_web/
[16] http://www.spitzer.caltech.edu/uploaded_files/images/0008/1211/sig07-025_Med.jpg
[17] http://www.spitzer.caltech.edu/images/2095-sig07-025-Lifestyles-of-the-Galaxies-Next-Door
[18] http://www.spitzer.caltech.edu/uploaded_files/images/0008/1186/sig07-025.tif
[19] https://hubblesite.org/video/881/tours
[20] https://hubblesite.org/video/887/tours
[21] https://hubblesite.org/video/886/tours
[22] http://www.noao.edu/image_gallery/images/d4/m81y.jpg
[23] http://apod.gsfc.nasa.gov/apod/ap020710.html
[24] http://www.eso.org/public/images/eso9921a/
[25] https://www.noao.edu/image_gallery/images/d6/m95_2.jpg
[26] http://apod.gsfc.nasa.gov/apod/image/0304/ngc1365_vlt_big.jpg
[27] https://www.noao.edu/image_gallery/images/d6/m61.jpg
[28] https://www.noao.edu/image_gallery/images/d6/m87i.jpg
[29] http://www.ipac.caltech.edu/2mass/gallery/m49atlas.jpg
[30] http://www.noao.edu/image_gallery/images/d6/m59.jpg
[31] http://www.noao.edu/image_gallery/images/d4/m82a.jpg
[32] http://apod.gsfc.nasa.gov/apod/image/0812/LMCmosaicM_gendler.jpg
[33] https://www.noao.edu/image_gallery/galaxies.html
[34] http://hubblesite.org/gallery/album/galaxy/pr2003028a/
[35] http://www.noao.edu/outreach/aop/observers/n4565.html
[36] http://www.spitzer.caltech.edu/images/1925-ssc2008-10b-A-Roadmap-to-the-Milky-Way-Annotated-
[37] http://commons.wikimedia.org/wiki/File:Football_on_ground.jpg
[38] http://apod.gsfc.nasa.gov/apod/ap080913.html
[39] http://apod.gsfc.nasa.gov/apod/ap080124.html
[40] http://apod.gsfc.nasa.gov/apod/ap080909.html
[41] http://www.astronomynotes.com/galaxy/s12.htm
[42] http://www.astronomynotes.com/galaxy/s13.htm
[43] http://www.astronomynotes.com/galaxy/s14.htm
[44] http://hubblesite.org/newscenter/archive/releases/1996/01/text/
[45] http://cas.sdss.org/dr7/en/tools/explore/obj.asp?id=587722982271090881
[46] http://cas.sdss.org/dr7/en/tools/explore/obj.asp?id=588015507682230507
[47] http://cas.sdss.org/dr7/en/tools/explore/obj.asp?id=587731513690095801
[48] http://hubblesite.org/newscenter/archive/releases/1998/28/image/a/
[49] http://images.nrao.edu/132
[50] http://images.nrao.edu/56
[51] http://images.nrao.edu/110
[52] http://apod.gsfc.nasa.gov/apod/ap060704.html
[53] http://skyserver.sdss.org/dr7/en/tools/explore/obj.asp?id=587725074457821263
[54] http://skyserver.sdss.org/dr7/en/tools/explore/obj.asp?id=587725074995019808
[55] http://cas.sdss.org/astro/en/tools/getimg/plate.asp
[56] http://apod.gsfc.nasa.gov/apod/ap031128.html
[57] http://www.npr.org/sections/thetwo-way/2016/02/23/467826553/solving-the-mystery-of-the-disappearing-quasar
[58] http://www.astronomynotes.com/galaxy/s9.htm
[59] http://apod.gsfc.nasa.gov/apod/ap060806.html
[60] http://antwrp.gsfc.nasa.gov/apod/ap050213.html
[61] http://antwrp.gsfc.nasa.gov/apod/ap010126.html
[62] http://www.astronomynotes.com/galaxy/s10.htm#A2.9.1
[63] http://hubblesite.org/gallery/album/entire/pr1997034a/
[64] http://hubblesite.org/newscenter/archive/releases/2002/11/video/a/
[65] http://hubblesite.org/newscenter/archive/releases/2008/16/video/d/
[66] http://hubblesite.org/news_release/news/1997-34
[67] http://hubblesite.org/video/122/news_release/1997-34
[68] https://hubblesite.org/contents/media/videos/2002/11/883-Video.html
[69] http://burro.astr.cwru.edu/models/models.html
[70] https://www.youtube.com/watch?v=QcDtJ_-jdMw
[71] http://www.astro.virginia.edu/~mfs4n/sgr/
[72] http://hubblesite.org/newscenter/archive/releases/2002/11/image/a/
[73] http://apod.gsfc.nasa.gov/apod/ap080207.html
[74] http://apod.gsfc.nasa.gov/apod/ap080619.html
[75] http://apod.gsfc.nasa.gov/apod/ap980831.html
[76] https://hubblesite.org/contents/news-releases/1997/news-1997-02.html
[77] http://www.astronomynotes.com/galaxy/s10.htm
[78] http://www.sdss.org/signature.html
[79] http://hubblesite.org/newscenter/archive/releases/2004/07/
[80] http://hubblesite.org/newscenter/archive/releases/2004/07/image/i/
[81] http://www.astronomynotes.com/galaxy/s16.htm
[82] http://fermi.sonoma.edu/teachers/agn.php
[83] http://www.galex.caltech.edu/education/teachers.html
[84] http://www.galaxyzoo.org/
[85] http://voyages.sdss.org/
[86] http://voyages.sdss.org/galaxy-shapes/
[87] https://youtu.be/I82ADyJC7wE
[88] https://youtu.be/_O2sg-PGhEg
[89] http://www.spacetelescope.org/static/archives/images/screen/heic0406a.jpg
[90] http://www.aip.de/groups/galaxies/sw/udf/swudfV1.0.html