1 - Realities of Sustainability: Planet
Lesson 1 Overview
Lesson 1 Overview
Summary
In this Lesson, we begin understanding the structure and overview of modern Corporate Sustainability, primarily through standardized filings and how organizations measure sustainability. During this exploration, we specifically seek to understand more about Planet-centric metrics and messages, and how organizations use them in Corporate Sustainability Reports (CSR). As I hope will be developed throughout the course, we will begin to see how relative definitions are in sustainability, and how even seemingly similar efforts can have drastically different metrics and underpinnings.
Arguably, one of the the most valuable attributes a modern participant in Sustainability can have is the ability to discern and differentiate facets of programs in order to evaluate efficacy. We will begin that journey in this Lesson.
Learning Outcomes
By the end of this lesson, you should be able to:
- discern Planet-centric metrics and initiatives within a Corporate Sustainability Report;
- evaluate an organization's approach to Planet issues through the lens of their stated Vision, Mission and Values;
- compare established and emerging environmental standards and initiatives;
- appraise how sustainability may reduce the environmental risk profile of an organization;
- discern "badge proliferation" and marketing from meaningful third-party certifications.
Lesson Roadmap
| To Read | Chapters 1 and 2 (Keeley, et al.) Documents and assets as noted/linked in the Lesson (optional) |
|---|---|
| To Do | Case Assignment: Patagonia and REI
|
Questions?
If you have any questions, please send them to my axj153@psu.edu [1] Faculty email. I will check daily to respond. If your question is one that is relevant to the entire class, I may respond to the entire class rather than individually.
The 3Ps and Triple Bottom Line
The 3Ps and Triple Bottom Line
In its purest, most distilled form, the imperatives of sustainability are summed up by just three words: Planet. People. Profit. (Elkington, 1995).
In the practice of sustainability, the "3Ps" are widely known, and while there may be a few variations on the theme, they are almost universally agreed upon. At this level, there is no nuance or measurement or hierarchy, just the simple imperative that the role of sustainability is to simultaneously maximize benefit to:
Planet - The environment and Earth.
People - Everyone inhabiting the Earth, from domestic and offshore workers to families and children.
Profit - The financial and overall long-term viability of the organization.
This all sounds lovely, until we remember that by this same reductive logic, many daunting tasks can be made to sound downright simple:
"It's simple, Orville. All we need to do is make a machine that flies. We have an entire garage full of bicycle parts and canvas!"
What we will see is that the complexity of sustainability lies one layer beneath the elegance of Planet. People. Profit., when one is tasked with the details of how to make all three of these imperatives–which are very commonly in direct opposition–thrive within the organization. As we will address in this lesson and many throughout this course, maximizing the 3Ps involves virtually every facet and function of an organization, and is never truly complete.
But, luckily for us, the constraints, unmet needs, scarcities, and imperatives that face those seeking to improve sustainability are the essential building blocks for developing compelling product and service offerings. As we will cover in the coming lessons, the 3Ps will become a framework for how we seek to innovate.
Variations on the Theme
There are a handful of other expressions of the sustainability imperatives, the leading probably being the "Triple Bottom Line." Though they may be stated or modeled differently, below is a matrix comparing the terminology used in a few different models for sustainability:
| Model | "Planet" stated as: | "People" stated as: | "Profit" stated as: |
|---|---|---|---|
| Triple Bottom Line (Savitz adaptation of Elkington, 2006) | Society's Interests - Environmental | Society's Interests - Social | Business Interests |
| Sustainability "Sweet Spot" (Farver, 2013) | Environmental Stewardship | Social Well-being | Economic Prosperity |
| B Corporation Impact Assessment (Honeyman, 2014) | Good for the Environment | Good for Workers | Good for the Long Term |

Historical Context of Environmental Issues
Historical Context of Environmental Issues
Elkington's Pressure Waves
In order for us to fully understand the Planet imperative of sustainability, it can be helpful to consider a historical context for the environmental issues that have shaped our world. Elkington has delineated the events of the last generation into three environmental "pressure waves" of public opinion occurring from 1961-2001:
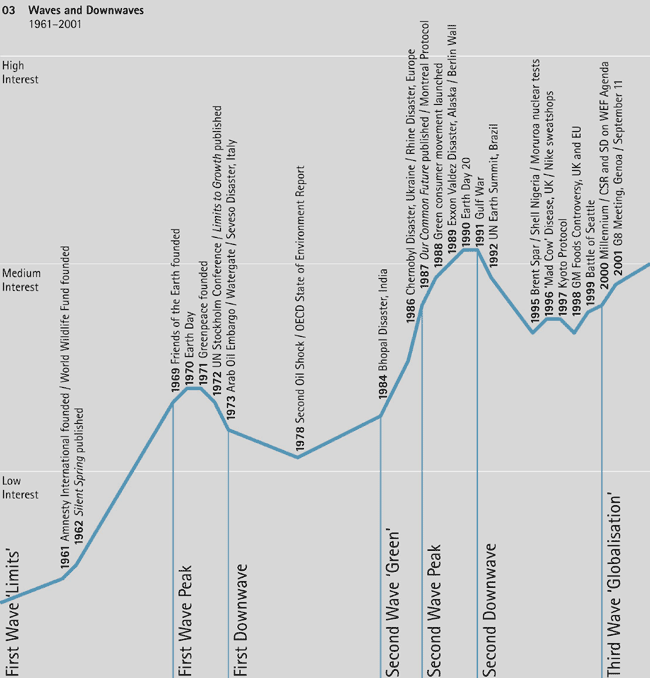
Three pressure waves
From 1960 to the present, three great waves of public pressure have shaped the environmental agenda. The roles and responsibilities of governments and the public sector have mutated in response to each of these three waves – and will continue to do so. Although each wave of activism has been followed by a downwave of falling public concern, each successive wave has significantly expanded the agendas of politics and business:
- Wave 1 brought an understanding that environmental impacts and natural resource demands have to be limited, resulting in an initial outpouring of environmental legislation. The business response was defensive, focusing on compliance, at best.
- Wave 2 brought a wider realization that new kinds of production technologies and new kinds of products are needed, culminating in the insight that development processes have to become sustainable – and a sense that business would often have to take the lead. The business response began to be more competitive.
- Wave 3 focuses on the growing recognition that sustainable development will require profound changes in the governance of corporations and in the whole process of globalization, putting a renewed focus on government and on civil society. Now, in addition to the compliance and competitive dimensions, the business response will need to focus on market creation.
(Elkington, 2004)
While he has not updated this annotated graph, it is important to note that Elkington has since referred to a "Sustainability Wave" which began in 2005, and reached its relative peak around 2012. Let's hope that peak continues to rise!
One pressure wave event not specifically noted in the graph, but which has had tremendous influence, is the creation of the Environmental Protection Agency (EPA) in 1970. While we will more closely examine the influence of the EPA and regulatory pressures later in this lesson and in future lessons, it is worth noting that in the American environmental movement, the influence of the EPA is not to be underestimated.
In the case of innovation, the regulatory realm presents a significant set of opportunities that can be leveraged to create sustainability-oriented products and services. We must always consider that with any set of constraints and limitations introduced into an organization, whether externally introduced (i.e., regulatory, competitive) or internally introduced (i.e., self-imposed), there is an opportunity for a product or service to bridge the void. We will dive more deeply into how exactly to accomplish this in later lessons, but it is important that we view every sustainability challenge as an opportunity.
The innovation implications of a single event

In keeping with the idea that 'every sustainability challenge is an opportunity,' examine the pressure wave events Elkington notes and consider the implications of each event. Regardless of our views on any specific outcome, consider the depth of implications from even one of the environmental events.
Check Your Understanding
Consider some of the cascading implications of the 1973 Arab Oil Embargo (which was noted as part of the "First Downwave" by Elkington):
- CAFE (Corporate Average Fuel Economy) standards were enacted in 1975 to increase the fuel efficiency of passenger cars and light trucks.
- The new concern with fuel economy in the American public moves increased attention to smaller, more fuel-efficient Japanese and European autos.
- Auto manufacturers begin to move away from engineering platforms that have been the norm for decades before; heavy body-on-frame vehicles, with thirsty V8s.
- New technologies are needed to meet the CAFE regulations.
What specific innovations can you think of that were the results of these cascading implications?
If you would like, jot a few notes below... and then click the link to reveal sample areas of interest.
Click for areas of potential interest.
- An entire wave of new engineering and supplier development begins to take hold.
- Ever heard of a thing called a BMW or a Toyota? Thank the Embargo.
- Technologies that had been viewed as curiosities for decades before are reexamined; diesel autos gain significant popularity in the US.
- Turbocharging, fuel injection, overdrive transmissions, electric fans, and a plethora of other developments are applied to vehicles.
Why do I mention these implications? Because in every case, growth and innovation was the response. We must always remember that regardless of the reason, any time an organization or industry is in a state of flux, it is an opportunity for the innovator or the upstart to gain a foothold. In the case of the 1973 Arab Oil Embargo, it was a groundswell of automotive innovation and a resurgence of development into technologies that may have been cost-prohibitive curiosities in the past.
It just happens that sustainability opens entire industries to innovation.

Resource Scarcity
Resource Scarcity
Diminishing Supplies, Increasing Demand
Today, we are faced with an increasing world population with increasing standards of living, and both trends place considerable pressure on a wide range of natural resources from water to tungsten to timber. This escalation of demand in the face of decreasing availability of resources leads to a natural increase in commodity prices... and therefore, more aggressive exploration. At its most extreme, very low supply with high demand can lead to aggression of a different kind: according to the United Nations Environment Programme, between 1990 and 2009, "...at least eighteen violent conflicts have been fuelled by the exploration of natural resources. In fact, recent research suggests that over the last sixty years, at least forty percent of intrastate conflicts have a link to natural resources" (UNEP, 2009).
Consider the overall trajectory of commodity prices now, as compared to other times of scarcity, namely World War I:
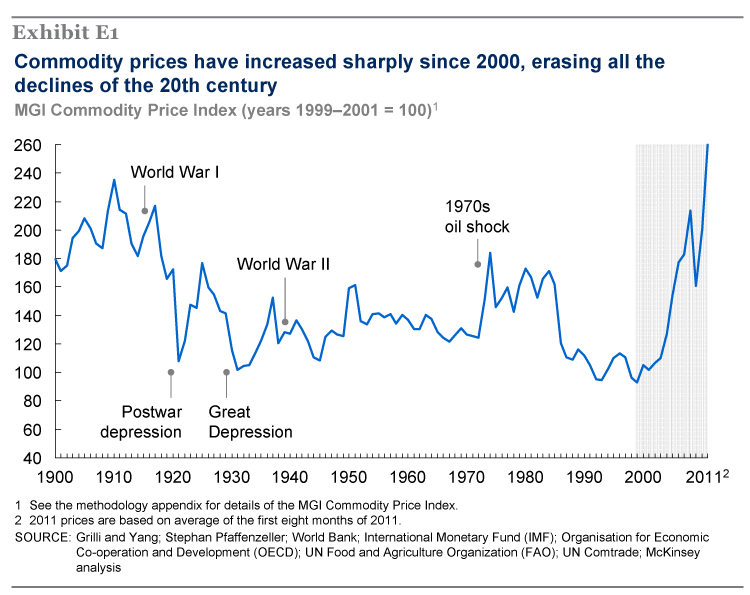
One Economist's View on Scarcity in the Next 20 Years
Put simply, the world’s dwindling supplies of arable land, fresh water, energy, and minerals—essential for the production of food and appliances such as mobile phones, cars, televisions and washing machines— cannot meet rising global demand.
Commodity demand is being driven by three primary factors: the rising world population, expected to grow [8] from roughly 7 billion today to 9 billion by 2050; increasing global wealth, with an estimated 3 billion people expected to join the ranks of the middle class by 2030; and a marked trend toward urbanization. On the last point, demographers predict that the number of urban dwellers will rise from 3 billion today to 5 billion by 2030, and each of them will demand better quality foodstuffs and modern conveniences that will accelerate the draw on the world’s resources.
On the supply side, however, arable land, potable water, energy, and minerals are finite, scarce and rapidly depleting. Take land—the earth contains approximately 13 billion [9] hectares (32 billion acres) of land, or an area about 16 times the size of the United States. Of that, just 11% (1.4 billion hectares, or 3.5 billion acres) is arable and thus suitable to grow crops. The other 89%—including mountains and deserts—is prohibitively harder to exploit and farm. With the world’s population exploding, many more people will be looking to live and grow food on smaller patches of land.
Then there is water. Although the earth is 70% water, less than 1% is easily accessible fresh water that can be used for the sustenance of life, such as for drinking and sanitation. Meanwhile, by consuming about 85 million barrels of oil a day [10], we are living off oil discoveries that date as far back as the 1950s. Moreover, environmental concerns about fracking and shale gas could limit their promise so that such alternatives do not offer a real reprieve to global energy woes.
Finally, the global supply of minerals like copper is undermined by a decline in quality, a shrinking number of discoveries, and increased vulnerability to political interventions. Increasingly, companies have to go much farther afield, into more difficult terrain and riskier geopolitical environments, in order to secure these minerals.
Moyo, D. (2012, June 8). The resource shortage is real [11]. Time. Retrieved Feb 2, 2015.
Scarcity and the Influence of Subsidies
If you'd like a quick refresher of market equilibrium, check out t [12]his great 10 minute video [13]. [12]
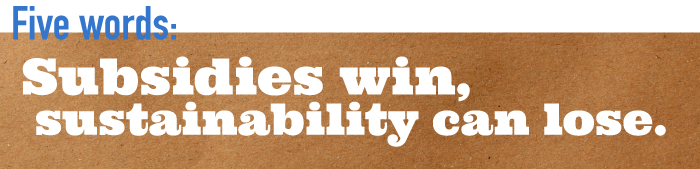
It would be a natural response of consumers in a free market to respond to increasing prices by changing their behavior to consume less of the resource or product. If the price of gasoline reaches $3.50/gallon, people will tend to drive less than if gasoline were $1.00/gallon. If the price of electricity increased 500% overnight, people would take a much harder look at LED lighting, improvements to the energy efficiency of their homes, or perhaps invest in down jackets. Regardless of the mitigating behavior, in time, the market would find equilibrium between supply, demand, and price. But, that market balance can be upset in a significant way by subsidies. If there is an "invisible hand" which finds balance and equilibrium of market forces, we can think of subsidies as an "invisible finger" pushing down on one side of the scale. In essence, subsidies distort the balance of markets. If a government subsidizes the price of gasoline, it weakens the price signals which balance supply, demand, and price. This can lead to severe overconsumption of resources.
For decades, governments from Egypt to Indonesia have subsidised the price of basic fuels. Such programmes often start with noble intentions—to keep down the cost of living for the poor or, in the case of oil-producing countries, to provide a visible example of the benefits of carbon wealth—but they have disastrous consequences, wrecking budgets, distorting economies, harming the environment and, on balance, hurting rather than helping the poor.
Emerging markets are not the only places that distort energy markets. America, for instance, suppresses prices by restricting exports. But subsidies are more significant in poorer countries. Of the $500 billion a year the IMF reckons they cost—the equivalent of four times all official foreign aid—half is spent by governments in the Middle East and north Africa, where, on average, it is worth about 20% of government revenues. The proceeds flow overwhelmingly to the car-driving urban elite. In the typical emerging economy the richest fifth of households hoover up 40% of the benefits of fuel subsidies; the poorest fifth get only 7%. But the poorest suffer disproportionately from the distortions that such intervention creates. Egypt spends seven times more on fuel subsidies than on health. Cheap fuel encourages the development of heavy industry rather than the job-rich light manufacturing that offers far more people a route out of poverty.
The Economist (2014, Jun 14). Scrap them [14]. Retrieved Feb 3, 2014.
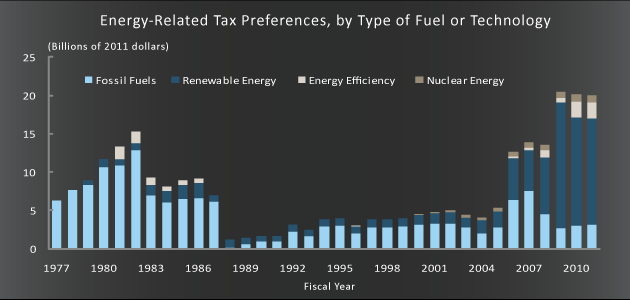
Below is a Congressional Budget Office view of United States energy subsidies over the past decades. Consider the influence these subsidies may have had in increasing–or decreasing–innovation and natural market balance. In the next lesson, we will explore the relationships between subsidies, greenhouse gas emissions, and carbon taxes.
Greenhouse Emissions and Carbon Taxes
Greenhouse Emissions and Carbon Taxes
The Most Contentious Facet of Sustainability
I'd like us all to temporarily cleanse our minds of any preconceived notions of greenhouse gases or carbon. Deep breath in, hold for 5 counts, deep breath out. Go to a serene place. Get a beverage and come back. I'll wait.
There are entire swaths of the practice of sustainability which, with discussion, rationale, and logic, can be met with incredible support in virtually every corner. Waste minimization and energy reduction tend to fall into this category. It's about living lean, reducing waste, and saving money while saving the planet. It's about responsibility, stewardship, and not wasting all of the work it took to create that aluminum can. It takes a little messaging and discussion, but, invariably, success can be had with even the most skeptical among us.
And then comes the issue of greenhouse gases (GHG) and carbon taxes.
In this topic, I would like us to explore a concept known as The Tragedy of the Commons (Hardin, 1968) as an entry point to help us understand why carbon regulation is a logical step which can help drive innovation and eliminate the market-biasing subsidies mentioned in the last section. For more about this please watch the following 6:36 video.
Video: Tragedy of the commons | Consumer and producer surplus | Microeconomics (6:36)
Let's say that we have three small ponds. This is pond A, this is pond B and this is pond C over here. Let's say that this first pond right over here, it's a privately owned pond. It's owned by Al and this pond over here is owned by Carol.
But this middle pond, pond B I guess we called it to start off with. This is common land, or I guess this is a common pond or this is open to the public.
Let's say that Al and Carol, they're both fishers. I guess Carol would be a fisherwoman. They both like to fish, that's how they make their living. Al in his pond, he has fish in there and he does some fishing in his pond. But he makes sure not to overfish because he doesn't want to deplete the stock of fish he has. He fishes just enough that he can pay his bills and whatever else but not so much that it depletes the fish and essentially makes them extinct in his pond. He doesn't want to overfish, and Carol does the same thing. She's got fish in her pond and she uses them to make a living. She gets them out and sells them and eats them and whatever else but she's careful not to overfish because if you overfish then there wouldn't be fish. There wouldn't be a next generation of fish.
Over here in this public pond, there are also fish. I'll draw their fish in orange. There are also fish in this public pond over here. They're smiling, maybe they won't be smiling for long. What is going to happen? Anyone can go and fish in this public pond. Al might say, and we'll just assume we’re in a world of two people. Obviously, the real world has more than two people.
Al will say, "Okay. I'm going to be very careful in my own pond. I'm going to fish just enough that I don't deplete the fish there. But any extra fish I need, I could go over here to this public pond and fish all I want." And I might be concerned about depletion in the public pond except for the fact, if I'm concerned about depletion, that's still not going to help the situation because other people might come and still not be so concerned and so I won't even get the benefit of the depletion if I hold back and other people come and deplete the pond.
When you have this pond that is open to the public, all of the surrounding people whether it's Al or Carol or I guess you could have other people here, they would say, "Look. I'm going to fish here. I'm going to get some benefit and even if I overfish the benefit of overfishing I'm going to get. In the near term I'm going to get all of those fish." Then the cost of that overfishing which is in the future there won't be as many fish or no fish at all, that's going to be spread out amongst everyone else.
So you have the situation where, because there's no one, I guess you could say, either owning this land or there's no one protecting this lake or however you want to describe it, there's a rational. And I want to be clear, rational does not always mean good. Rational actors might decide to overfish.
Essentially, by doing that, everyone's going to be worse off. They're going to destroy the productivity of this pond. They're going to destroy the productivity of the pond right over here. This idea that if there's this common land or common resource, in this case it was a pond and people can spread out the cause and they get the benefits directly. Essentially, you have a situation where that shared resource can get abused and this is called the tragedy of the commons.
This is the tragedy of the commons where in the example we did here, the pond is the common space that's being abused. It's especially a tragedy and I've already hinted at this already, is that even if Al decides that, "Hey, you know what? I'm going to hold back a little bit. I'm not going to fish so much because I don't want to deplete it." He'll say, "But wait. If do that, other people are going to come and deplete it so I have no incentive to hold back." So other people are also going to have the same logic and then this thing is going to get overfished here.
The classic example of tragedy of the commons where the example was first given was common grazing lands. Same exact idea. If this was private grazing land over here where I can keep my cows and my sheep and this is private grazing land over here where someone else has their cow and sheep but this over here is literally a commons where anyone can graze their cow and sheep. Then, just like the fishing, huge incentive for people to let their cow and sheep maybe overgraze the land, destroy the land, make it not sustainable but the cost of it are going to be shared by everyone else and the benefit of overgrazing, at least in the near term, you, the person who's overgrazing is going to get from it. You might even say, "I'm not even the one overgrazing it. It's all of us collectively overgrazing." So you don't blame me.
Now, what is the solution to the tragedy of the commons? How does a government or jurisdiction or a group of people avoid this type of destruction of a resource?
Well, one way that you could do is you could make this somehow into private land. If that was owned by the government, it could sell it, auction it off to private people who could then sell access to this. Or if the government does retain control of it, it could sell permits to the land. In this situation, you could sell permits. I could figure out hey, if someone fishes responsibly in a given day, they're going to get, I don't know, $200 of value by doing this. We're going to make a permit cost, I don't know, $150 so that someone still has an incentive to do it but that will also limit the amount of fishing that can be there and we can have some conservationist that makes sure that not too many permits are given for this space over here. We see that happening.
If you wanted to go hunting, there are permits you need to have. If you want to go fishing in a lot of places, there are permits that you want to have. If you want to go camping in a lot of places, there are permits because you could even over-camp an area if too many people are walking there, too much trash is there. It could ruin the camp grounds.
So this tragedy of the commons, the best way or the way most often seen, the best way of preventing the tragedy of the commons is through some type of a permitting process.
If you would like, you can read Hardin's original 1968 article [17] setting forth this concept.
The Tragedy of the Commons is an intuitive explanation of something that happens every day in the world around us: finite, common-access resources–such as air, water, or fisheries–are depleted when individuals are given unrestricted access. In this regard, we must remember that the concept of "maximizing gain" is not necessarily restricted to physical benefit, but to any erosion of public resources by the self-interests of individuals. Regardless of the specific expression of the Tragedy of the Commons, the ultimate result is the same: the resource is either depleted or eroded to the point of collapse.
Greenhouse gases could perhaps be the purest expression of The Tragedy of the Commons: a byproduct which is invisible and created in thousands of ways in daily life and that will damage entire systems of common resources, worldwide. The idea of a finite, tangible resource, such as a pasture or pond being depleted is quite accessible, but when it comes to impacts on the scale of greenhouse gases, it can be so large as to be almost inconceivable.
Greenhouse Gases
Greenhouse gases refer to a group of seven gases found in the atmosphere: carbon dioxide, methane, nitrous oxide, chlorofluorocarbons (CFCs), hydrofluorocarbons (HFCs), perfluorocarbons (PFCs), and sulfur hexafluoride. There is also some level of discussion about other potential greenhouse gases, one of which is perfluorotributylamine, a man-made chemical which currently exists in extremely small quantities in the atmosphere, yet is "7.100 times more powerful at warming the Earth over a 100-year time span than CO2" (Goldenburg, 2013). [18] Typically, the discussion on greenhouse gases tends to center squarely on carbon dioxide, as it is the most prevalent greenhouse gas and is generated heavily through the combustion of fossil fuels. In total, greenhouse gases share a common attribute in that they trap heat (infrared radiation) in the atmosphere and work to elevate temperatures.
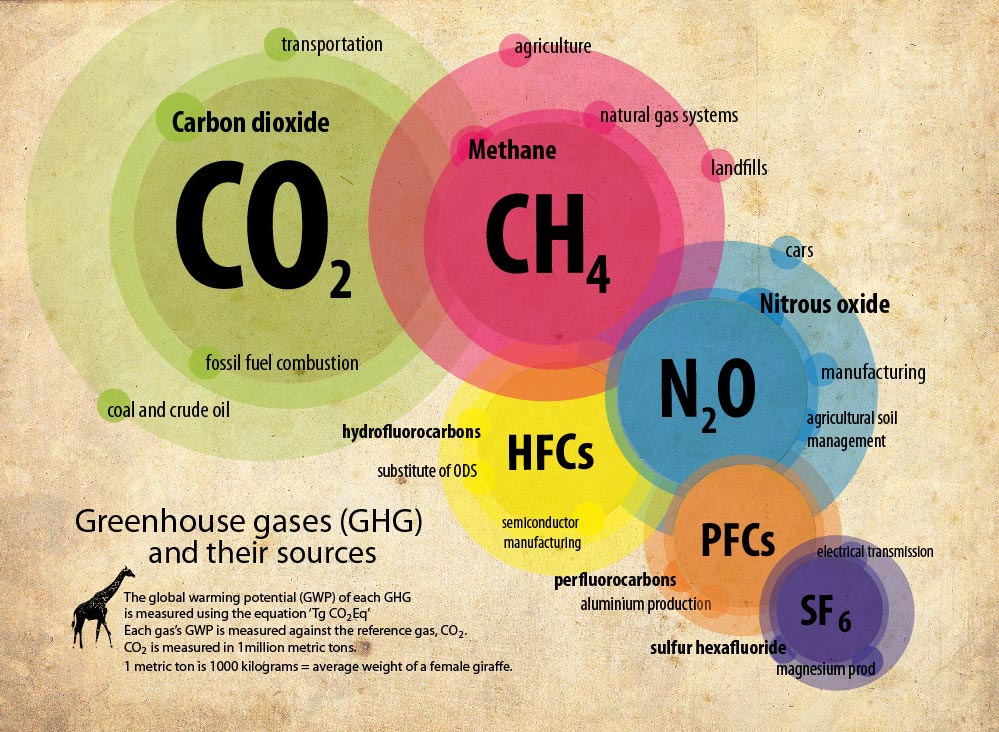
In sustainability reporting and in the calculation of the greenhouse gases generated from an entity (commonly referred to as the "carbon footprint"), the common measure used is carbon dioxide equivalent or "CO2e", which accounts for the emission of carbon dioxide and methane. The amount of these gases generated is typically normalized as "kilograms of CO2e" per (hour, mile, kilowatt or other measure of usage or operation) and can be utilized in measuring the emissions of virtually any direct or indirect activity, from operating a tractor to composting. Measuring and reporting carbon emissions is made easier by the excellent availability of data to calculate Scope 1 (direct) carbon emissions, but measurement becomes far more complicated in the calculation of Scope 2 and Scope 3 (indirect) emissions. These emissions are generated in the creation of energy utilized (Scope 2) or as consequences of transport, production, supply chain, and other outside activities (Scope 3). As we will see in many issues of sustainability in coming lessons, measuring and reporting Scope 2 or 3 emissions many times requires one to make estimations and judgment calls based on the best information available... and many times, comes down to being transparent about the assumptions made.
If you would like to see an example of Scope 1, 2, and 3 carbon emissions created in the brewing of beer, take a look at New Belgium Brewing Company's graphic representation of their GHG emissions. [19]
In general, NBB, Sierra Nevada [20], and Full Sail Brewing Co. [21] have some rather innovative approaches to sustainability, measurement and messaging.
Carbon Taxes
We may consider that any currency, be it the US Dollar or any other, is not inherently "good" or "bad". It is simply a mechanism by which the market accepts and unifies around a means of trade. We may consider the sheer mechanism of CO2e measurement in a similar way. It is a mechanism which the world at large accepts as the unified measurement of greenhouse emissions from virtually any activity from lighting a baseball field to burning off a wheat field. CO2e is so able to be empirically measured, we can even go as far as discerning the difference in emissions from burning the wheat straw residue vs rice straw residue:
| Biomass type | CH4 | CO2 | CO | Reference |
|---|---|---|---|---|
| Emission factor (g/kg) | ||||
| Agricultural residue | 2.70 | 1515±177 | 92±84 | 44 |
| Wheat straw | 7.37± 2.72 | 156±22 | 45 | |
| Rice straw | 5.32±3.08 | 82±20 | 45 | |
| Wheat straw | 3.55±2.66 | 1787±35 | 28±20 | 43 |
| Wheat stubble | 21.1±1.9 | 89 | ||
| Wheat fire | 38.20 | 89 | ||
| Wheat | 44.1±7.4 | 89 | ||
| Wheat | 59.00 | 89 | ||
| Wheat | 35.00 | 89 | ||
| Cereal waster | 1400 | 35.00 | 53 | |
| Wheat residue | 2.62-8.97 | 959-1320 | 61.1-179 | 86 |
| Wheat residue | 0.59-2.04 | 1540-1614 | 26-64 | 87 |
| Wheat straw | 0.41 | 34.65 | 88 | |
| Defalt emission ratio | ||||
| Agricultural residue | 0.01 | 0.06 | 20 |
The versatility of CO2e is that it can be a universal mechanism of measurement which may be applied to help us avoid The Tragedy of the Commons, and furthermore which may be used to eliminate the market biasing effect of subsidies. For example, imagine that, in attempting to avoid The Tragedy of the Commons, a government would like to tax the negative impact of emissions from antiquated power generation operations and use the funds to research alternative fuels.
Without measuring CO2e, the government in question could attempt to modify behavior in a few different ways, all of which are somewhat removed from the actual goal of reducing damaging emissions:
- Tax on a per-site basis. This is flawed in that a power company could have a shuttered facility which is in no way contributing to the negative impact of carbon emissions. Furthermore, the emissions of the restricted class of plants could be drastically different, yet they would all be taxed in the same way.
- Tax the revenue of the site. This approach is difficult in that the accounting can be quite complex, and therefore prone to loopholes.
- Subsidize clean energy. This may sound appealing, but consider that these subsidies are reducing price signals in the market, and therefore distorting market balance. This would also not deter a profitable company with antiquated plants from continuing their operations.
- ... and so on
Taxing CO2e emissions directly, on the other hand, would be considered a Pigovian tax, so named for British economist, Arthur. C. Pigou. Pigovian taxes are defined by the shared trait that they are designed to mitigate "negative externalities" (such as overgrazing, or greenhouse gas emissions) with the application of taxes specifically valued to offset the negative impacts. If you think back to The Tragedy of the Commons, it is an almost perfect parable of negative externalities: an activity where individual use of a shared resource is of detriment to others. In their purest form, we may think of Pigovian taxes as not artificially choosing "winners or losers" as subsidies may, but simply acting as an unbiased, unemotional accountant. These taxes essentially say, "You can build whatever kind of powerplant you prefer, but you will pay your share of any damage to shared resources."
The classic issue with Pigovian taxes is the valuation of the negative externality, essentially placing value on the erosion of a shared resource which is already difficult to valuate. For example, imagine placing a value on the shared visual damage wrought by a new residential development in a picturesque area, or the Pigovian price tag of a kilogram of carbon emissions. These are not easy determinations, but they may indeed change the landscape of daily life in the coming decades.
Professor Robert H. Frank, of Cornell University, wrote an excellent, short explanation of Pigovian taxes and mutual benefit [23] for The New York Times.

Environmental Standards and Certifications
Environmental Standards and Certifications
Current Reality
There are literally hundreds, if not thousands, of environmental certifications and standards today, ranging from those which could barely pass the sniff test of the marketing department in which they were incubated, to those which must pass formal audit and critical review by expert panels. Furthermore, to a casual observer, it may be difficult to differentiate between the extremes without performing research.
Unfortunately, the types of badges we may consider some of the most egregious offenders may have been created specifically to deflect or defuse what would be deserved criticism of environmental practices. This explosion of environmental marks may be referred to as "badge bloat," which is when there may be ten or more different standards all essentially certifying the same attribute. Unlike a battle of tangible and differentiated product standards (think of VHS v. Betamax or HD-DVD v. Blu-Ray) where the losing standard quickly ceases to exist because there is a direct cost, badges can live as long as the issuing industry group, NGO or corporation continues to exist. This persistence and proliferation can lead to tremendous confusion on the part of the consumer, and many a dinner debate among sustainability professionals as to the superior standard.
Prominent Certifications and Standards
Note that the term I use here is "prominent," and this is for a reason: below are some of the generally most referred to standards, and not necessarily the most valid or rigorous within a segment. As you gain more direct and indirect experience with certifications, you may begin to realize that some of those which are most popular may be beneficiaries of "first mover advantage" more than the most rigorous or well-defined.
| Logo/Badge | Summary |
|---|---|
 |
Leadership in Energy and Environmental Design (LEED) Primary domain: Sustainability of commercial, and increasingly, residential buildings. Primarily a US standard, though applied internationally. Statement: "LEED, or Leadership in Energy & Environmental Design, is a green building certification program that recognizes best-in-class building strategies and practices. To receive LEED certification, building projects satisfy prerequisites and earn points to achieve different levels of certification. Prerequisites and credits differ for each rating system, and teams choose the best fit for their project." Recipients: There are currently about 80,000 sites internationally holding a level of LEED certification or currently undergoing review. These sites range from Google locations and hospitals to manufacturing plants and private homes... and notably our Business Building, IM Building, and Moore Building on campus are all currently undergoing LEED certification. Notes: LEED is an example of a standard which gained a first mover advantage... and never stopped growing. It tends to be a bit of a hybrid standard in that it is partially prescriptive, yet flexible. To underscore this, it goes as far as to reward not only compliance with the various standards, but innovation in those areas. LEED AP (professional certifications) are very much in demand, with the U.S. Green Building Council reporting that over 9,000 job postings in the US between Mar 2013 and Feb 2014 required a LEED credential. To get a feel for what LEED looks like in practice, you can also peruse a database of LEED certified facilities [24] and take a look at how your home might score according to the latest LEED standard. [25] |
 |
International Organization for Standardization (ISO) 14001 Primary domain: A framework for the creation and reporting standards of an environmental management system (EMS). Global standard. Statement: "ISO 14001:2004 sets out the criteria for an environmental management system and can be certified to. It does not state requirements for environmental performance, but maps out a framework that a company or organization can follow to set up an effective environmental management system. It can be used by any organization regardless of its activity or sector. Using ISO 14001:2004 can provide assurance to company management and employees as well as external stakeholders that environmental impact is being measured and improved." Recipients: Many, especially in manufacturing (General Motors, Ford) and large facilities (hospitals, universities). In all, as of the ISO 2013 Survey, almost 302,000 sites worldwide held ISO 14001 certification. Notes: Many of ISO's standards in the sustainability realm, notably 14001, are not at all prescriptive. In fact, a typical refrain from those sites holding ISO 14001 certification is that it is more about process reporting and record keeping than the specific environmental impacts. Consider that a site could conceivably violate state or federal environmental regulations, and yet still comply with ISO 14001 without as much as an infraction. [26] Of late, there has been increasing discussion of ISO becoming more prescriptive in new revisions of standards. In keeping with their sometimes idiosyncratic ways, ISO does not have a badge for 14001 certification, instead allowing companies to create their own according to a very specific set of standards (and contingent on ISO approval). Ironically, the vast majority of these badges are in violation of ISO standards, as ISO strictly requires all badges to refer to standard year (i.e., ISO 14001:2004). Most do not. [27] ISO has provided an 11-page document on specifically how to refer to ISO 14001. [28] |
|
Global Reporting Initiative (GRI) 3.2 and 4.0 Primary domain: Organizational reporting and transparency, weighted toward large, publicly-traded corporations of all types. Global standard. Statement: "GRI's mission is to make sustainability reporting standard practice for all companies and organizations. Its Framework is a reporting system that provides metrics and methods for measuring and reporting sustainability-related impacts and performance. The Framework – which includes the Reporting Guidelines, Sector Guidance and other resources – enables greater organizational transparency and accountability. This can build stakeholders' trust in organizations, and lead to many other benefits. Thousands of organizations, of all sizes and sectors, use GRI's Framework to understand and communicate their sustainability performance." Recipients: A heavy percentage of the Fortune 500 and other large corporations worldwide, from Pepsi to Nike to Fiat. Overall, about 22,000 companies worldwide have filed reports with GRI, though many are not necessarily externally audited (you can submit what is called a "non-compliant" report, which basically means your company acknowledges that the report does not address each GRI reporting item). You can access all of the reports on their searchable Sustainability Disclosure Database [29], which we will be using more later in the semester. Notes: We will be using GRI quite a bit to unearth positions and potential areas for innovation, so I will delve into that discussion in those lessons. While it is also not a prescriptive standard, it is extremely rigorous in the items to be disclosed, from executive compensation to governance documentation. In essence, it forces transparency by capturing a company's responses to very specific questions. |
|
 |
Sustainable Forestry Initiative (SFI) Primary domain: Lumber products, both domestic and exotic. Global standard. Statement: "The SFI program's unique fiber sourcing requirements promote responsible forest management on all suppliers' lands. SFI chain-of-custody (COC) certification tracks the percentage of fiber from certified forests, certified sourcing and post-consumer recycled content. SFI on-product labels identify both certified sourcing and COC claims to help consumers make responsible purchasing decisions. SFI Inc. is governed by a three-chamber board of directors representing environmental, social and economic sectors equally." Recipients: As we might expect, recipients are centered around wood products and fiber, including large wood products companies (Georgia Pacific, Boise Cascade) and major printers (QuadGraphics, R.R. Donnelley). Notes: A criticism leveled against SFI is that it is a "fluff" certification and sets a low bar. I have captured one of those lines of public discourse in the FSC Notes. |
|
Forest Stewardship Council (FSC) Primary domain: Lumber products, both domestic and exotic. Global standard. Statement: "The Forest Stewardship Council A.C. (FSC) shall promote environmentally appropriate, socially beneficial, and economically viable management of the world's forests." Recipients: HP, AT&T, Allstate and many others, notably also those who are using paper and fiber products as a relatively small part of core operation (i.e., Allstate). Notes: SFI and FSC are an example of two certifications occupying a rather similar space, and there have been some rather public criticisms and more than a few cease and desists [30] exchanged in regard to SFI v. FSC. |
|
|
Energy Star Primary domain: Energy performance of appliances, lighting, HVAC components, and building systems. Primarily a US standard. Statement: "ENERGY STAR is a joint voluntary program of the U.S. Environmental Protection Agency and the U.S. Department of Energy that helps businesses and individuals save energy and fight climate change through energy efficient products, homes, and buildings." Recipients: Samsung, LG, Owens Corning, Carrier, and many other products have been rated to the Energy Star standard. Notes: Arguably, one of the more visible environmental standards in daily life, as it has become very widely used in everything from hot water heaters to refrigerators. (Interestingly, the yellow "EnergyGuide" [31] label you see on every new appliance showing how it compares to peers in energy consumption has no affiliation with EnergyStar, as it it provided by the Federal Trade Commission, and not the EPA.) |
|
|
B Corporation Primary domain: 3P-centric organizational standard, favored by small- and mid-sized companies. Global standard, though primarily US-based companies. Statement: "B Corp is to business what Fair Trade certification is to coffee or USDA Organic certification is to milk. B Corps are certified by the nonprofit B Lab to meet rigorous standards of social and environmental performance, accountability, and transparency. Today, there is a growing community of more than 1,000 Certified B Corps from 33 countries and over 60 industries working together toward 1 unifying goal: to redefine success in business." Recipients: Companies from Ben & Jerry's and Patagonia to lesser-known LEAP Organics and Pachamama Coffee Co-op are all certified B Corps. Notes: Along with GRI, we will be taking a deeper look into B Corp later in the semester as a fertile ground for innovation. |
|
|
Terracycle Primary domain: Upcycling of packaging of consumer packaged goods, primarily food packaging from large corporate partners. Global program, though heavily US-based companies. Statement: "TerraCycle is a proud triple-bottom line company. [...] More than just a recycling company, TerraCycle strives to be a driving force behind increasing environmental awareness and action. Our goal is to be a trusted resource for families, schools, communities, and even corporations to find tips, stats, facts, tactics, and news to help them live a greener, cleaner lifestyle. Together, we are Eliminating the Idea of Waste®. Today, TerraCycle is a highly-awarded, international upcycling and recycling company that collects difficult-to-recycle packaging and products and repurposes the material into affordable, innovative products. TerraCycle is widely considered the world's leader in the collection and reuse of non-recyclable, post-consumer waste." Users: Target, Frito-Lay, Mars, and other consumer packaged goods and food companies. Notes: While not a certification, it is a mark that a given package waste can be collected and sent to TerraCycle for upcycling. There has also been some criticism [32] leveled against TerraCycle for how and what they upcycle... if it is effective. (Note the comments section in the link, as a TerraCycle Co-founder rebuts some of the claims made.) |
Critical Analysis of Certifications and Standards
We will be embarking on quite a bit of critical analysis this semester, the reason being that the explosion of the sustainability practice has come with a number of certifications and companies with creative, interesting, and compelling public faces... and little else. When examining potential standards for your organization or the claims of others, it can be useful to consider the following:
- What is the peer group? In essence, what organizations are supporting the standard and what are the resulting filings/reports/outcomes? While not perfect, it can be very useful to watch the moves that highly respected, and importantly, third-party verified sustainability leaders are making in regard to environmental standards.
- Are organizations making it a requirement of their own supply chains? We will spend some amount of time on this topic as a source of opportunity and potential innovation, but if a company requires suppliers to be certified to an environmental standard, chances are they have quite a bit of interaction with it and believe it has an important role. One caution here is that these certifications can be in vogue on an industry basis... for example, conflict mineral standards are emerging as a significant concern in electronics, but are barely on the radar of many other industries not using these materials.
- Are audits and reports public? In many cases, the results of third-party audits of the standards are made public, and these can provide an excellent view into how rigorous a standard is in practice. Metaphorically, think of certifications as a physical... if all that is being reported in the report is "blood pressure and heart rate," we could expect the doctor is not terribly concerned with the well-being of the patient.
- Who can you talk to? One thing to remember is that those in the sustainability practice tend to be very highly engaged, though perhaps time- and resource constrained. If you are interested in a standard or choosing between competing standards, find a small handful of sustainability peers at organizations utilizing the standards and get in contact. I believe you will find that many are very willing to provide unvarnished experiences with the standards.
ISO has introduced a set of three standards specifically to evaluate environmental claims and labels: ISO 14021, 14024 and 14025. These could, in time, become exactly the independent validation of environmental claims many organizations are seeking, but currently, having to enlist a panel of judges to allow a company to use a badge on a product may be too slow and involved for many organizations. That said, the standards document provides many valuable ideas an organization could emulate internally [33] to validate environmental claims being made.

Regulatory and Public Influences
Regulatory and Public Influences
Morning in America

It's a lovely Wednesday morning in February. The sun is shining and birds are happily singing about 900 miles south of your current locale. But you have hot coffee. You arrive at your office at about 8:30 a.m., and promptly at 8:45 a.m. every morning, between 150 and 600 pages of indecipherable legal text citing indecipherable legal text from years past metaphorically lands on your desk, and the desk of every single organization and person in the United States. Every single workday of every year.
Welcome to the Federal Register, "The Daily Journal of the United States Government." [38]
While the word "journal" may conjure thoughts of sitting lakeside somewhere in an Adirondack chair and drawing ferns in your Moleskine, this is very different. This journal contains new rules, proposed rules, required notices, and other information with which your organization has to comply with in one way or another. These new rules and requirements can be literally decades in the making, or may arrive with no notice.
The fog of the regulations with roots in this document is literally so thick that the government many times does not agree with itself. Consider that a service of many environmental consultants is to literally take your organization's regulatory question, write a brief, submit it to a group of state or federal regulators, and ask for a formal ruling. If there are seven regulators on the panel, you could conceivably have seven different interpretations of the regulation, each of which could have wildly different implications for your organization. Perhaps this is an inflation. You may only receive four different interpretations with four wildly different implications for your organization.
While "E pluribus unum" may have appeared on the dollars you handed the barista that morning, the morning delivery of the Federal Register should bear "Ignorantia juris non excusat"– "ignorance of the law excuses no one."
Regulatory Influence and Legal Risk
The influence of regulations is not uniquely American. [39] In fact, we may be beginning to see the creation of de facto global regulations due to the multinational nature of so many corporations. In essence, multinationals seek to unify systems and internal environmental reporting across international sites, as well as being able to sell products internationally, and they do so many times through the application of the more stringent regulations across all sites internationally. This, in turn, exerts downward pressure through the supply chains the company uses in each country as they similarly require suppliers to meet their standards. We are beginning to see this exercised with the application of European REACH chemical regulations [40] being applied worldwide, as well as the very practical step of a unified chemical labeling and pictographic standard (the "Globally Harmonized System of Classification and Labeling of Chemicals" (GHS)) [41].
Interestingly, in many cases, it has not necessarily been global accords or other international agreements which have led to this dissemination of regulations across the world, but it has been the multinational corporations and the desire for efficient international trade.
The influence of environmental regulations on the organization varies depending on the organization, as a small bakery will be subject to a fraction of the regulations borne by a chemical plant or a metal plating operation due to the complexity, volumes, materials, and chemicals used in their operations. As we will examine further in a moment, those regulations have very direct and indirect costs on the organizations, and becoming more sustainable is an excellent way to reduce regulatory influence–and risk–in the organization.
Below are a few examples of regulatory influences and how they can affect an organization:
| Domain | Example regulation | Influences and risks for the organization |
|---|---|---|
| Local | Sound ordinances | Hours of operation; specification of equipment used; facility soundproofing measures; expansion plans and siting |
| State | Vermont Stream Alteration Rule§27-102 | Siting of any structure within the regulated areas; potential for restrictions on agricultural and silvicultural activities; additional reporting requirements and record keeping; need to notify the state in the event of moving or shifting; additional permitting required |
| Federal | EPA Resource Conservation and Recovery Act (RCRA) Hazardous Waste Regulations | Organizations are responsible for materials from "cradle to grave," meaning the generator of the waste is permanently liable for the environmental damages of a waste, even after disposal; additional transit restrictions; extensive record keeping requirements; additional handling, labeling and transit requirements |
| Location/ Habitat | Restrictions on land use near waterways officially designated as of "exceptional value" | Certain types of operations may not be able to establish within a certain radius of these locations; regular audits; more stringent record keeping and reporting requirements |
| Materials (in use) | OSHA Globally Harmonized System of Classification and Labeling of Chemicals (GHS) | Labeling on all bulk and use containers; regular training requirements; record keeping requirements |
| Wastes | EPA Waste Generator Accumulation Regulations | Inspection and handling requirements; requirements for container and closure types; establishment of designated or satellite waste accumulation areas; added air emission standards; additional record keeping and reporting; requirement to prove removal/disposal within specific time windows |
Public Influence and Reputational Risk
In addition to the influence of required environmental regulations under which an organization operates, there is a significant component of risk to an organization's reputation. Reputational risk, stemming from poor environmental performance being brought to the public eye, is not to be underestimated. A notable case we will examine in the next lesson is that of the public's influence on the Nike approach to worker rights, and we will spend significant time in this course examining stakeholder engagement as a tool for innovation. I'd like to lay a bit of a framework for thought here, and we will be taking a far deeper look in the area of public influence throughout the semester.
Brands are the persona–the soul–of an organization, from the smallest non-profit to the largest corporation. Consider the years and billions of dollars spent annually to create and build brands that would otherwise sell commoditized goods, be they carbonated brown sugar water or printed T-shirts. The brands are what create the tremendous sales, continuous PR, and command a price premium in the market... as well as attracting investment. Despite their tremendous value, brands are extremely fluid and fickle, and it does not take catastrophic damage to a reputation to put the organization in peril. The damage to the reputation of a brand need be just enough to cause customers to consider other brands... after that door is opened with loyal customers, the market does the rest. The brand loses its gloss... it becomes less attractive, maybe people think twice about how they would be perceived as an owner of the product. In time, the brand–and sales–erode.
The easiest way to think of reputational risk to the brand is what I call "The Jilted Lover Effect." When a customer has a very personal involvement with your brand and strongly associates with the persona and there has been a significant transgression of those brand values, "The Jilted Lover Effect" dictates that those who once loved your brand the most will become your most vehement, vocal, and lasting critics. Imagine if Patagonia were found to be dumping toxic byproducts behind their plant... this would cause a very immediate backlash, beginning first in its (formerly) most passionate fans.
Primary and Secondary Damage to Reputation
While many of us may first think of protests as pictured above when thinking of "environment" and "public influence," it is necessary to look beyond the more limited and episodic risks and into the far more invasive secondary damages.
|
Primary or episodic damage |
A protest inside or just outside your flagship location Pamphlet postings on windshields at your event Negative blogs and opinion pieces Public stunts, performances, and videos Most anything involving bullhorns, signs, or crowds of people |
|---|---|
| Secondary damage | Decreased passion and dedication among most loyal customers
Decreased usage of your products to avoid stigma of negative associations |
Sustainability's Role in Reducing Regulatory and Reputational Risk
Throughout this course, you will be asked to carefully consider the linguistics, metaphor, and frames that we use in both description and messaging. This is not an empty exercise. We do this in order to underscore that words not only have tremendous underlying meaning, but also so that we may more succinctly package our responses, messages, and arguments. A significant goal is for us to understand our philosophies on sustainability, how it fits within the organization, and how to create significant value from sustainability-driven innovation.
Allow us to take a moment to examine the word "footprint" as it is used in sustainability to describe the collection of impacts a person or organization makes on the world around it. It really is a passive, somewhat delicate word. Think of the places where one might encounter footprints... in sand, on grass, in snow, in freshly vacuumed carpet... in all cases, the footprint is temporary and easily remedied (if "remedy" is needed at all).

So, if "footprints" are of minimal impact, then "reducing our footprint" sounds to be of even lesser concern, akin to someone mentioning they are 'working to limit how many times they blink daily.' Blinking is not widely perceived to be a problem to start with, let alone something to be reduced.
So, we must be cognizant in our messages, frames, and arguments that some terms may work to trivialize sustainability and our need to reduce impact and risk (note: two very non-passive words).
When it comes to sustainability's role in reducing regulatory and reputational risk, consider that sustainability works to reduce the exposure of the organization subject to risk. An organization can't be fined by the EPA or state regulators for hazardous waste it doesn't have; it can't be devastated by a public campaign against environmental abuses in which it does not partake. Every movement the organization makes TOWARD sustainability is similarly a movement AWAY FROM legal, regulatory, and reputational risk. We must be clear that sustainability not only represents a very tangible opportunity for innovation and growth, but that it is part of a core business imperative to reduce risk to the organization. Some organizations place special emphasis on this role of sustainability, and structure sustainability as a function of the Legal department.
So, as we hear discussions of reducing an organization's "environmental footprint" or "carbon footprint," we should consider the frame we set and the message we convey using those terms... no matter how prevalent they may be. Let us consider sustainability as playing a far more directed, serious, and essential role in an organization, and that role is one of reducing the risk profile of the organization. Much as in the clinical setting, we seek to use every available means to strategically reduce our risk profile... be it through process innovation, reporting and goal setting, transparency, supply chain auditing, stakeholder engagement, reduction of hazardous materials, or otherwise.

Corporate Sustainability Reports (CSRs)
Corporate Sustainability Reports (CSRs)
An Explanation of Sustainability Reporting
The Global Reporting Initiative offers forth the following summary of sustainability reporting [46]:
A sustainability report is a report published by a company or organization about the economic, environmental and social impacts caused by its everyday activities.
A sustainability report also presents the organization's values and governance model, and demonstrates the link between its strategy and its commitment to a sustainable global economy.
An increasing number of companies and organizations want to make their operations sustainable and contribute to sustainable development. Sustainability reporting can help organizations to measure, understand and communicate their economic, environmental, social and governance performance. Sustainability – the ability for something to last for a long time, or indefinitely – is based on performance in these four key areas.
Systematic sustainability reporting helps organizations to measure the impacts they cause or experience, set goals, and manage change. A sustainability report is the key platform for communicating sustainability performance and impacts – whether positive or negative.
To produce a regular sustainability report, organizations set up a reporting cycle – a program of data collection, communication, and responses. This means that their sustainability performance is monitored on an ongoing basis. Data can be provided regularly to senior decision makers to shape the organization's strategy and policies, and improve performance.
Sustainability reporting is therefore a vital resource for managing change towards a sustainable global economy – one that combines long term profitability with ethical behavior, social justice and environmental care.
We will spend significant time this semester working with CSRs as a type of source material for innovation and strategy. So while we will be taking a far more technical and critical view of CSRs as the weeks pass, I'd like to offer a primer here.
The Effective CSR
There tend to be two ends of the CSR spectrum: one of which represents the very conceptual and aspirational, long on vision, but short on execution… and the other which tends to take a more accounting-like view of reporting, simply laying out the numbers, without emotion, context, or philosophical underpinnings.
Upon reading many CSRs, you may begin to see that some seem to just flow. They're interesting, they're charming, they have aspiration and vision, but are also practical and show vulnerability. You may find you feel a certain bond to the brand after reading it. In fact, there is a case to be made that the purest expression of a brand may not lie in its advertising, but in its sustainability report. Advertising talks at you, but many times, sustainability reports talk to you. We may consider five facets of an effective CSR as a lens through which to not only critically evaluate the content of a sustainability program, but also how it is presented.
VISAS: Five Facets of a Compelling and Practical CSR
Vision.
Compelling CSRs hold a central vision and mission closely. The influence of the mission and vision on the organization's sustainability efforts and CSR is unmistakable. The vision and mission is what bounds the sustainability efforts, keeps it focused in the right direction (according to the organization), determines what are long-term goals and what is secondary. This vision tends to be articulated early in the CSR and referred to often.
Less compelling CSRs tend to perhaps make passing reference to the organization's vision for sustainability, but that vision is not infused and embodied in the sustainability program. It is simply used as a garnish. Less compelling CSRs also have a tendency, ironically, to set visions which are so lofty as to be completely unrealistic and entirely unsupported. Chances are, an organization which does not capture or allude to a single sustainability metric will not single-handedly make 'sustainable commercial development' a reality.
Innovation.
Compelling CSRs tend to be infused with a feeling of innovation, which one could consider simultaneously practical and playful. In many cases, this innovation tends to be because the CSR reflects a sustainability mission which is well-developed and embraced by the entire organization, and therefore becomes a hotbed for thought and interest. As the entire organization becomes more engaged in the vision and the program matures, the CSR tends to become a reflection of that enthusiasm. Innovative initiatives are developed and flourish as different people and functions within the organization bring their talents to the sustainability program. By nature, sustainability is a widely multidisciplinary field, and innovation in sustainability requires understanding, enthusiasm, and a sense of partnership.
Less compelling CSRs tend to go through the motions of innovation, perhaps highlighting one initiative or another as interesting. These programs struggle to create what could be considered a "veneer of innovation." An example of this is when an organization may have had an interesting initiative four or five years prior, yet is still touting its exploits. Interesting CSRs tend to be out of date before they are published, as there is constant movement, imagination, and innovation happening.
Storytelling.
Compelling CSRs tend to be rich with stories. These may be stories of triumph or ingenuity, passion or failure, but they are real stories with faces and voices. Rich storytelling is, in many ways, the byproduct of a sustainability program performing well on the other VISAS facets, as these stories tend to be a reflection of an organization's engagement in the sustainability vision and the empowerment of everyone to better the organization. With this kind of entrepreneurial spirit happening, one could expect that some great stories would arise.
Less compelling CSRs tend to either be entirely without stories, or have a sprinkling of highly sanitized stories. These stories are completely devoid of any emotion or persona, and tend to be bland because they are either wholly fabricated or intended as some sort of corporate parable: "A Generic Co. associate was walking into work at one of our 600 proud facilities nationwide and thought it would be nice to recycle office paper..."
Accomplishment.
Compelling CSRs are clear about metrics, goals, and accomplishments. They do not hide metrics or otherwise obscure progress toward goals, instead tending to distill what could be complex measures into simple, visual, easily understood metrics. These metrics may be backed by tremendous amounts of data and supporting assets, but the compelling CSR does not seek to impress with reams of fine print. Furthermore, in the interest of transparency and brevity, they are also equally likely to recount disappointments or missed goals, electing to embrace them as opportunities for learning.
Less compelling CSRs tend to bask in complexity to further appearances they have meaningful goals and accomplishments. They may have 40 or 50 poorly structured, redundant metrics, and may also tend to obscure how the metrics are derived. A common practice in these types of CSRs can be to index the next decade of performance to a "year zero" baseline. While they may provide impressive year over year performance (i.e., "in 2015, we reduced electricity usage 20% over our 2005 baseline."), they, in many cases, simply highlight how poorly performing the organization was in the baseline year. Furthermore, less compelling CSRs have a tendency to not "raise the bar" on metrics after they are reached, instead choosing to rest on their accomplishments as long as possible.
Structure.
Compelling CSRs have a logical flow and structure, and clearly depict sections. While this may sound to be a rather tactical and low-level concern, a well-articulated structure in a CSR makes the other facets that much more compelling. The reason for this is that CSRs with strong structure tend to take on an almost narrative quality, and read as a single, unified story as opposed to an assemblage of unrelated components. Think of anything from a compelling TED Talk to timeless literature, and they all follow one variation or another of the classic narrative structure: Orientation - Complication - Resolution. No CSR ends in total, perfect resolution of all problems, but ends on a hopeful note by showing progress made toward important goals.
Less compelling CSRs tend to lack the narrative feel, and therefore result in the reader skimming or choosing selected passages to review. In essence, it is very difficult to create an interesting story without a compelling viewpoint, meaningful accomplishment, notable struggle, or interesting characters. Interesting stories write themselves by comparison because the source content has richness.
Vision, Mission, and Values
A section of the CSR I would like to call attention to specifically is the Vision, Mission, and Values (VMV) of the organization. It may go by any one of those names, or some derivative, but it is typically set forth quite clearly early in the CSR, and acts to set the context of the organization's sustainability. The VMV acts as the frame by which we can judge a company's sustainability efforts. VMV sets the desired destination, so our first goal is not necessarily to judge the destination, but to understand if the organization's stated strategy, approach, and indicators align with the destination. In essence, we do not bring our preconceptions or existing frames to measure the organization, but we use their own words and definitions of what is important to their organization.
In keeping with the theme of this week's case, the below is a sample of the stated VMVs for a handful of outdoor products companies:
| Organization | Stated Vision / Mission / Values |
|---|---|
|
[From CEO's letter] "Our love of the outdoors anchors our focus on exploration, protecting recreation areas, and addressing the environmental effects of our business. To marshal our resources most effectively, we are targeting our energies at the areas where we can achieve the greatest impact. For The North Face, this means focusing on resource efficiency and material selection in our product manufacturing." |
|
| "Our Reason for Being: Build the best product, cause no unnecessary harm, use business to inspire and implement solutions to the environmental crisis." | |
 |
"REI’s purpose is to inspire, educate and outfit for a lifetime of outdoor adventure and stewardship. At the co-op, being a good steward is reflected in how we care for the world in which we play, work and live, and how we connect people to nature.
Specifically, our efforts are designed to:
|
| "At Columbia Sportswear, we are committed to building a company of which we can all be proud – not only of the innovative products we create and the financial results we achieve, but the manner in which we achieve them. Whether it’s responsible sourcing, giving back to our communities, or reducing our environmental impact, we believe corporate responsibility is a company wide effort." | |
 |
"The single biggest area of our company’s environmental impact is the products we design and make. As a result, our environmental initiatives are primarily structured to address the footprint and composition of our product and materials. In general, we seek to operate in a responsible, efficient, and mindful way. This translates to minimizing waste in our operations, to sourcing safe and effective materials, and perhaps most importantly, to designing and manufacturing products to be the longest lasting and best performing in our industry. Our environmental initiatives, like our product design in general, focus on extending the lifetime and performance of the products. These initiatives span product design and care, materials research and development, efficient manufacturing, and responsible sourcing." |
As you can see, the VMVs of a relatively defined group of companies vary greatly in their formality, depth, and areas of emphasis, but nonetheless, set forth a context by which their sustainability efforts may be judged.

"Planet" in the CSR
"Planet" in the CSR
The White Whale of Sustainability Reporting
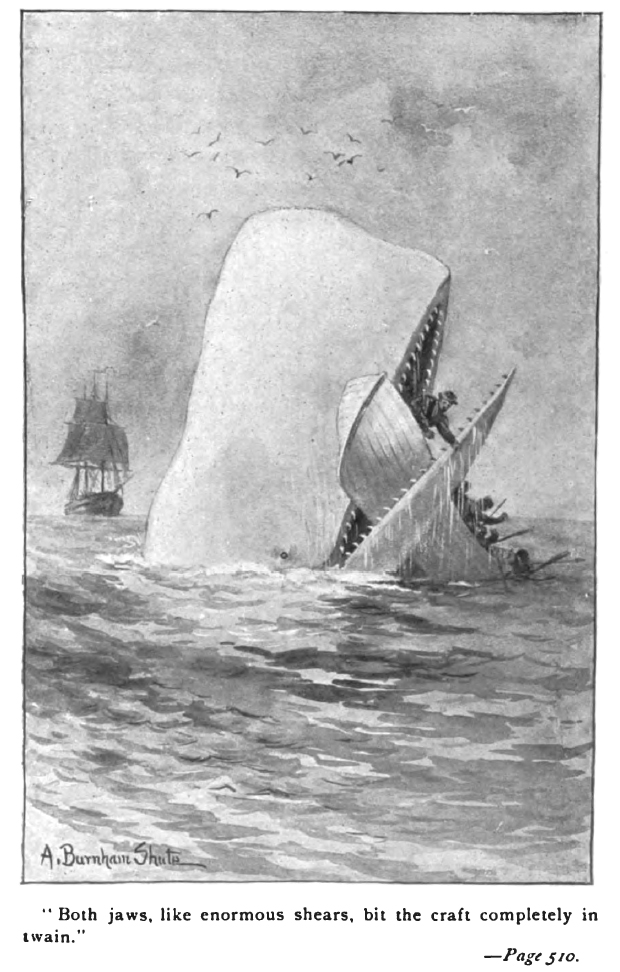
There are hundreds, if not thousands, of Planet elements that could be addressed in a CSR, from solvent emissions to carbon emissions to chain of custody reporting, and it would appear that some organizations indeed feel compelled to address every single one. So, the CSR and sustainability program attempts to do everything, acquire every certification, address every standard... and in the process, does not actually progress toward any meaningful goal. For this reason, one might consider this overscoped organizational approach to Planet as pursuing some mythical "White Whale of Sustainability Reporting," as it represents a relentless, yet futile, chase on the part of the sustainability program.
If we try to understand the motivations of these organizations chasing the "White Whale," the underlying root cause may ultimately be a sustainability program weak in VISAS facets. Instead of concentrating on those Planet elements and metrics which are of high importance for their own sustainability vision, the tendency can be to "fill the void." Because the sustainability program lacks direction, purpose, and personality, it does what is easy and superficial... and it does so through a high volume of essentially meaningless activities. As we will see throughout the semester, effective sustainability programs are just as much about saying "yes" as they are about saying "no." We must make choices about what is important to the organization as we develop a platform for innovation.
For your consideration
BMW Group has more than 110,000 employees worldwide, around € 75 billion in annual revenue... and is arguably one of the most sustainable companies in the world.
It has three environmental Key Performance Indicators (KPI) [49]: (1) Energy consumption per vehicle produced, (2) Waste for disposal per vehicle produced, and (3) Water consumption per vehicle produced. It then adds three more measurements to create the core of its "group-wide environmental protection" program [50]: Process wastewater, Solvent emissions, and CO2 emissions.
If BMW can focus on only SIX top-level environmental metrics most important to its vision, perhaps this is a worthy aspiration for any organization. BMW has said "no" to a tremendous number of potential distractions to be able to say "yes" and devote appropriate attention to those six measurements.
Planet aspects and indicators in sustainability reporting
A note on terminology we will be using quite a bit in this course and in reference in CSRs:
Environmental aspect: Any means by which the organization directly or indirectly impacts the environment through the manufacture, transportation, use, or end of life. This could be anything from emissions from trucks idling at a loading dock to landfilled waste.
Indicator: A measurement of the extent to which an aspect impacts the environment, such as '50 tons of CO2 generated per month 'or '450 gallons of hazardous waste generated per year.'
While there may be a seemingly infinite number of Planet aspects and indicators one could report in a CSR, there tends to be some level of uniformity on the generally most important aspect areas. Note that, while there may be best practices, there are no "required" units or means to state indicators in CSRs, even GRI-compliant ones. So, if you were compiling a CSR, you could choose to represent your energy consumption in BTU, joules, gigajoules, kWh... and potentially also index it to whatever baseline or other number you prefer. So, even if two companies state internal energy consumption in gigajoules, one could index to production ("gigajoules of energy consumed per 1000 cars produced"), while the other could index to a baseline ("gigajoules of energy consumed, compared to 2009 baseline"). So even if the aspect and core indicator are the same, they could be stated in drastically different ways.
In the table below are some expressions of the more common Environmental/Planet aspects you'll see in CSRs worldwide. I have also included links to the Global Reporting Initiative G4 Implementation Manual for reference (or if you would like to explore more on a certain aspect!).
Read the linked GRI pages (a page or two each), and pay special attention to the Guidance: Relevance sections, as they frame up the topic nicely.
Review the sample presentations of the indicators. Take some time to consider not only the structure of the presentation, but also the underlying aspects and indicators represented.
- Are they are appropriately represented for the organization?
- Are they clearly stated?
- Could they be better stated in a different way?
As we become more advanced in our abilities to critically analyze filings, we will begin to see that although some indicators and graphs may appear to be beautifully executed, there may be serious issues underlying the scope and indexing on which the indicator is represented.
As a warm-up, I have included two graphs with elements we could consider "red flags" and deserving of some additional research and scrutiny. Again, these are all superficially well-structured, attractive presentations of the indicators, but they may hide significant flaws in logic or measurement. Give it a try, and see if you can identify the two "red flags" in the presentations below!
Planet Aspects and Indicators in Corporate Sustainability Reports
Greenhouse Gas Emissions (GHG)
| Aspect of Greenhouse Gas Emissions (GHG) | GRI G4 definition | Example/Presentation of the indicator as presented in CSR |
|---|---|---|
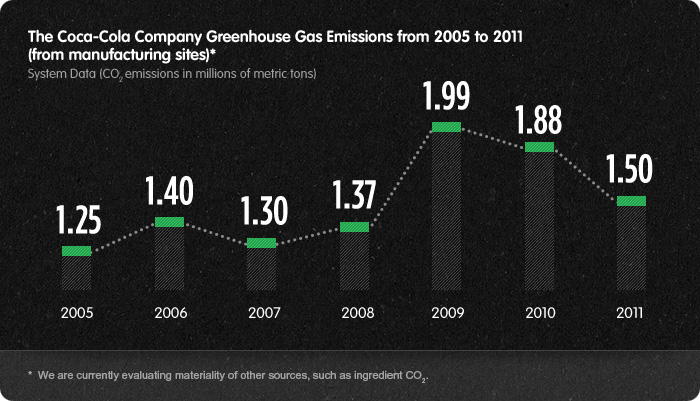
| Scope 1 emissions | G4-EN15 Report [51] |
Text Version for Coca-Cola Company Greenhouse Gas Emissions from 2005 - 2011 [54] |
| Scope 2 emissions | G4-EN16 Report [55] |  [56] [56]
Credit: enter credit here
Click on image to see a larger version.Text Version of the CH2M HILL Global Carbon Emissions Image [57] |
| Scope 3 emissions | G4-EN17 Report [58] | 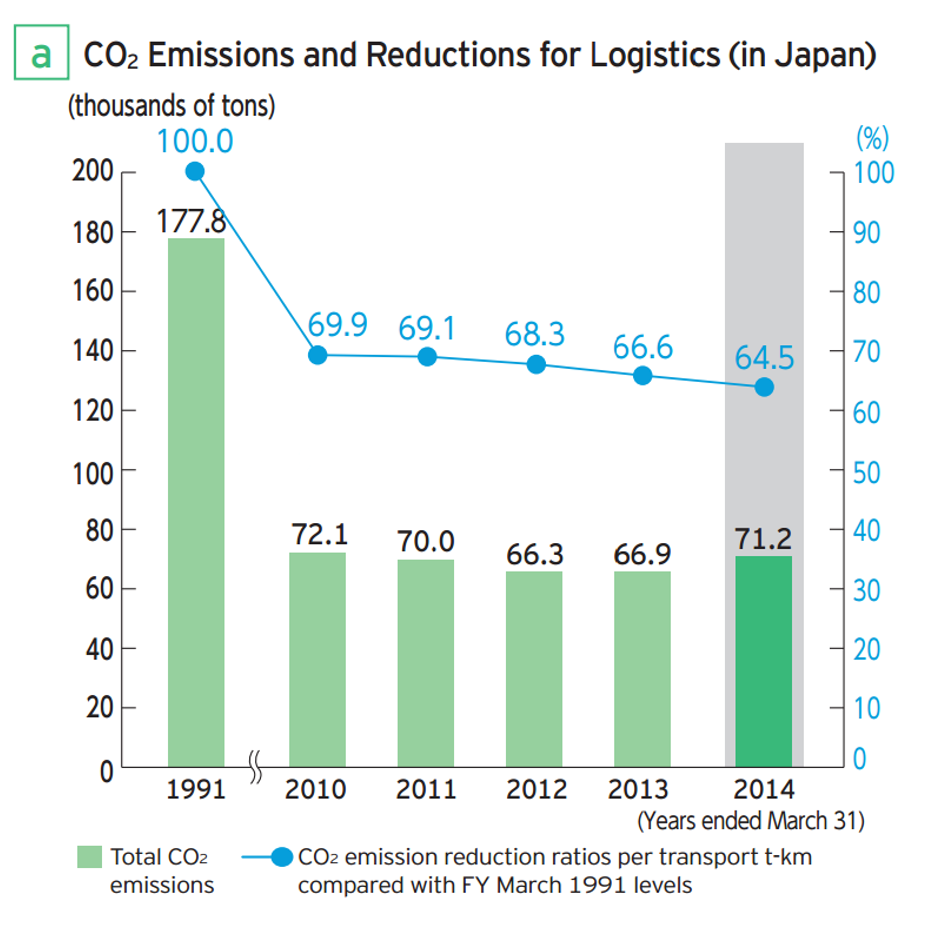 [59] [59]
Credit: enter credit here
Click on image to see a larger version.Text Version of CO2 Emissions and Reductions for Logistics (in Japan) [60] |
Solvent and Vapor Emissions
| Aspect of Solvent and Vapor Emissions | GRI G4 definition | Example/Presentation of the indicator as presented in CSR |
|---|---|---|
| Volatile Organic Compounds | G4-EN21 Report [61] | 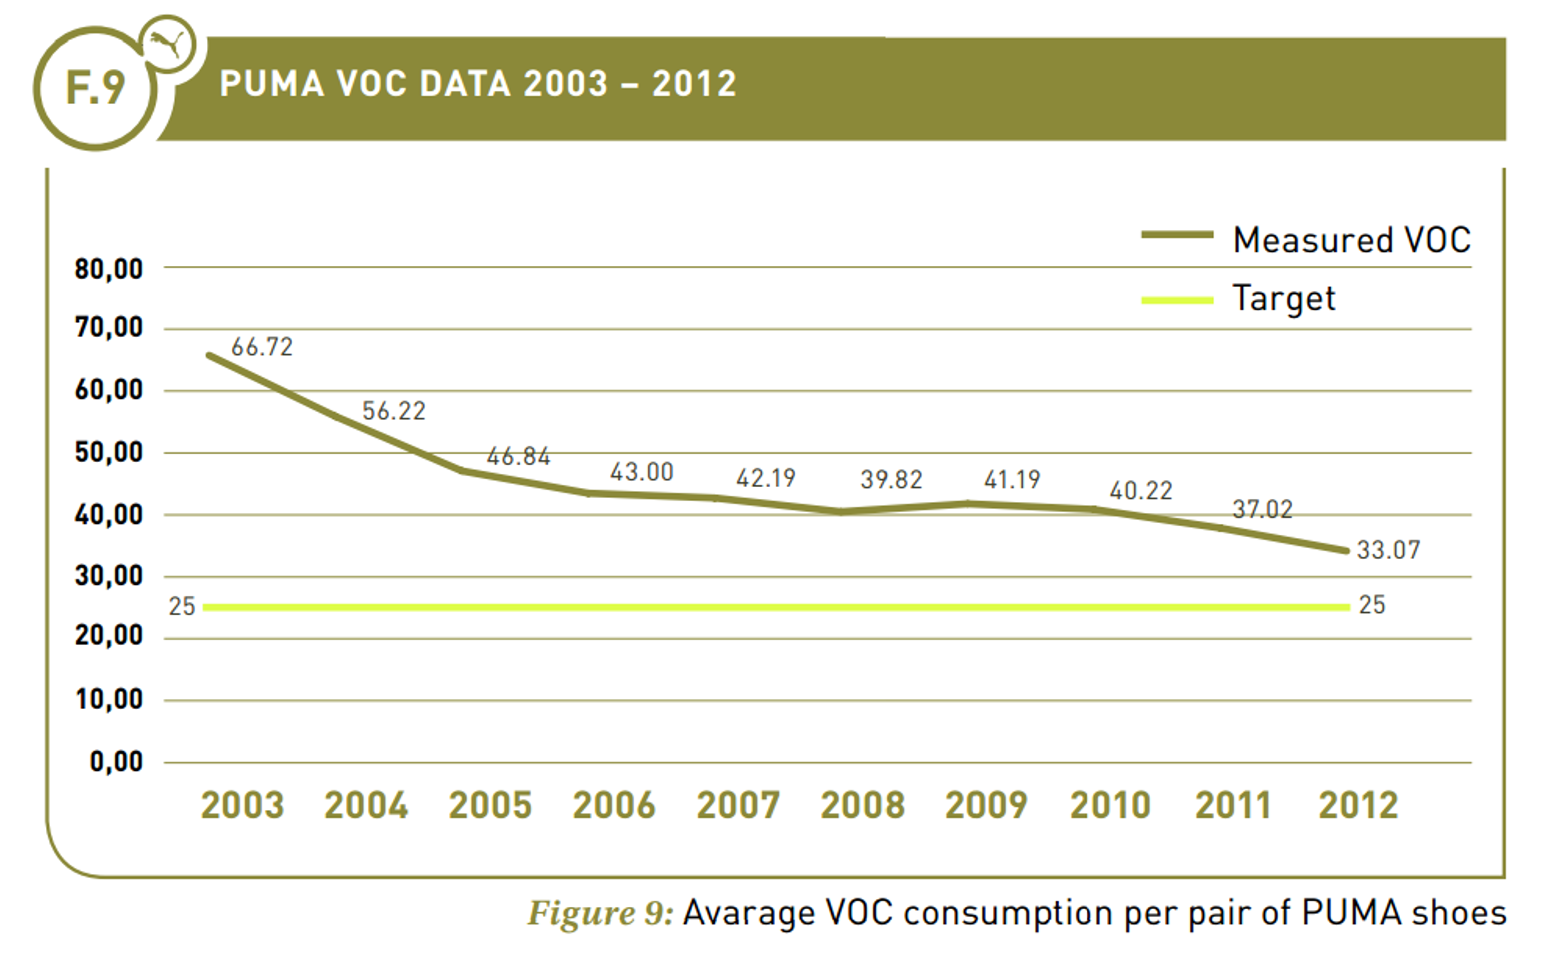 [62] [62]
Credit: enter credit here
Click on image above to see a larger version.Text Version of PUMA VOC Data 2003-2012 Graph [63] |
Waste and Byproducts
| Aspect of Waste and Byproducts | GRI G4 definition | Example/Presentation of the indicator as presented in CSR |
|---|---|---|
|
Waste to Landfill Waste to Energy Waste Recycled |
G4-EN23 Report [64] | 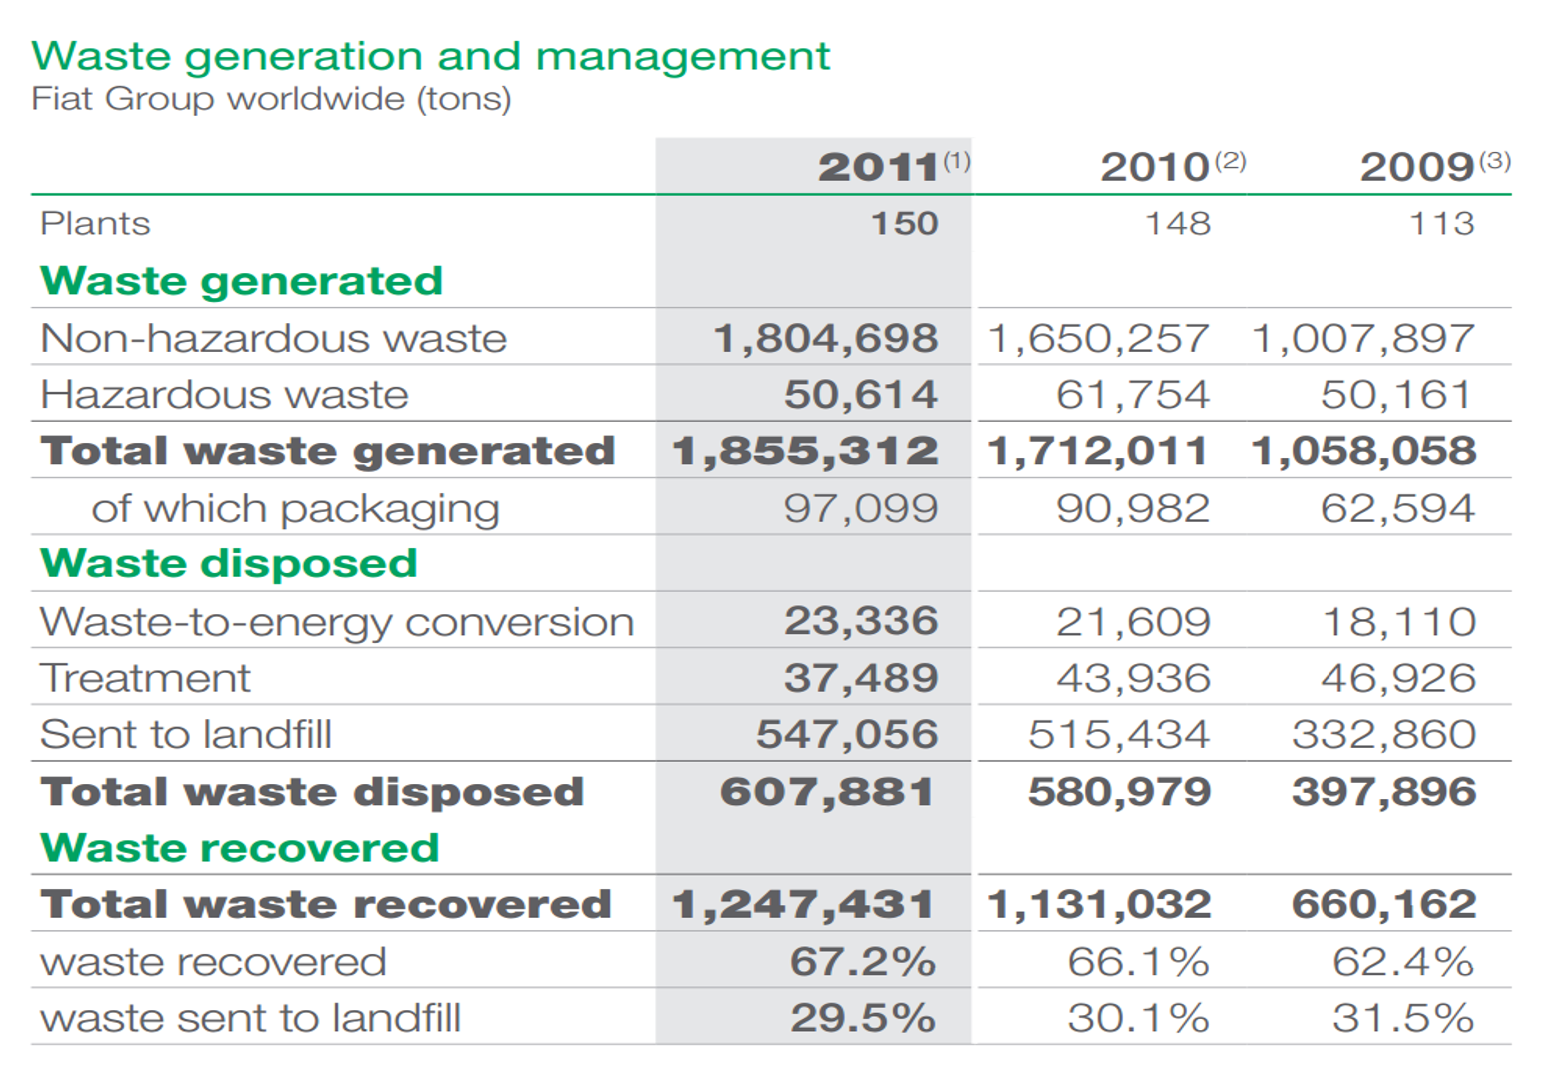 [65] [65]
Credit: enter credit here
Click on image to see a larger version.Text Version of Waste Generation and Management Image [66] |
| Significant spills or releases | G4-EN24 Report [67] |  [68] [68]
Credit: enter credit here
Click on image to see a larger version.Text Version of Significant Spills or Releases [69] |
| Hazardous waste generation | G4-EN25 Report [70] | 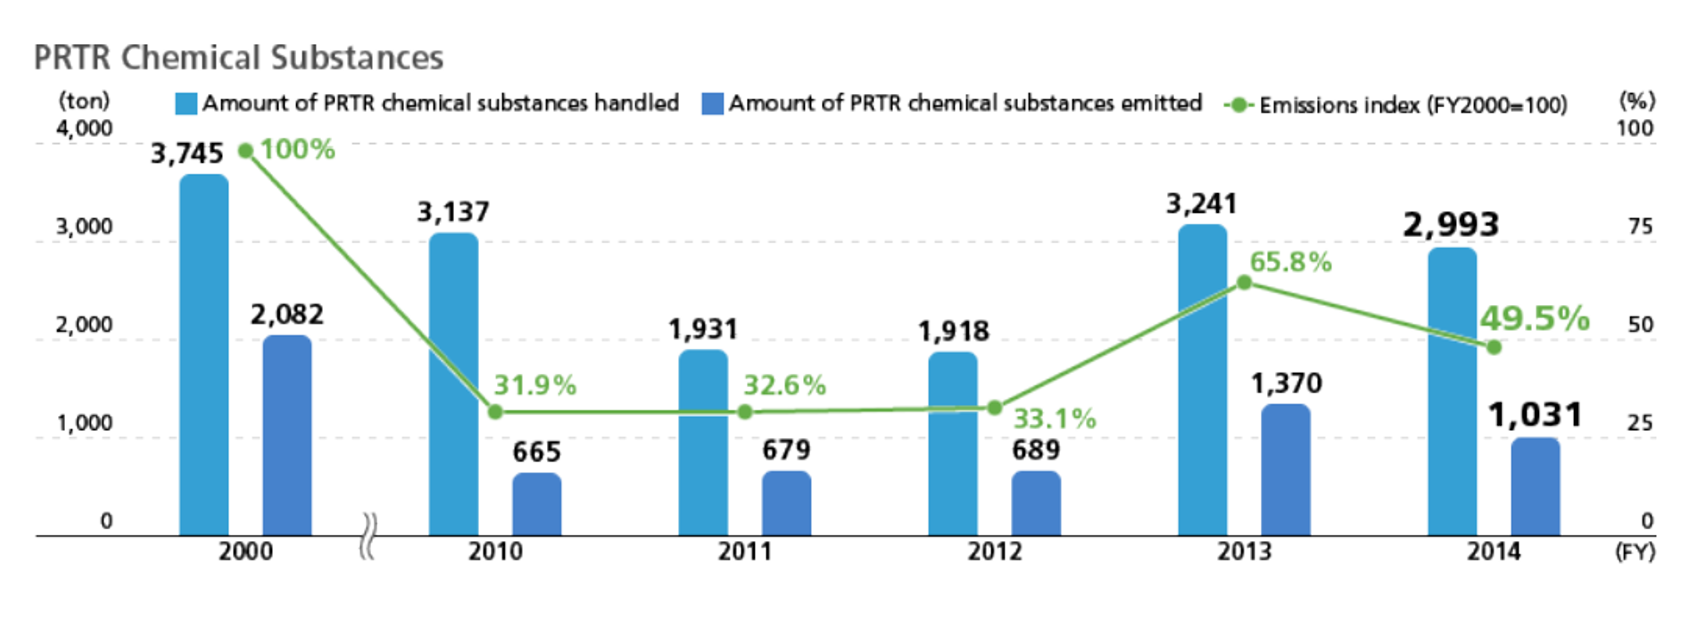 [71] [71]
Credit: enter credit here
Click on image to see a larger version.Text Version of PRTR Chemical Substances Graph [72] |
Energy Use
| Aspect of Energy Use | GRI G4 Definition | Example of the indicator as presented in CSR |
|---|---|---|
| Types of energy used | G4-EN3 Report [73] | 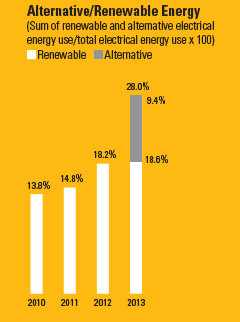
Credit: enter credit here
Text Version of Alternative/Renewable Energy Graphic [74] |
| Energy consumption (internal, direct) | G4-EN3 Report [73] | 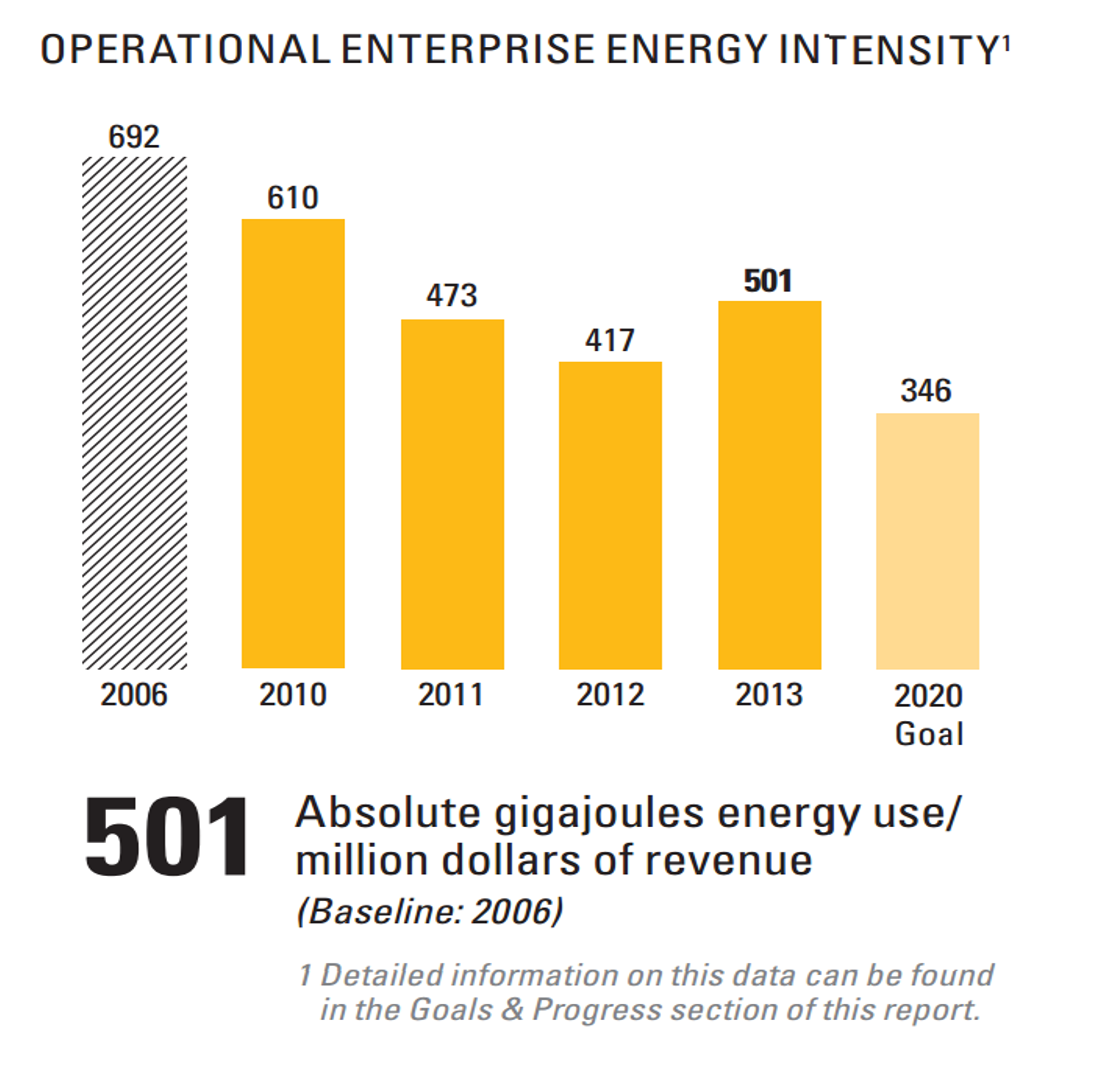 [75] [75]
Credit: enter credit here
Click on image to see a larger version.Text Version of Operational Enterprise Energy Intensity Graphic [76] |
| Energy consumption (indirect, supply chain) | G4-EN4 Report [77] | 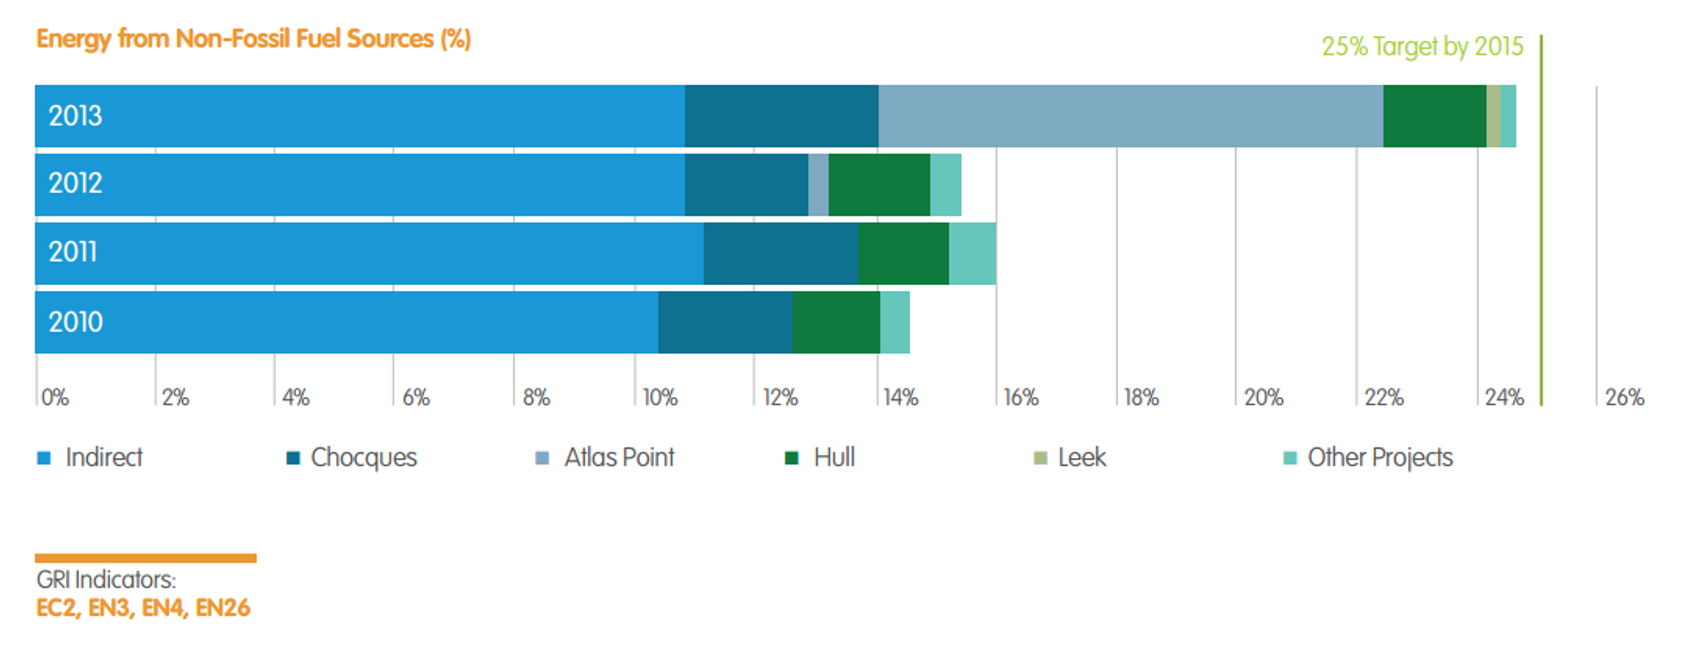 [78] [78]
Credit: enter credit here
Click on image to see a larger version.Text Version of the Energy from Non-Fossil Fuel Sources Graph [79] |
Water Use
| Aspect of Water Use | GRI G4 definition | Example of the indicator as presented in CSR |
|---|---|---|
| Water withdrawal and source | G4-EN8 Report [80] | 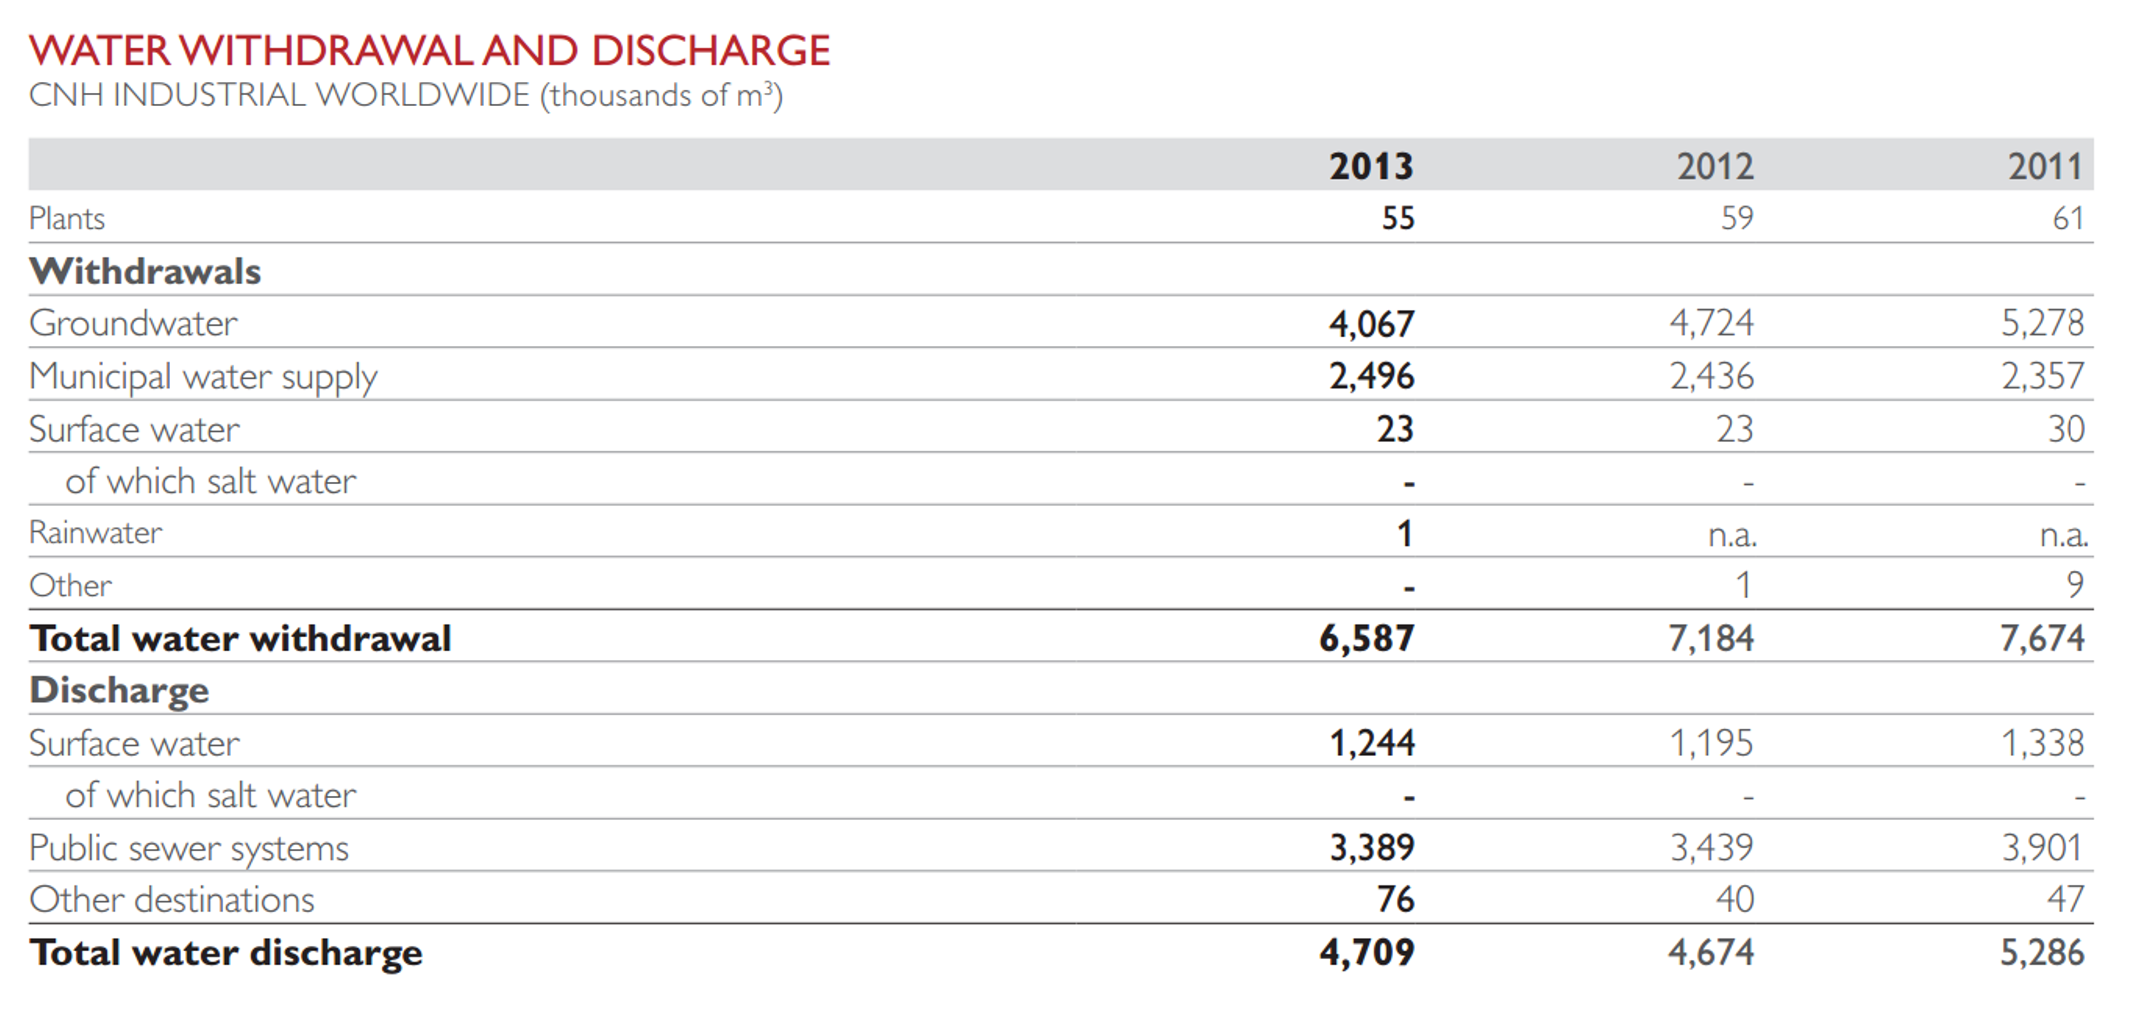 [81] [81]
Credit: enter credit here
Click on image to see a larger version.Text Version of Water Withdrawal and Discharge [82] |
| Water discharge quality | G4-EN22 Report [83] |
Biodiversity and Habitat
| Aspect of Biodiversity and Habitat | GRI G4 definition | Example of the indicator as presented in CSR |
|---|---|---|
| Impacts on high value areas | G4-EN12 Report [84] | 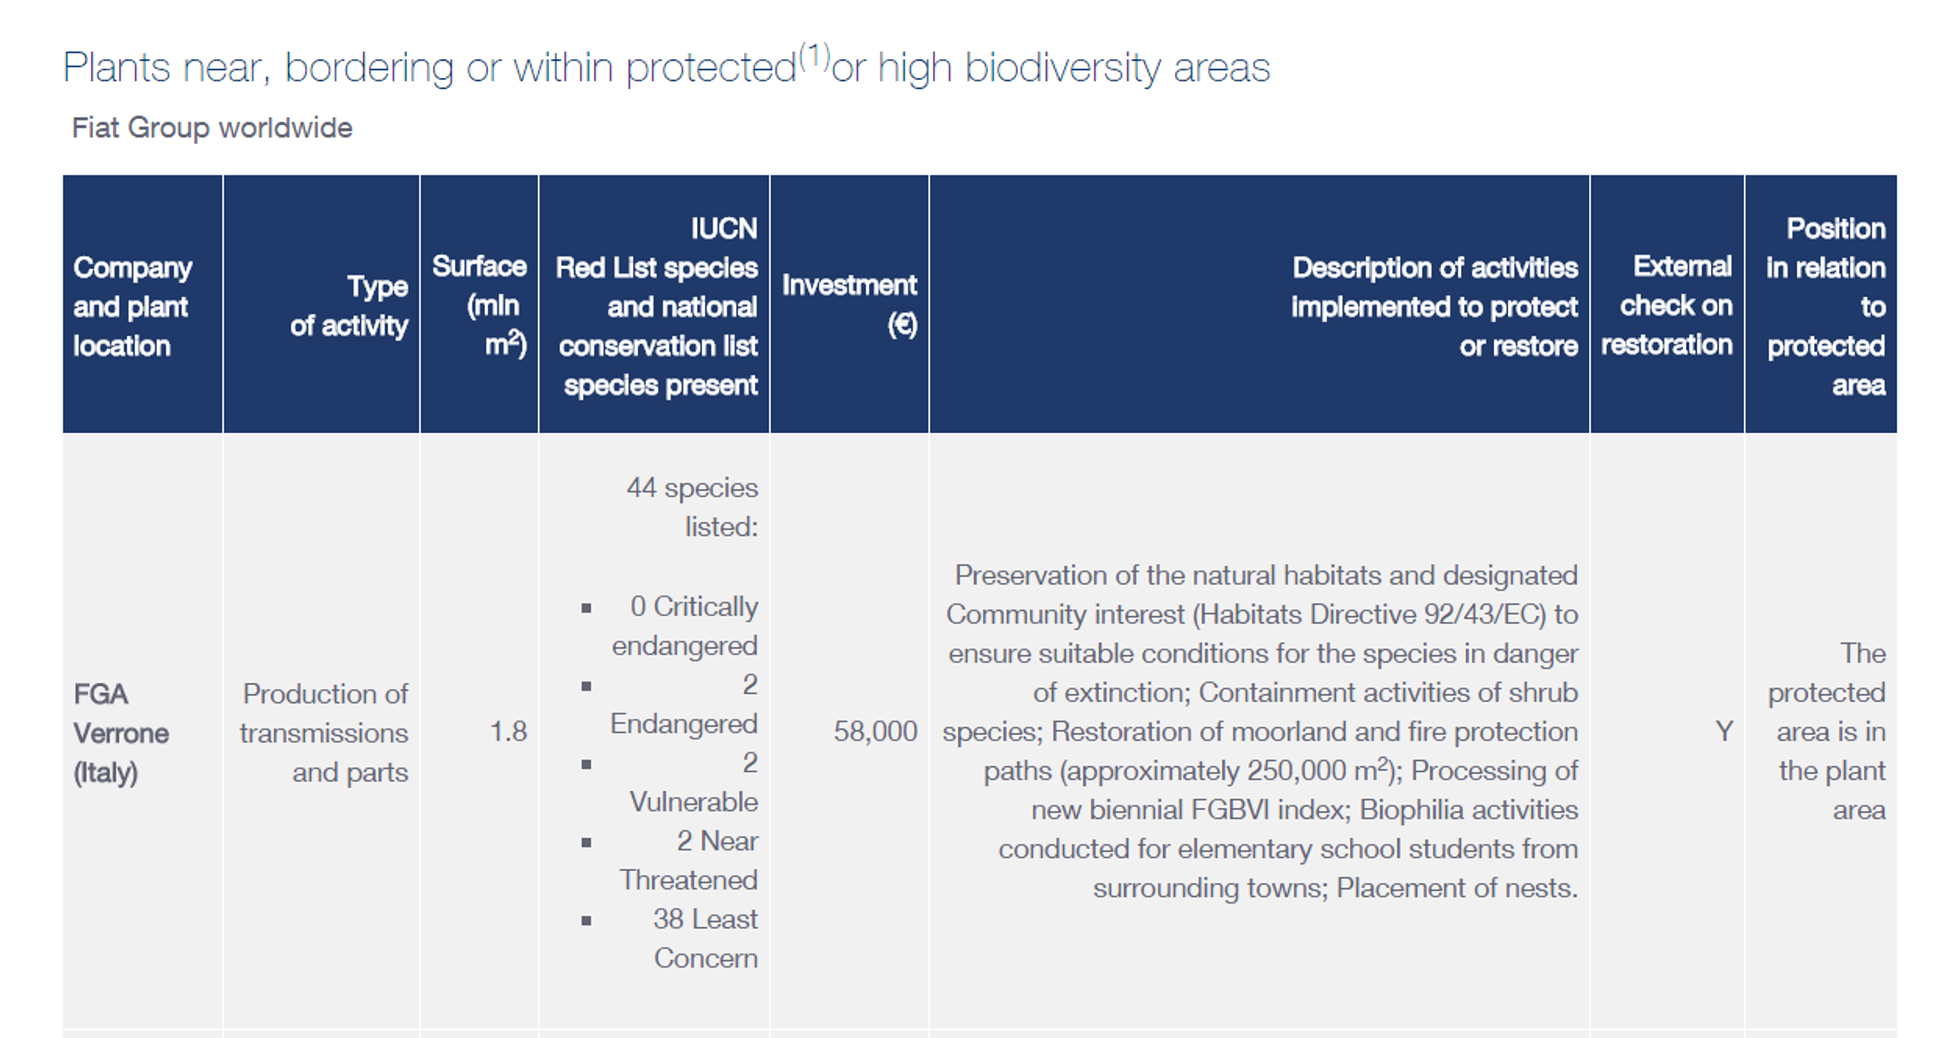 [85] [85]
Credit: enter credit here
Click on image to see a larger version.Text Version of Plants near, bordering or within protected or high biodiversity areas [86] |
| Habitat restoration/reclamation | G4-EN13 Report [87] |
Design for Sustainability
| Aspect of Design for Sustainability | GRI G4 definition | Example of the indicator as presented in CSR |
|---|---|---|
| Recycled inputs | G4-EN2 Report [88] | 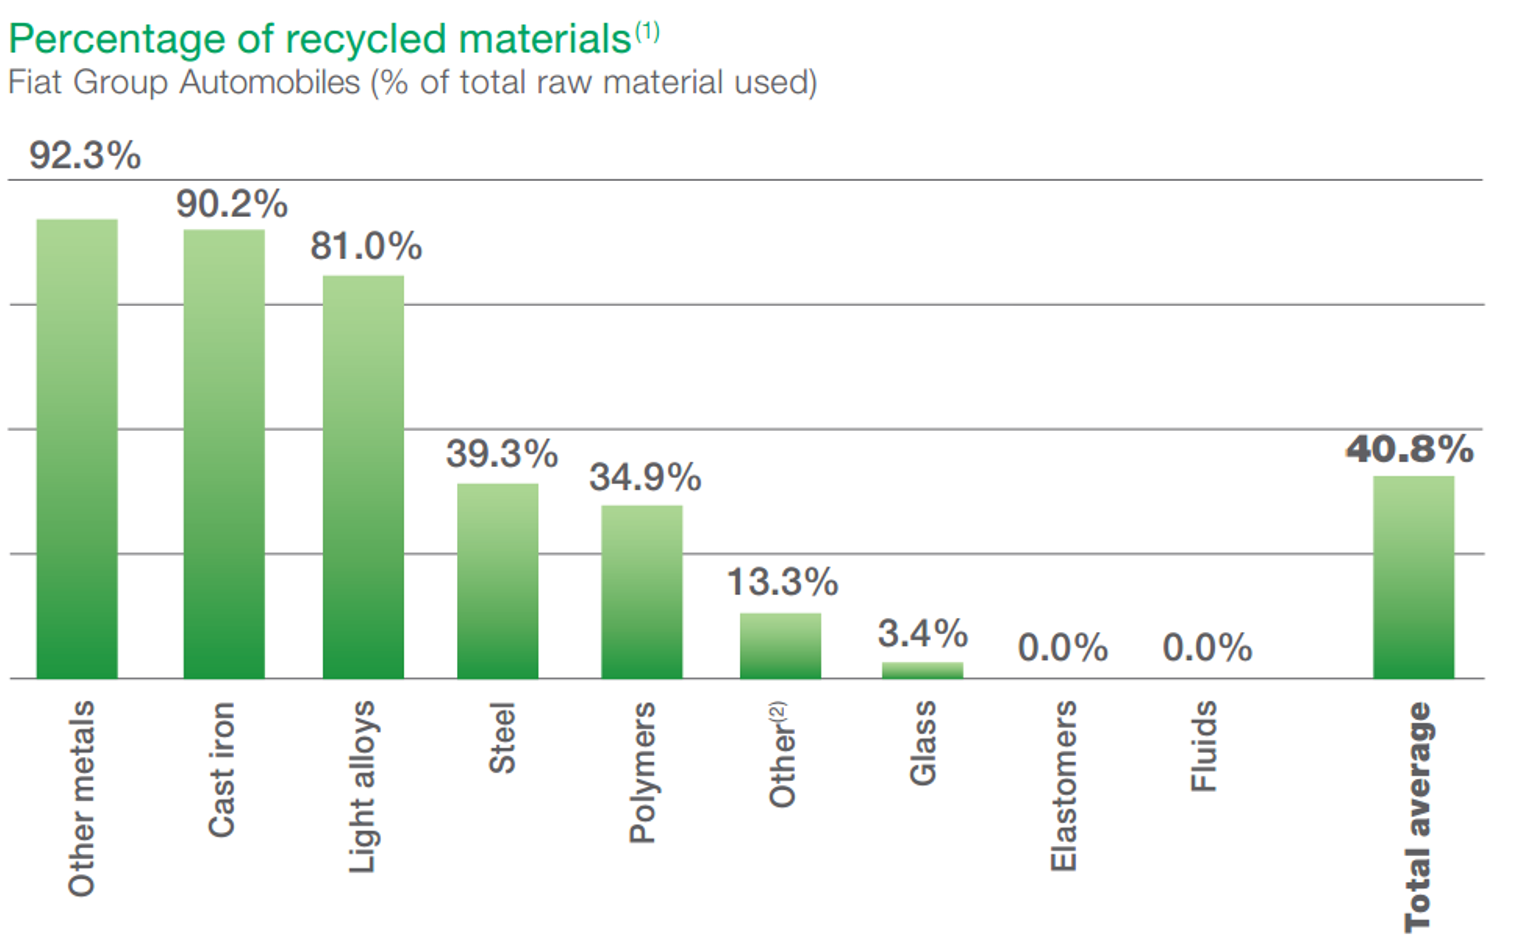 [89] [89]
Credit: enter credit here
Click on image to see a larger version.Text Version of Percentage of Recycled Materials Graph [90] |
| Material selection and sourcing | G4-EN1 Report [91] | 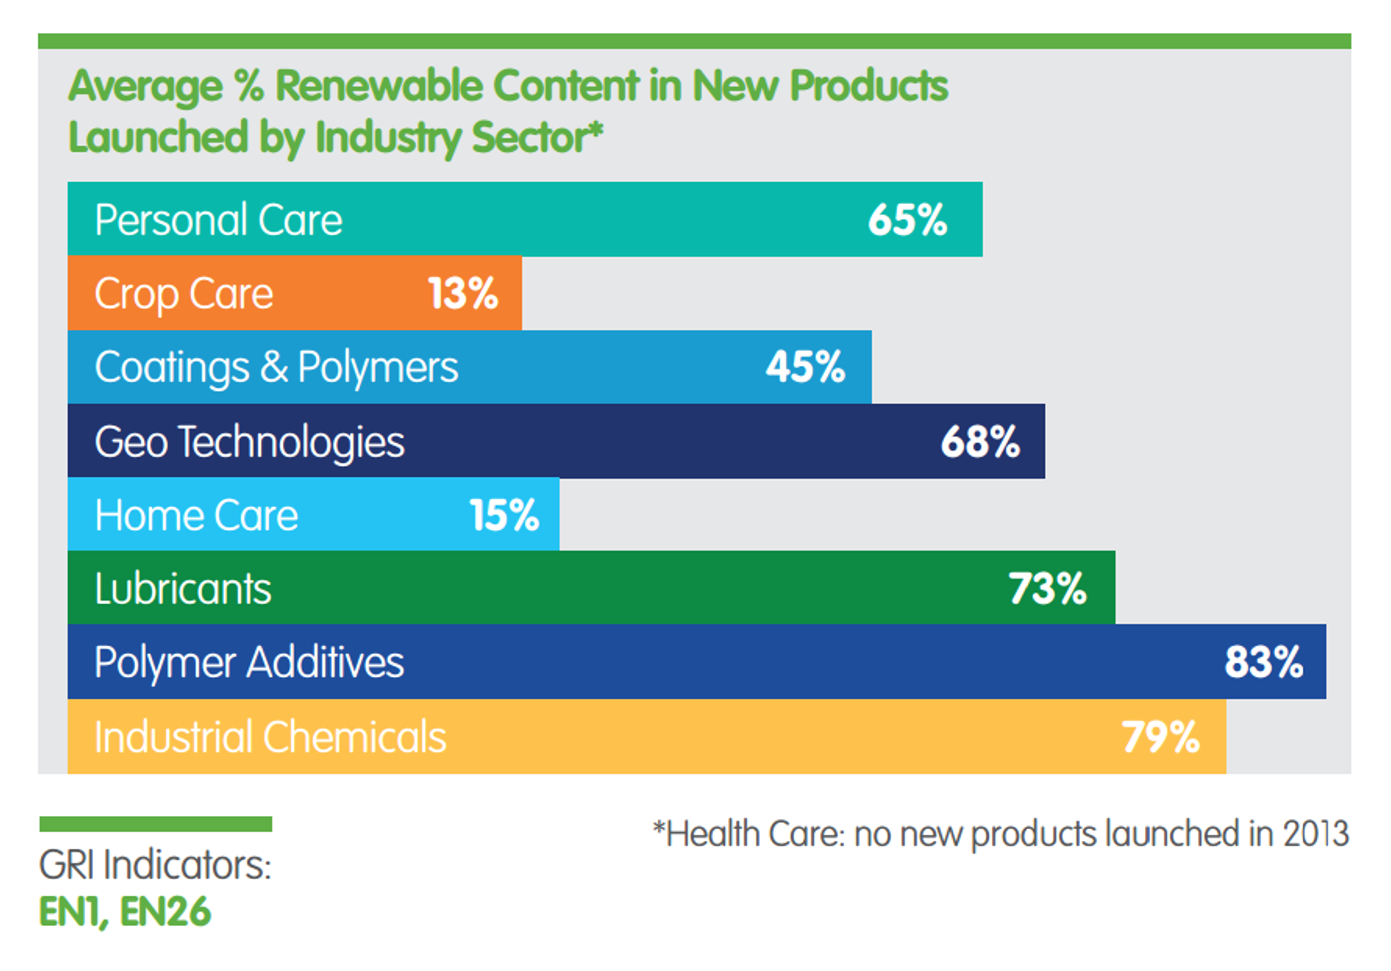 [92] [92]
Credit: enter credit here
Click on image to see a larger version.Text Version of Average % Renewable Content in New Products Graphic [93] |
Lifecycle Analysis/Mapping
| Aspect of Lifecycle Analysis/Mapping | GRI G4 definition | Example of the indicator as presented in CSR |
|---|---|---|
| Lifecycle impacts | G4-EN27 Report [94] | 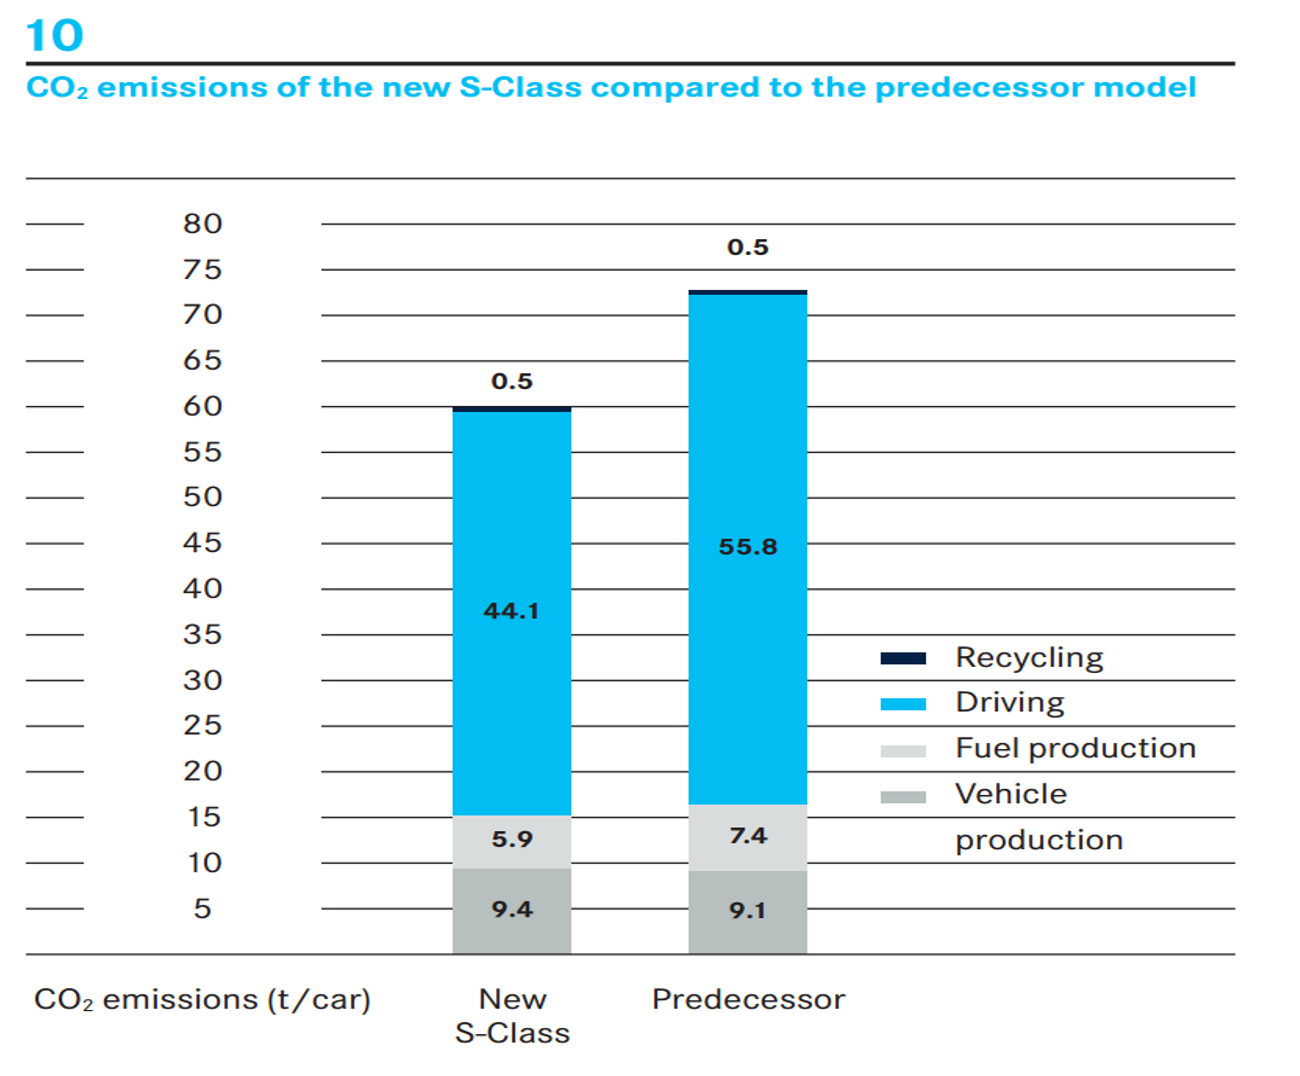 [95] [95]
Credit: enter credit here
Click on image to see a larger version.Text Version of CO2 Emissions of the New S-Class Compared to the Predecessor Model [96] |
| End of Life (EOL) | G4-EN28 Report [97] | 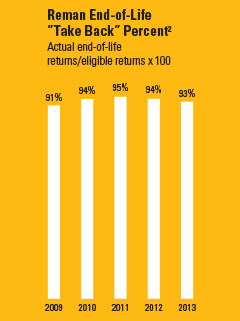
Credit: enter credit here
Text Version of Reman End-of-Life "Take Back" Percent Graphic [98] |

Sustainability Innovation Leaders - Planet
Sustainability Innovation Leaders - Planet
Beyond looking at the empirical measures or philosophies of sustainability, it can be highly valuable to examine the leaders (and failures) of sustainability in practice. The practice of sustainability has many component parts representing a very wide spectrum of ideas and material concerns, and with a seemingly infinite number of potential blends to be created in implementation:
The Emotional and the Rational
The Massive and the Minute
The Progressive and the Regressive
The Global and the Local
The Aspirational and the Tactical
A goal throughout this course will be therefore to understand both ends of the spectrum, map and distil the choices made by sustainability programs, and understand the opportunities created for the organization. As we understand more deeply, we may begin to understand how we can create spaces and niches for sustainability-driven innovation within any organization, and in an integrated and seamless way.
Below are three examples of initiatives within organizations leading the way in Planet-oriented sustainability initiatives, ranging from the billion-dollar Interface to the 47 employee Full Sail Brewing Co. From there, we will take a brief look into the component parts of each initiative, what Planet aspects they leverage, and how they uniquely create value for the organization.
Interface
Watch the following 16 minute video: The Business Logic of Sustainability. While it is not a "summary", it is a great story from an unlikely pioneer of sustainability.
Video: Ray Anderson: The business logic of sustainability (16:39)
Believe it or not, I come offering a solution to a very important part of this larger problem with the requisite focus on climate. And the solution I offer is to the biggest culprit in this massive mistreatment of the Earth by humankind and the result in decline of the biosphere. That culprit is business and industry, which happens to be where I have spent the last 52 years since my graduation from Georgia Tech in 1956. As an industrial engineer, come aspiring and then successful entrepreneur. After founding my company Interface from scratch in 1973, 36 years ago to produce carpet tiles in America for the business and institution markets and shepherding it through startup and survival to prosperity and global dominance in its field, I read Paul Hawkins' book, The Ecology of Commerce: The Summer of 1994. In his book, Paul charges business and industry as, one, the major culprit in causing the decline of the biosphere, and two, the only institution that is large enough and pervasive enough and powerful enough to really lead humankind out of this mess. And by the way, he convicted me as a plunderer of the Earth. And I then challenged the people have interfaced my company, to lead our company in the entire industrial world to sustainability, which we defined as eventually operating a petroleum-intensive company in such a way as to take from the Earth only what can be renewed by the Earth naturally and rapidly, not another fresh drop of oil, and to do no harm to the biosphere.
Take nothing, do no harm. I simply said, If Hawken is right in business and industry must lead, who will lead business and industry? Unless somebody leads, nobody will. It's axiomatic. Why not us? And thanks to the people of Interface, I have become a recovering plunderer. I once told a Fortune magazine writer that someday people like me would go to jail, and that became the headline of a Fortune article that went on to describe me as America's greenest CEO. Ceo. From plunderer to recovering plunderer to America's Greenest CEO in five years. That frankly was a pretty sad commentary on American CEOs in 1999. Asked later in the the Canadian documentary, The Corporation: What I meant by the go to jail remark, I offered that theft is a crime, and theft of our children's future would someday be a crime. But I realized for that to be true, for theft of our children's future to be a crime, there must be a clear demonstrable alternative to the take, make, waste industrial system that so dominates our civilization and is the major culprit stealing children's future by digging up the Earth and converting it to products that quickly become waste in a landfill or an incinerator.
In short, digging up the Earth and converting it to pollution. According to Paul and Anne Eilish and their well-known environmental impact equation, impact, a bad thing, is the product of population, affluence, and technology. That is, impact is generated by people, what they consume in their affluence, and how it is produced. I know the equation is largely subjective. You can perhaps quantify people and perhaps quantify affluence, but technology is abusive in too many ways to quantify. So the equation is conceptual. Still, it works to help us understand the problem. So we set out at interface in 1994 to create an example, to transform the way we made carpet, a petroleum-intensive product for materials builds as well as energy, and to transform our technologies so they diminished environmental impact rather than multiplied it. Paul and Anne Ehrlich's environmental impact equation, I is equal to P times A times T. Population, affluence, and technology. I wanted interface to rewrite that equation so that it read I equal P times A, divided by T. Now, the mathematically minded will see immediately that T in the numerator increases impact, a bad thing, but T in the denominator decreases impact. So I asked what would move T, technology from the numerator, call it T1, where it increases impact, to the denominator.
Call it T2, where it reduces impact. I thought about the characteristics of first industrial revolution T1 as we practiced it in the face, and it had the following characteristics: extractive, taking raw materials from the Earth, linear, take, make, waste, powered by fossil fuel-derived energy, wasteful, abusive, and focused on labor productivity, more carpet per man hour. Thinking it through, I realized that all those attributes must be changed to move T to the denominator. In the new industrial revolution, extraction, extractive must be replaced by renewable, linear by cyclical, fossil fuel energy by renewable energy sunlight, wasteful by waste free, and abusive by benign and labor productivity by resource productivity. And I reason that if we could make those transformative changes and get rid of T1 altogether, we could reduce our impact to zero, including our impact on the climate. And that became named the interface plan in 1995 and has been the plan ever since. We have measured our progress very rigorously, so I can tell you how far we have come in the ensuing twelve years. Net greenhouse gas emissions down 82% in absolute tonnage. Over the same span of time, sales have increased by two-thirds and profits have doubled.
An 82% absolute reduction translates into a 90% reduction in greenhouse gas intensity relative to sales. This is the magnitude of the reduction the entire global technosphere must realize by 2050. To avoid catastrophic climate disruption, so the scientists are telling us. Fossil fuel usage is down 60% per unit of production due to efficiencies in renewables. The cheapest, most secure barrel of all there is, is the one not used through efficiencies. Water usage is down 75% in our worldwide carpet tile business, down 40% in our broadband carpet business, which we acquired in 1993 right here in California, city of industry, where water is so precious. Renewable or recycled materials in that 25% of the total and growing rapidly. Renewable energy is 27% of our total, going for 100%. We have diverted 148 million pounds, that's 74,000 tons of used carpet from landfills, closing the loop on material flows through reverse logistics and post-consumer recycling technologies that did not exist when we started 14 years ago. Those new cyclical technologies have contributed mightily to the fact that we have produced and sold 85 million square yards of climate-neutral carpet since 2004, meaning no net contribution to global climate disruption in producing the carpet throughout the supply chain, from mine and well-head, clear to end-of-life reclamation, independent, third-party certified.
We call it cool carpet, and it has been a powerful marketplace differentiated increasing sales and profits. Three years ago, we launched Carpet tile for the Home under the brand Floor, misspelled F-L-O-R. You can point and click today at floor. Com and have cool carpet delivered to your front door in five days. It is practical and pretty, too. We reckon that we are a We're about over halfway to our goal, zero impact, zero footprint. We've set 2020 as our target year for zero, for reaching the top, the summit of Mount Sustainability. We call this Mission Zero. Zero. And this is perhaps the most important fact that we have found Mission Zero to be incredibly good for business, a better business model, a better way to bigger profits. Here's the business case for sustainability from real-life experience. Costs are down, not up, reflecting some $400 million of avoided cost in pursuit of zero waste, the first face of Mount Sustainability. This has paid all the costs the transformation of interface, and dispels a myth to this false choice between the environment and the economy. Our products are the best they've ever been, inspired by design for sustainability and unexpected well-spring of innovation.
Our people are galvanized around the shared higher purpose. You cannot beat it for attracting the best people and bringing them together. And the goodwill of the marketplace is astonishing. No amount of advertising, no clever marketing campaign at any price could have produced or created as much goodwill. Costs, products, people, marketplace. What else is there? It is a better business model. And here's our 14 year record of sales and profits. There's a dip there from 2001 to 2003. A dip when our sales over a three-year period were down 17%, but the marketplace was down 36%. We literally gained market We understand we might not have survived that recession but for the advantages of sustainability. If every business were pursuing the interface plan, would that solve all our problems? I don't think so. I remain troubled by the revised Ehrlich equation, I equal P times A, divided by T2. That A is a capital A, suggesting that affluence is an end in itself. But what if we reframed Ehrlich further? And what if we made a, a lower case a, suggesting that it's a means to an end, and that end is happiness. More happiness with less stuff.
You know, that would frame civilization itself. Our whole system of economics, if not for our species, then perhaps for the one that succeeds us, the sustainable species, living on a finite Earth, ethically, happily, and ecologically in balance with nature and all her natural systems for a thousand generations or 10,000 generations, that is to say, into the indefinite future. But does the Earth have to wait for our extinction as a species? Well, maybe so, but I don't think so. At interface, we really intend to bring this prototyical, sustainable, zero footprint industrial company fully into existence by 2020. We can see our way now, clear to the top of that mountain, and now the challenge is in execution. And as my good friend and adviser, Amri Lovens, says, If something exists, it must be possible. If we can actually do it, it must be possible. If we, a petrol-intensive company, can do it, anybody can. Can. And if anybody can, it follows that everybody can. Hawken fulfilled business and industry, leading humankind away from the abyss. Because with continued, unchecked, decline of the biosphere. A very dear person is at risk here, frankly, at unacceptable risk. Who is that person?
Not you, not I. But let me introduce you to the one who is most at risk here. And I myself met this person in the early days of this mountain climb on a Tuesday morning in March of 1996. I was talking to our people as I did at every opportunity back then, bringing them along and often not knowing whether I was connecting. But about five days later, back in Atlanta, I received an email from Glenn Thomas, one of my people in the California meeting. He was sending me an original poem that he had composed after our Tuesday morning together. And when I read it, it was one of the most uplifted moments of my life because it told me, by God, one person got it. Here's what Glenn wrote, and here's that person, Most at risk, please meet tomorrow's child. Without a name and unseen face and knowing not your time or place. Tomorrow's child, though yet unborn, I met you first last Tuesday morning. A wise friend introduced us to, and through his sobering point of view, I saw a day that you would see a day for you, but not for me. Knowing you has changed my thinking, for I never had an inkling that perhaps the things I do might someday somehow threaten you.
Tomorrow's child, my daughter's son, I'm afraid I've just begun to think of you and of your good, though always having known I should. Begin, I will, to weigh the cost of what I squander, what is lost, if ever I forget that you will someday come and live here, too. Well, every day of my life since tomorrow's child has spoken to me with one simple but profound message, which I presume to share with you. We are each and everyone a part of the web of life. The continuum of humanity, sure, but in the larger sense, the web of life itself. And we have a choice to make during our brief, brief visit to this beautiful blue and green living planet, to hurt it or to help it. For you, It's your call. Thank you. It says to wait until 10:00 It only takes what it needs. It's powered from far away. It talks with the others.
With the Smart Grid, energy is more intelligent than ever. Now we can manage electricity more efficiently, save money by using energy at off-peak hours, and even distribute alternative energy from one part of the country to another, simply by listening to what the Smart Grid has to say.
It says it's sunny Arizona.
The Smart Grid, it's all around us.
The Insight
Ray Anderson's sustainability epiphany was the inspiration, and his position and conviction allowed him to apply significant resources to solving the problems of the carpet tile lifecycle. Regardless of whether it was guilt of a founder nearing retirement or the inspiration of a book, Ray Anderson devoted himself to creating a sustainable legacy.
The Opportunity
Creating an offering of "climate neutral carpet" to a primarily commercial building market. Importantly, the timing would be ideal, as this was happening when LEED, recycled materials, and sustainable sourcing in architecture were gaining significant headway. Interface would become the first sustainable carpet tile in a market where sustainable materials and surfaces were becoming a requirement.
GRI Planet Aspects
- Materials used by weight or volume [100](G4-EN1)
- Percentage of materials used that are recycled input materials [101](G4-EN2)
- Direct greenhouse gas (GHG) emissions (Scope 1) [51] (G4-EN15)
- Extent of impact mitigation of environmental impacts of products and services [102] (G4-EN27)
- Percentage of products sold and their packaging materials that are reclaimed by category [103] (G4-EN28)
Vision
Significant, and with its foundations in Ray Anderson himself. While much of the original vision for infinitely recyclable, "climate neutral carpet" may have started with Mr. Anderson, it became a serious engineering, chemical, and logistical challenge to execute. It would be fascinating to learn if the profit and market share gains experienced were part of the early Interface vision, or if they turned out to be fortunate byproducts of what might have otherwise been considered a sunk-cost program. It would be an interesting learning experience to see what kind of test or Beta program Interface could have been established to understand the gains they were walking into for their nearly half a billion dollar investment.
The Interface Mission is extremely lofty, but one on which the company has done significant work and devoted significant resources to help make happen. Interface describes its Mission as:
"What drives us? A positive vision of the future and the determination to make it come true. The moral courage to do what is right, despite all obstacles. An abiding commitment to show that sustainability is better for business. We believe that change starts with us and is transforming Interface from a plunderer of the earth to an agent of its restoration. Through this process of redesigning ourselves, we hope to be a catalyst for the redesign of global industry."
Innovation
Significant. After the establishment of their original ReEntry process to recycle used carpet into 100% recycled carpet tiles, it tackled the issue of used commercial fishing nets washing up on shores worldwide. It not only developed a process [104] to recycle this notoriously difficult material, but also partnered with the Zoological Society of London to establish a "community-based supply chain" by which communities in the Philippines could clear their beaches and reefs of the nylon nets while being paid for the material.
Storytelling
The Interface story has become one of the most hailed sustainability stories of the last 20 years, gaining attention everywhere from Forbes and the Wall Street Journal to Triple Pundit. The story of Interface has gone on to influence countless other businesses as to the possibilities of sustainability.
Achievement
Interestingly, Interface has not issued a CSR for some years, and is fairly limited on metrics. So despite spending millions on sustainability programs and gaining significant PR (as well as being a NASDAQ traded company), it does not disclose sustainability indicators.
Structure
Again, without a published CSR or real sustainability documentation, it can be difficult to evaluate the structure of their program.
The Secret
Most competitors (such as the Warren Buffet-owned Shaw Carpet) have closed the gap on recycled materials, and can offer the same level of recycled material. Interface has been able to hold much of its gains from its initial burst of growth as the first mover in recycled carpet.
Please watch the following 3:46 video.
Video: Worn Wear® Stories | Presented by Patagonia (3:46)
KEIRA HENNINGER (RUNNER): When you’re running 100 miles, you’re running for 21, 22, 23 hours, a lot of stuff can unravel when you’re out there running for a long time.
KEITH MALLY (SURFER): You put yourself in a situation where you really don’t think you’re going to make it, and somehow you do. And after a wave like that, beer tastes good, food tastes good.
TOMMY CALDWELL (CLIMBER): These rugged mountain environments are not made for life, there’s nothing living. There’s not even a speck of lichen.
KEIRA HENNINGER (RUNNER): I always say, going for a run clears your mind, but running an ultra clears your soul. I think I’ve completed 42 ultras and 5 hundred-mile races. Running gear is probably one of the most essential parts of running ultras, whether it’s being comfortable in the shorts and all the chafing in all the right places. I would never go start a 100 mile race without having worn a certain piece before. I’ve had these for about 2 years. These shorts have probably seen 5000 miles on them. These are like my handy-dandy best friends.
KEITH MALLY (SURFER): With modern day high-performance surfboards, you’re lucky if it lasts 3, 4, 5 months. This surfboard’s 9 years old and doesn’t have one single ding in it. I’ve taken that board to Indonesia, Canada, the Wedge, a trip to Fiji, the Cloud Break, Tahiti, the Chofu, Washington, I took it to Norway, and Iceland also. I just have confidence in that board, and the reason why because I know it so well. The amount of good waves I’ve had on that board it makes me smile when I think about it.
TOMMY CALDWELL (CLIMBER): Last January, with a good buddy of mine, Alex Honnold, we managed to traverse the entire FitzRoy massif. We climbed for four days, about 18 hours a day. Seven different major summits, 12,000 feet of vertical gain, groveling through cracks for days, just getting our arms in there. The reason that we can exist for days at a time is because the clothing that will make it work. Yeah. Beautiful. The most important thing is that morale is high. A lot of people when they’re intimidated, they just get scared. They want to go down. [Well, I am quite scared. And you know why? Because of this.] It’s hard to articulate exactly why one piece of clothing becomes a favorite. I think the experiences you’ve had, like if you’ve used it over and over again and it’s worked for you, you just know it’s going to work.
KEITH MALLY (SURFER): I mean naturally you don’t even think about the board, because you trust it so much.
TOMMY CALDWELL (CLIMBER): There’s a little bit of superstition involved.
KEIRA HENNINGER (RUNNER): I tend to have an emotional connection to certain pieces.
TOMMY CALDWELL (CLIMBER): You like, "oh man, I’ve worn this jacket on all my biggest climbs for the last couple of years, I better bring it or I might not descend."
KEIRA HENNINGER (RUNNER): These shorts I have won 8 races in.
TOMMY CALDWELL (CLIMBER): I fell in love with this jacket and I’ll continue to wear it. Now it’ll always be attached to this climb which was one of the most rich experiences of my life.
KEIRA HENNINGER (RUNNER): They’re getting a little, they're getting worn.
The Insight
In the face of increasing consumerism, immediate gratification, and disposable products, there is an opportunity to own a space around authenticity, durability, and modesty. Patches and repairs to an item of clothing should be considered a badge of honor from a life well lived.
The Opportunity
To own the space, and in the process, help justify the price premium of their well-constructed, sustainably sourced clothing. There is also an opportunity to distance themselves from other outdoor brands (i.e., North Face) which have lost their authenticity to some extent. Patagonia can provide information, materials, and support to those who seek to repair their clothing as opposed to throwing it out.
GRI Planet Aspects
Vision
Patagonia Mission Statement: "Build the best product, cause no unnecessary harm, use business to inspire and implement solutions to the environmental crisis."
"One of the most responsible things we can do as a company is to make high-quality stuff that lasts for years and can be repaired, so you don’t have to buy more of it. The Worn Wear® program celebrates the stories we wear and keeps your gear in action longer to take some of the pressure off the planet."
Innovation
Many companies tout the durability of their clothing, but very few actively give you the tools and support to repair their clothing. Fewer still promote purchasing fewer of their products in the headlines of their pages.
If any additional evidence is needed that they are serious about this, Patagonia actively promotes a Black Friday "Worn Wear Swap" at eight of its flagship locations where you can bring in your used Patagonia and swap with others. Not many stores would devote the largest retail day of the year to encouraging used clothing.
Storytelling
Everywhere. The initiative is excellent at not only unearthing stories, but in the process reinforcing the bond between a piece of clothing and an emotional or memorable experience. They have a dedicated blog for the Worn Wear program [106], and you can easily see how customers will wax poetic about the memories they have of their favorite Patagonia item (and furthermore, reinforcing the durability of Patagonia used for years in rough conditions).
Achievement
While it would be nice to have a metric (i.e., "200,000 Patagonia garments NOT sold since 2012"), the Worn Wear program is more of a message or social imperative than anything. Participation in the program does not involve the purchasing or signing up for anything, so it would be hard to measure. It does capture quite a bit of vicarious achievement through the rich stories shared by customers about the adventures of their faithful Patagonia jacket or shirt.
Structure
Very little, which is keeping with the Patagonia sustainability ethos of initiative- as opposed to metric-driven sustainability reporting. While they lack in structure, they far exceed in framework and execution. Patagonia has offered this statement as to why they do not have a structured CSR:
"The advantage to the reader/user of sustainability reports that follow the GRI framework is the ability to easily compare data from different companies. The disadvantage: a sustainability report, like an annual report, can be a dull read held forth in specialized language that clouds as much as it reveals. Because we recognize the advantages of easy comparability, we are investigating the possibility of importing data we collect for the Footprint Chronicles into a GRI framework (and with as much plain speaking as possible). Sustainability reports can be expensive for a company of our relatively small size to research and produce and can only supplement, not substitute, for the Footprint Chronicles. We want to continually raise rather than lower the quality of the conversation we’ve created with our stakeholders over the past years."
The Secret
The Worn Wear program does a fantastic job of justifying a premium price and deepening the brand experience through storytelling and authenticity. It's in keeping with the Patagonia platform of 'a consumer brand that rejects consumerism.'
Full Sail Brewing Co.
Watch the following 2:44 minute video on Beer, Water, and Responsibility.
Video: Full Sail Brewing: Beer, Water & Responsibility (2:46)
[MUSIC PLAYING]
JAMIE EMMERSON: My grandmother said being responsible is doing the right thing when no one's looking. And it's a choice we make as an independent company working and living here in Hood River. We want people to continue to be able enjoy the natural resources of the gorge just as we do.
In 1987 we started brewing in the fruit juice press plant of the Diamond Fruit cannery building. Part of our idea at the time was to recycle these old buildings as opposed to demolishing them and build something new, and trying to save those resources. The benefit to being in Hood River was that it also had a wonderful water source. Cold Spring and Stone Spring up in the slopes of Mount Hood feed the city of Hood River, and in turn, our brewery.
Classic brewing cities are known for their water because beer is mostly water. And Hood River's water source is impeccable. Because we're an employee-owned company, we're able to invest in projects that reflect our values and priorities, like using recycled glass, recycled packaging, wind power. And the outcome for the brewhouse is the Meura mash filter.
As brewers, we need to address our water consumption is our number one priority. And the mash filter is a reflection of our responsibility to the environment. Also, the outcome from the brewhouse is the ability that the Meura provides, such as dry spent grains. Those spent grains are recycled into cattle feed, so used to feed dairy cows, which make cheese for our cheeseburgers in our pub.
The Meura 2001 is an interesting machine because it replaces a traditional ladder tug, which is essentially a giant strainer. The biggest benefits the Meura provides are that it's fast, efficient, makes very dry spent grains, and most importantly, very high quality beer. Last year, we were able to reduce the number of truckloads of spent grain by 77 trucks more than one a week. So that was just reducing the amount of diesel, reducing the amount of truck hauling on the highways, all side benefits of reducing water.
Last year, we averaged a savings per brew of over 800 gallons, so more than a million gallons of water savings. Most craft breweries use between 6 to 10 gallons of water to brew every gallon of beer. Our current average using the Merua is 2.5 gallons for every gallon of beer, quite a substantial reduction. After 25 years of living the dream, brewing in beautiful Hood River, Oregon, it's very important for us to be good stewards of the environment so that other people can enjoy this area as much as we do.
The Insight
If you listen to what Jaime says in the video, it would appear that their world-leading water efficiency not only stems from a belief of responsibility, but also in remaining a welcome member of the Hood River community (this is an example of securing "license to operate," a topic we will address in a later lesson).
There may certainly be some technical prowess and innovations beyond those Jaime mentions, considering Full Sail uses only about 25% of the water per barrel of major breweries, and about 60% of the water per barrel of the much-touted sustainable brewer, New Belgium Brewing. In fact, Full Sail was named "Craft Brewer of the Year" by Beverage World Magazine [108], for their “sustainable stewardship, quality, consistency and operational ingenuity.”
The Opportunity
As mentioned in a Dec 10, 2010 interview with Jen Boynton of Triple Pundit, we can see a great example of operational sustainability:
What’s your biggest sustainability challenge?
As a brewer, water and waste water are our biggest issues. That is why we are so committed to reducing our usage as much as we can. Water use also impacts waste treatment, energy use, truck hauls, etc.
Any new sustainability projects in the pipeline that have you excited?
We have just installed a new piece of brewing equipment called a Mash Filter, and it will save us nearly a million gallons of water yearly enabling us to lower our water to beer ratio. This savings also extends to the number of truckloads (~70) of material that won’t be coming and going from the brewery on a yearly basis. And I haven’t even got my arms around the savings in heating/cooling/electricity usage yet, but all will be reduced.
GRI Planet Aspects
- Total water withdrawal by source [109] (G4-EN8)
- Water sources significantly affected by withdrawal of water [110] (G4-EN9)
- Percentage and total volume of water recycled and reused [111] (G4-EN10)
- Materials used by weight or volume [100] (G4-EN1)
- Extent of impact mitigation of environmental impacts of products and services [102] (G4-EN27)
Vision
From Boynton interview:
What are your plans for growth, if any?
We believe it is important to grow our business in an organic and sustainable way. We only look at opportunities that will allow us to build our business year after year. Because we are a small, independent brewery in a very competitive environment, we need to be sure that our business decisions are responsible and careful of our limited resources.
Innovation
While Full Sail's sustainability reporting is basic and informal, it certainly befits a small company. More importantly, Full Sail has invested its innovation dollars on equipment and infrastructure that will make a tangible difference in water consumption, namely the investment in the fairly exotic Meura mash machine mentioned in the video.
Storytelling
Full Sail marketing and CSR does not have the gloss or reach of a larger company with creative departments and dedicated sustainability staff, but Full Sail certainly makes up for that in substance and a great sustainability story of 'the little brewer who could.' They do quite a bit of storytelling around sustainability in their blog [112], as well.
Achievement
The fact that they are leading the world in water efficiency for a brewery is a major achievement, in and of itself.
Consider Full Sail to be a perfect case of a company NOT chasing the White Whale... water is important to the business, community and founders, so Full Sail has invested its full consideration and resources on minimizing impacts to the Hood River. They have certainly done well in that regard, and more importantly, they have set the standard and openly share their water conservation measures and advice with other brewers via "Ask Jaime." [113]
Structure
Very little, but they do not have a formal CSR. Again, like sustainability, in a resource constrained setting, we must make choices, and Full Sail is spending it on improving performance as opposed to talking about the improved metrics.
The Secret
Leading the world in water efficiency, wholly-owned by its 47 employees, and holding more than 130 Gold Medals for its beers, Full Sail is an example of what successful sustainability in a small business can look like.
Closing Remarks
Closing Remarks

No house should ever be on a hill or on anything. It should be of the hill. Belonging to it. Hill and house should live together each the happier for the other.
- Frank Lloyd Wright
In the first three weeks of this course, we may think of ourselves as the architect surveying the site. Our goal is to understand the sustainability landscape, its functions, and as much nuance as possible at this point. By closely examining the sustainability landscape as it exists today, we may only begin to find interesting areas and niches upon which to build our initiatives. As we explore sustainability further, participate in discourse and discussion, and examine research techniques, the goal is to provide the tools by which you can identify specific opportunities and placements for the foundations of innovation. From there, we begin to understand, quite literally, the architecture of innovation and how to design.
Recapping, our goals for this lesson are to:
- discern Planet-centric metrics and initiatives within a Corporate Sustainability Report;
- evaluate an organization's approach to Planet issues through the lens of their stated Vision, Mission and Values;
- compare established and emerging environmental standards and initiatives;
- appraise how sustainability may reduce the environmental risk profile of an organization;
- discern "badge proliferation" and marketing from meaningful third-party certifications.
In service of deepening these goals, our case this week is applying our learning through the examination of two leading international outdoor brands, each with its own unique context and approach to sustainability. Again like the architect, our early cases are a type of 'guided design study' so that we may evaluate finished designs to better understand how–and why–they may have been constructed.