4 - Identifying Opportunities in Sustainability I
Lesson 4 Overview
Lesson 4 Overview
Summary
Where we have been doing some amount of tablesetting or precursor in the first three Lessons, this week we will begin into what I consider the beating heart of modern Sustainability: Understanding realities versus fabrications.
The reason I place so much emphasis here is that having a well-informed and nuanced understanding is what will allow you to find opportunity if developing a new offering. Conversely, if you are in an organization in the Corporate Sustainability function, you will be able to understand how your program actually delivers, how it can be improved, how it can better deliver on the organization's VMV, and potential weaknesses.
I say this in all seriousness: Without the ability to research and understand the actual performance of a sustainability program, one is nothing more than a 'Public Relations Parrot,' broadcasting sustainability words and stories without any real caring for the actual underlying performance or improvement. And frankly, my hope by this point in the course is that I have helped to show you the range of ways CSRs can warp and hide realities.
Now, we will learn how to very specifically prosecute our own research in service of understanding Sustainability. We will be able to differentiate 'hidden gems' of sustainability from those which are essentially over-hyped PR efforts.
Learning Outcomes
By the end of this lesson, you should be able to:
- critically evaluate sustainability filings and stated strategies through the lens of an organization's stated mission, vision, and values;
- articulate the role GRI plays–and does not play–in an organization's sustainability reporting;
- analyze filings through omission, indicator, narrative, and commission analyses;
- propose public sustainability filings as a platform for innovation and competitive advantage;
- discern what the major filings do–and do not–require an organization to do to comply.
Lesson Roadmap
| To Read | Chapters 7 and 8 (Keeley, et al.) Documents and assets as noted/linked in the Lesson (optional) |
|---|---|
| To Do | Case Assignment: Finding opportunity
|
Questions?
If you have any questions, please send them to my axj153@psu.edu [1] Faculty email. I will check daily to respond. If your question is one that is relevant to the entire class, I may respond to the entire class rather than individually.
Critical Analysis of Public Filings
Critical Analysis of Public Filings
Finding Areas of Opportunity
In finding areas of opportunity, undertaking competitive intelligence or understanding trends, for decades the perennial resource was to pore through public filings, most notably a company's last five years of 10-K reports. These reports provide a comprehensive view of a company at a point, its financial health, areas in which it may be investing through either acquisitions or R&D efforts, and management's view of risks which could have a significant bearing on the success of the company.
Remembering the importance of materiality in publicly traded companies and their disclosures to investors, these 10-Ks act as a bit of a "truth serum" in many ways, laying bare many statements and facts which a company would otherwise be reluctant to disclose. For example, Section 1A of the 10-K is a significant disclosure of "Risk Factors" the organization faces. Here is an excerpt from the risk factors section of Tesla Motors' 2014 10-K [2]:
If we fail to manage future growth effectively as we rapidly grow our company, especially internationally, we may not be able to produce, market, sell and service our vehicles successfully.
Any failure to manage our growth effectively could materially and adversely affect our business, prospects, operating results and financial condition. We continue to expand our operations significantly in North America as well as in Europe and Asia. Our future operating results depend to a large extent on our ability to manage this expansion and growth successfully. Risks that we face in undertaking this global expansion include:
- finding and training new personnel, especially in new markets such as Europe and Asia;
- controlling expenses and investments in anticipation of expanded operations;
- establishing or expanding sales, service and Supercharger facilities in a timely manner;
- adapting our products to meet local requirements in countries around the world; and
- implementing and enhancing manufacturing, logistics and administrative infrastructure, systems and processes.
We intend to continue to hire a significant number of additional personnel, including manufacturing personnel, design personnel, engineers and service technicians. Because our high-performance vehicles are based on a different technology platform than traditional internal combustion engines, we may not be able to hire individuals with sufficient training in electric vehicles, and we will need to expend significant time and expense training the employees we do hire. Competition for individuals with experience designing, manufacturing and servicing electric vehicles is intense, and we may not be able to attract, assimilate, train or retain additional highly qualified personnel in the future, the failure of which could seriously harm our business, prospects, operating results and financial condition.
In fact, this is only one of fifty-eight specific, named risks to the business along with nine more common stock risks Tesla presented in its 10-K in this year. This is not uncommon for 10-Ks.
A Deeper Examination of a Single Stated Risk
For example, let's consider just one of the implications from that single Tesla risk statement [emphasis is mine]:
Because our high-performance vehicles are based on a different technology platform than traditional internal combustion engines, we may not be able to hire individuals with sufficient training in electric vehicles, and we will need to expend significant time and expense training the employees we do hire. Competition for individuals with experience designing, manufacturing and servicing electric vehicles is intense, and we may not be able to attract, assimilate, train or retain additional highly qualified personnel in the future, the failure of which could seriously harm our business, prospects, operating results and financial condition.
Now, consider the following:

- In its second year of production, Tesla would already create a significant market share lead [4] in the large luxury segment
- Delivered 33,000 units in 2014, a 47% increase over 2013
- Forecasts 50% unit growth again in 2015
- Doubled its number of workers in one year, from 5,859 in 2013 to 10,161 in 2014 [5]
- Preparing to release a $35,000 Model 3 in 2017 [6], which, if current Federal incentives are extended, will equate to a MSRP of $27,500
So, we have Tesla in dire need of technicians, facing explosive growth, and selling cars loaded with new to the world technologies... and a technician training pipeline completely unprepared and lacking leadership.
Two of the major automotive training institutes, WyoTech and Universal Training Institute, have courses ranging from core automotive technician training to "Motorsports Chassis Fabrication," but not a single course for hybrid or electric vehicle service.
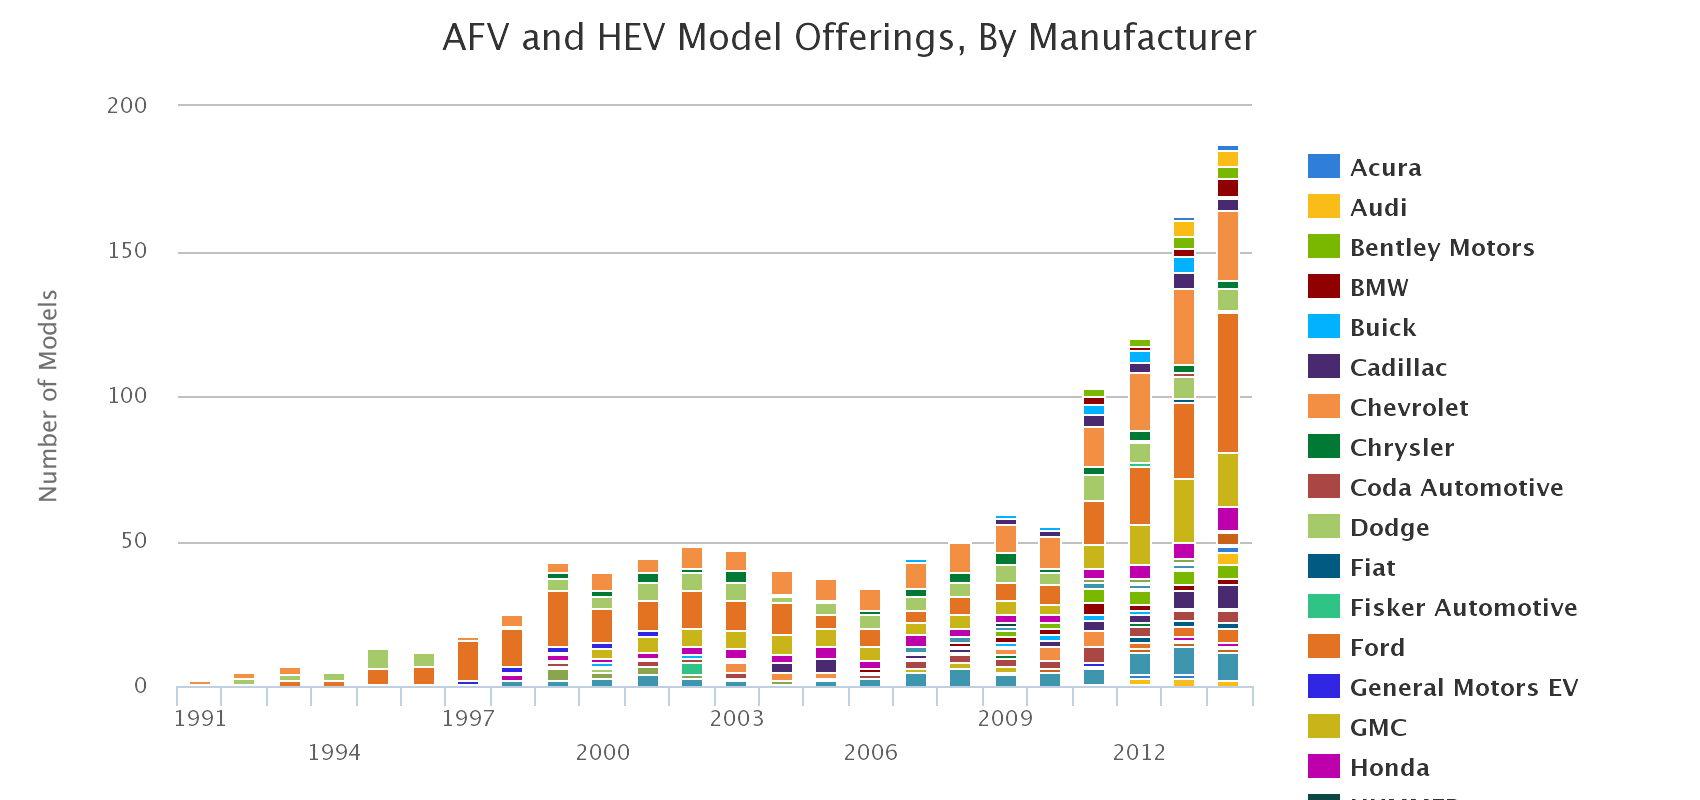
Furthermore, it took ASE (The National Institute for Automotive Service Excellence, the major technician testing and certification body in the US) until 2015 to have even a single tech certification for hybrid or electric vehicles. [7] Consider that Toyota has been selling the Prius in Japan since 1997 (the US since 2001), and the number of alternative fuel vehicle models sold in the US is rapidly approaching 200.
If the tech sector took the same glacial approach to training as the auto sector has in training on hybrid and electric technology, today's students would be prepared to enter a market... using Windows 98. (If you don't know what Windows 98 is, consider it was released in 1998... a time then you had to actually go to a store to buy physical software contained in a highly-protected plastic security box and AOL was a very successful company.)
I offer this analysis not as some massive proponent of Tesla, electric vehicles, or any other cause, but as an impartial view of the opportunity laid before us through a brief analysis of public filings. I believe you will find that as we become proficient in the critical analysis of financial and sustainability filings we will find insights few others may have. For example, as of the time of this writing, I was unable to find a single article or blog post written about the coming demand for electric vehicle and hybrid technicians, but literally hundreds on the explosive growth of Tesla and electric vehicles.
If we are to view ourselves as innovators, investors, and leaders concerned with sustainability, we must become proficient at finding and discerning opportunity–wherever it may be.
Critical Analysis of Filings as a Defensive tool
As we will examine in this Lesson and in much of the course from this point, "innovation" is far too often coupled with the idea of revolutionary, new-to-the-world offerings. What we will see is that the opportunities for innovation we find may be quietly incremental, but will still have the potential to lead the market and fill important sustainability needs. Upon hearing "sustainability-driven innovation" many may think of "Tesla," but we will see that much of the opportunity may look more like 'training technicians to meet Tesla's emerging needs in an exploding electric vehicle market.' In this case, the defensive facet from our critical analysis comes into play when considering there are frankly tens, if not hundreds, of major national automotive training schools which could have been training on this technology years ago.
Consider also other defensive positions from this type of analysis: your organization may be an existing supplier to a publicly-traded company, and you should therefore be first in line to read every 10-K and CSR they release. Every one of these filings will represent opportunity for incumbent suppliers to grow based on the stated needs of the company... or potentially find themselves at risk to newly identified needs and trends. Just as Tesla discusses risks in its 10-K, it also discusses supplier relationships, needs, and other issues important to the success of the company. Especially in the case of sustainability filings, it will identify specific needs and struggles... all of which would be an excellent opportunity for an existing supplier to deepen their relationship.

The Clouds and Roots Model of Strategy
The Clouds and Roots Model of Strategy
Understanding a Common Failure in Creative and Strategic Work
Please allow me to tell you a story, one which has been repeated time and time and time again in some of the most respected companies and creative agencies in the world; unfortunately, it is also a central weakness in sustainability as it exists today.
Far too often, in a campaign brief, business case, or frankly any strategic document, people enjoy hearing themselves speak. These words may be anything from the elaborate strategic designs of a visionary creative director, to the fevered attempts of a manager to make a mundane product launch plan seem interesting. Regardless of the cause, for some reason, strategy brings out a certain overstated, semi-Shakespearian manner of speaking in those writing the brief.
These presentations tend to go something like this:
"We seek. We strive. We live. People every day are looking for something. Searching for something they are missing. Searching for a piece of themselves. It happens to us all. It defines the human condition.
In our campaign, we will fill this deep yearning in our customers' lives. We will craft a physical tether–a link–representative of their connections to their family AND their possessions. Possessions which help them reach their family. We will blanket them in the comfort and security of being able to find keys and live their lives without uncertainty.
Behold: KeySeekr. The yellowest keychain in the world.
We will build the yellow color of our KeySeekr high-visibility keychain into the next Tiffany Blue. The campaign will secure our position in the lives of key-minded individuals and create an unbreakable bond of trust and an indelible mark on their lives. In our "Secure Yellow" campaign, we will show people that they will find the key to happiness... and it will be on a KeySeekr keychain."
Vision is an essential component of innovation and any new effort, and it is always a struggle to keep the vision alive. Perhaps the KeySeekr product and campaign may indeed deliver on those lofty goals. It is not ours to judge, but to understand. There may be, in fact, reams of research and insight work the KeySeekr team undertook that led them to this campaign platform (alternatively, not).
Regardless of the product or campaign, what we need to understand is how that vision will make its way into the actual customer experience: campaign messages and tactics, design cues, interactions, store atmospherics. And then, without any biasing influence or priming, we want to hear customers reflecting.
There are two thoughts to always keep in mind:
Everything sounds good in a brief. Everything.
It all means nothing until the strategy is reflected in tangible outputs, and furthermore, until we can test with customers. Many times, it may actually be beneficial to not even hear the brief so that you can interpret in an unbiased way.
How This Strategic Failure Presents Itself in Sustainability-Driven Innovation
Sustainability, by its very nature and intent, is highly aspirational. There aren't too many fields where the crux of your job is to 'make things better for the community and workers, the planet, and our company.' Similarly, when we seek to create truly sustainability-driven innovations, much of the same aspiration and good intentions are at play, as well... we are seeking to create offerings that make the world a better place while allowing us to provide for ourselves and our families.
But. The stronger the aspiration and vision is, the higher the potential to be disconnected from various stark realities:
- Perhaps the strategy is beautiful and relevant and the product delivers, but it costs 4000% more than similar products while delivering marginal sustainability benefit.
- Perhaps the deeply aspirational goals of your program are not shared by the overwhelming majority of customers.
- Perhaps the sustainable vision of the team is not yet feasible given current technological constraints.
These stark realities come in a wide range of forms in sustainability, and this is why our critical analysis is so important: so that we may see if an organization is truly delivering on an especially set of goals, or if it is simply a veneer of good copywriting and design.
A Mechanism to Visualize and Map these Strategic Failures
The Clouds and Roots Model is intended to help us take those lofty aspirations and anchor them in the realistic and tactical experiential cues of our offering or program. What is interesting is that with some practice, you may find that this model can be applied to virtually any creative challenge... from logo design to redesigning a room in your home. It is indeed that flexible.
This may all sound a bit esoteric at the moment, but I promise it will not only make sense as we use it, but that we will use this model in very tangible, practical ways as we create and test offerings.

In any case, we can map continuity in strategy by linking three elements:
The Clouds: The aspirational and emotional end benefits we seek to create.
- This may directly tie to the Vision, Mission, and Values of the program, the emotional experience we want the customer to have from our offering, or the aspiration for the brand.
- Regardless of the intent, the cloud is about big ideas. Things we are passionate about as an organization or as people.
- Much of the aspiration we feel in sustainability can be located here... the ideas around making the world better, and 'doing well by doing good.'
- In many cases, the Clouds tend to be neglected or poorly defined because we tend to focus on executional details and creating 'what's in the box.'
The Trunk: The unifying theme or idea.
- The trunk is the idea that brings it together. The central theme. The first idea you want people to say when describing the offering.
- This may be a theme which is used only internally at the organization, or a customer-facing tagline.
- It acts as a path for perception, if you will. It is clearly defined in the middle, but diffuses at each end. This allows room for people - customers - to interpret and enrich with their own interpretations.
- Like a tree, the strongest campaigns have a single, straight, direct "trunk." You may have variations or riffs or extensions, but the goal is that everything anchors back into the main theme.
- In reality, the trunk is the most difficult to create, but the most beneficial. It can be difficult to select just one central theme or idea on which to execute.
The Roots: The tangible and tactical design cues, messages, and other experiential details.
- This is what the customer will actually experience, from store atmospherics to product packaging to service features.
- Just as in root systems, there could be hundreds, if not thousands, of experiential details if you get very granular. Every one creates meaning and provides "nourishment" to the vision.
- Ironically, in actual fieldwork and research, the most granular or "gritty" details are those which impress people the most.
Just as a brief example and to show some versatility, let's imagine we wanted to create a strategy for the first two minutes of a customer's experience at a nature-oriented spa.
Clouds - These high-level thoughts and feelings could include peace, tranquility, connectedness, separation from the "real world," safety, physical and emotional comfort, relaxation.
Trunk - "Be isolated together in a natural space." When many nature lovers speak of their most cherished - and relaxing experiences outdoors, they had a common theme of intense isolation, and yet, strong connection to themselves and their partner.
Roots - Water threshold entry, remove shoes before entry. Heated and cooled surfaces. "messy" materials like sand, pebbles. Scent design. No computers. Limited bookings and partitioned entry to provide continuous feeling of isolation. Location and siting to fit.
Then comes the true test of the strategy: live testing with real people. This is where virtually all organizations stop short... and why so many strategies fail. The elegant strategy that seemed so perfect in the meeting room is interpreted in completely unintended or unexpected ways by customers.
Through beta testing and consumer research, we will attempt to directly overlay customers' perceptions onto the model we create. In an unbiasing way, we will show a group of customers our offering in beta form and understand how they "redraw" the model. They may spontaneously share stories and feedback that directly tie to the intended emotional outcomes, they may perceive the product as having absolutely no tie to what we believed was the central idea, they may not understand the campaign at a basic level.
Our work is to continue to refine until the research shows that customers are, without our bias or influence, perceiving the offering as intended... and if it is a compelling proposition for them.

Mining GRI Reports
Mining GRI Reports
Using GRI's Uniformity to Reveal Differences in Strategy
As we have seen through our examinations of GRI-filed aspects thus far, it offers a diverse and somewhat exhaustive view of a company's sustainability initiatives and performance. While GRI aspects are most commonly captured and noted within a company's CSR and not separated out into a stand-alone filing, examining the differences between GRI aspects can be interesting to help us find spaces of potential opportunity and unearth the strategies of others.
What we should also consider is that GRI aspects are not dictated to be stated in one form or another, so organizations can cite drastically different figures and indicators for the same GRI aspect. While this can make superficial analysis a bit more difficult, it tends to be very illuminating for deeper analysis, as it can show some level of an organization's engagement and intent in one aspect or another. GRI-compliant CSRs are certainly more uniform and more easily comparable than unstructured CSRs, but there is still significant variation.
There are many potential analyses we could perform on GRI filings, below are a sample of the types of analysis you can perform with GRI filings, as well as the strengths and limitations of those analyses. My hope in providing these is that we may begin to see the wide range of insights we can glean from just one type of filing, and how these insights may help us to establish the wireframe for innovation (our next Lesson).
Four Types of GRI Analysis and Their Roles
Omission analyses can be extremely effective in unearthing "bare threads" and generating leads for further research. As a group, these analyses tend to be a bit more difficult than other types of analysis simply because you will be examining gaps in data and not the data itself, per se. Where you could create grids and calculations of what data is present in filings and use it as a framework for comparison, in examining omission, you will be closely considering what is NOT in the filing.
These analyses tend to be especially valuable when considering if a company is trying to hide something or bury signs of an emerging strategy; they will most likely ignore it and hope it goes unnoticed.
| Name | Analysis considers | Chronology | Summary | Example (fictional) |
|---|---|---|---|---|
| Omission analysis across peers | Two or more peer organizations | Single filing period | This analysis can be especially effective in revealing a single organization's strategy, or problems it is attempting to hide. | Examining John Deere, Caterpillar, and Komatsu and noticing only two are emphasizing fuel efficiency in their equipment. |
| Omission analysis across industries | Two or more industries comprised of several organizations each | Single filing period | If a given industry has typically poor performance in an area or there have been industry groups working toward a shared goal/set of measures, it will typically be manifested when comparing industries. | Examining the commercial resort industry and the more conventional hotel industry and finding that the resorts omit most discussion of fair compensation. |
| Omission analysis across world regions | Two or more global operations of the same organization filing separate GRI | Single filing period | This analysis can be especially revealing when examining the global business units or affiliates of an organization. It may be indicative of separate standards driven by regulations, but it may also be evidence of units holding different strategies. | In analyzing the five GRI reports of the units of a global company, you notice that India has a very different set of People aspects and is the only unit not formally reporting to GRI LA6 in regard to injury rates. |
| Omission analysis over time | Single organization | Multiple filing periods | This tends to be among the more straightforward of the omission analyses, but can also be among the most revealing of an organization's strategy shifts over time. | Compiling and analyzing the last five years of GRI filings to see what aspects were reported on and finding that Scope 2 emissions were reported in depth only in years 1, 2, and 4. |
| Omission analysis across filings | Single organization, multiple filing types (i.e., GRI, 10K) | Single filing period | A personal favorite. This tends to be an exceptional filter of what is an organizational strategy and what may be greenwashing or PR. This can also be interesting in examining materiality, as a company could list a topic as highly material and a significant risk in the CSR, and then not have it as a Risk Factor in the 10-K. This would be a flag. |
A company headlines their CSR with the company's Mission, but it is different from the Mission stated in all other documents (this is more common than you might think). Similarly, the company could spend the CSR discussing management's deep commitment to topic X but not a word about it in any of the other management or strategy documents. |
In GRI reports, a given aspect may share the same name, but the indicators an organization elects to use in measuring the aspect can be wildly different. In indicator analyses, consider that "peers" may be organizations with similar offerings, of similar revenue, or even of similar stature across industries. Where omission analysis relies on more direct, almost forensic peer comparisons, indicator analyses can be especially valuable when considering those more liberal interpretations of "peers" because they can help illustrate how outright leadership or true innovation manifests itself.
| Name | Analysis considers | Chronology | Summary | Example (fictional) |
|---|---|---|---|---|
| Goal analysis across peers | Two or more organizations | Single filing period | In creating goals or Key Performance Indicators (KPI), an organization's performance on a relative basis may look stellar. Sometimes this is because the goal itself was set exceptionally low. Bringing peers into the analysis can help reveal if one organization is suppressing absolute target goals to be able to boast what appears to be stronger relative performance. | In a group of five peers, the company in question shows a staggering 90% progress toward its solid waste goal in the first year. Upon further review and looking at absolute tonnage in an Appendix, the goal that company set for itself is about 75% less than its peers. |
| Goal analysis over time | Single organization | Multiple filing periods | This analysis can act as an excellent bellwether for either innovation or poor performance elsewhere by looking at how the organization responds to progress made on a single aspect/indicator over time. Here's why: the tendency for aggressive, highly strategic companies is to continue to move goals as they progress toward, and eventually surpass a goal. One might consider this a natural progression in our daily lives: that when we meet a goal, we continue the positive momentum and set a new goal. | In performing this analysis and examining an organization's goals over time, you could see that they began by setting a low ten-year sustainability goal, met that goal in year two, and then spent the remaining eight years touting that it has 'already met its goal.' If you think of the strategy at play, it is maximum superficial performance at minimal expenditure of effort. If you sense a tinge of disdain in my writing, you would not be mistaken. In my personal view, organizations that do this are in an advanced phase of greenwashing, and are likely treating sustainability efforts as PR. |
| Certification analysis across peers | Two or more organizations | Single filing period | As in our earlier discussions of third-party certifications and standards, some are far more stringent than others. In considering the certifications a group of peers organizations elects to pursue, it may illuminate how engaged those organizations are in improving performance in a given topic. | Examining a group of lumber and forest product manufacturers and finding that the vast majority cite FSC certifications while a relative handful use SFI. This could merit additional investigation. |
| Index basis analysis | Single organization | Single filing period | Any time an indexed baseline of any type is used, it merits consideration of the index itself. Many companies prefer to choose a baseline performance year, many times the first year of their sustainability program, from which to index all performance. While it allows organizations to publicly state performance without absolute statistics, it can inflate performance. | Examining the absolute performance of the 2006 baseline from which all years after are indexed and finding that it was the highest year of unit production in the last 40 years for the company. This would then function to likely inflate absolute waste, energy consumption, GHG emissions, and injury numbers in the index year. |
| Analysis of intensity vs absolute indicators | Single organization | Single filing period | It can be interesting to consider if and when an organization changes from stating indicators on an intensity basis (i.e., "10 kilograms solid waste per unit produced") versus an absolute basis (i.e. "2 million kilograms solid waste produced in 2015"). In some cases, using intensities versus absolutes can be warranted, but it warrants analysis in some cases. There are even some cases where the intensity is stated relative to revenue dollars (i.e. "kg GHG per $1000 revenue"), which could further cloud analysis if the company is improving financial performance without improving sustainability performance. |
Finding that a company decided to index its solid waste generation to a year where production was at an all-time high, and also elected to state the indicator in absolute terms. This index could have been made more valuable, and perhaps valid, by using an intensity. |
| Analysis of measurement bias | Single organization | Single filing period | This analysis examines what is actually being considered in measuring a given indicator, and may require interaction with the company's Investor Relations or Sustainability staff. | A company may generate 30 million tons of fly ash from its powerplant operations, but not include it in waste generation reporting because it considers it a "byproduct." Unless footnoted or asked specifically, a sustainability report would not necessarily capture this fact. |
| Analysis of relationship bias | Single organization | Single filing period | This can be an especially valuable analysis in supplier and employee surveys which are sometime used and reported in sustainability reporting. For example, employee surveys are the cornerstone of how many companies report their internal People aspects. In this analysis, we look at any mitigating factors which could function to bias these reports, down to the survey wording and submission mechanisms. |
A company uses employee surveys heavily in its sustainability reporting, but asks the questions in biasing or unclear ways, sends the survey along with the employee's bonus check, and requires employee name and signature on the survey itself. |
These tend to be more qualitative analyses, centered around how well the organization explains its actions or how it may state an indicator in one way or another. These can be interesting in that seeing narratives with qualifiers or which seem to be opaque can signal areas of further exploration.
| Name | Analysis considers | Chronology | Summary | Example (fictional) |
|---|---|---|---|---|
| Aspect commentary analysis | Single organization | Single filing period | This is a less formal analysis, but can be valuable to find areas warranting further exploration. When a company lists and indexes the GRI aspects addressed in the CSR, it will many times accompany the aspect with a narrative statement of why it took that approach. Furthermore, if a company elects to not address a GRI aspect, it will offer a narrative statement on why it did not address that aspect. In either case, these narratives can be interesting... is the statement explanatory and illuminating, or is it legalistic and worded in a way which seems more concerned with avoiding transparency? |
In addressing why it does not address important People aspects in an otherwise complete CSR, an organization states that, "We are not required by the laws in any country to disclose the information requested by GRI, and we therefore decline." |
| Aspect commentary analysis over time | Single organization | Multiple filing periods | This is a little more formal qualitative analysis than the single filing equivalent, but the intent here is to see if there have been shifts in tone or content in the narratives that could signal a change in strategy or other underlying issues. | For five years, an organization was transparent and cited examples in explaining why it chose to not report on an aspect due to proprietary information. In year six, it reverted to a highly legalistic narrative in explaining why it chose to not report an aspect, and removed indicators for three more related aspects using the same legalistic narrative. |
| Substantiation analysis | Single organization | Single filing period | This analysis examines the overall approach an organization's lead sustainability claims take in the CSR, and would examine if it chooses to lead the reporting with "splashy" claims that are otherwise poorly substantiated. If it chooses to use with a high number of relative performance claims, it may warrant deeper analysis. | In the headlines of every section of the CSR, the organization makes claims which do not cite indicators, or perhaps which are significantly overstated. |
| Polish or "Fluff" analysis | Single organization | Single filing period | This is a favorite, especially when considering implications for innovation. This analysis looks at the overall design and feel of the report in comparison to the actual content of the sustainability efforts. You could also think of this as the "Ad agency analysis," as some reports are exceptionally well-designed and read beautifully because they were created by an outside creative agency, but are significantly lacking in actual substance. This is similarly manifested in top level (headline) copy, where the organization may make beautiful, emotionally evocative statements which are in no way connected to their actual sustainability efforts or performance. |
While a report is highly polished, visually interesting, and captures interesting graphs, the underlying data is significantly lacking. |
| Definition analysis | Single organization | Single filing period | This can be an especially difficult analysis, but can unearth logical problems in reports which would otherwise appear to be well-structured and substantiated. In essence, the researcher needs to understand how the organization uses and defines a given term (even seemingly simple terms). For example, even definitions of "waste" can vary significantly, and would have bearing on the sustainability program. |
A common finding of definition analysis is one that tends to open many eyes outside the profession: that organizations claiming "Zero Waste" may have wildly different definitions of the term. Some definitions exclude hazardous wastes, some simply claim "Zero Waste" or "Zero Waste to Landfill" by sending all of their waste to a Waste to Energy plant for incineration. So, an organization could create 5000 tons of waste material, pay a surcharge to have it shipped to a Waste to Energy incinerator, and make the claim they are "Zero Waste." Furthermore, some of that waste could be a material like concrete, which provides absolutely no energy value when incinerated. If you want for a lively dinner or conference conversation, ask the sustainability manager of a company claiming "Zero Waste" what their functional definition of "Zero Waste" is. |
The polar opposite of Omission Analyses, these seek to understand exactly what actions the organization has actually taken and what commitments they have executed.
| Name | Analysis considers | Chronology | Summary | Example |
|---|---|---|---|---|
| Action analysis | Single organization | Single filing period | This is exactly as it sounds: an analysis specifically looking at the actions the organization took in a filing period. This can be interesting in that it can reveal how much an organization is doing... or not doing. Think of this as another forensic-type analysis that examines if the inputs and actions match the outputs and claims. For the purposes of innovation and further exploration, this analysis can also show evidence of an organization "black boxing" part of its sustainability program... either because it is doing something strategic and proprietary, or perhaps because it has unsubstantiated claims. Metaphorically, think of this as the "hidden room test"... that if you measure the exterior length of a building and it does not match the sum of the lengths of interior rooms, there is a hidden room. |
Upon the examination of the actions taken by the organization, it becomes evident there is a low probability they are accomplishing what they state with the inputs and initiatives they describe. This becomes fertile ground for further research and exploration as to the cause for this disconnect, as there may be a significant strategy or innovation at play. |
| Outlay analysis over time | Single organization | Multiple filing periods | Another straightforward analysis in concept, this analysis seeks to understand the infrastructure, headcount, equipment, and external resource outlays an organization made for its sustainability program in a given reporting cycle. | An organization states all of their 110 manufacturing facilities are now LEED compliant, but yet there is no evidence of the undertaking financially or any other evidence of a project or effort. |
| Analysis of proactivity vs reactivity | Single organization | Multiple filing periods | The most common manifestation of this analysis is examining the actions an organization took which were elective and proactive as opposed to those which were reactive or required. Conceptually, we would probably have far more to learn about strategy and innovation from an organization adopting a sustainability strategy or taking an initiative proactively vs another organization taking the same action as a reaction to pressure from regulations or NGOs. In some cases, you can see an organization touting claims in a GRI-compliant report which are actually required by Federal regulations. Much as in law, motive is important. |
An outdoor apparel company begins a "responsible goose down" sourcing project in 1996, completely by its own proactive efforts and significant outlays. In 2014, another outdoor apparel company begins a similar sourcing effort after its plants had been picketed for two years by NGOs, and the company received significantly negative mass and social media attention. |

Mining Unstructured CSRs
Mining Unstructured CSRs
Understanding the Wide-Open Landscape

In our earlier discussion of mining GRI-compliant CSRs to frame potential opportunities, we found the GRI framework provides some structure to how an organization reports their sustainability aspects and indicators, but is by no means a rigid set of definitions. Think of GRI as a set of guardrails for an organization, keeping it within some roughly defined boundaries. By comparison, we will see 10-K filings as a set of rails, allowing very little deviation by comparison.
Keeping those metaphors in mind, we could consider the unstructured CSRs as a wide open field. There are no rules, there are no criteria or standards to abide by, allowing organizations to refer to anything from a single page of PR to a full report as a "CSR." Understandably, this leads to a significant variance in data presented and how it is stated. So, our methods of analysis must flex accordingly to allow us to glean as much insight as possible within a given field of CSRs.
Of note in our discussion of structured (GRI, etc.) and unstructured CSRs: There is perhaps a misconception that GRI-compliant reports are superior in content and transparency to non-structured reports. This is not necessarily true for a few reasons:
- Application levels vary significantly. GRI has six-letter grade Application Levels for filings, ranging from C to A+. Especially at the lower, non-audited levels of filing, the aspects an organization is required to report on can be a bit of a low bar to meet. Furthermore, only A and A+ require an organization to report on all aspects, meaning they could conceivably ignore swaths of topics and indicators and still be considered GRI-compliant.
- GRI is not prescriptive. If there is a common misconception about many of the leading standards in sustainability, it is that they are prescriptive and in some way evaluate the quality of an organization's efforts. This is not true. GRI and ISO 14001 are reporting standards, requiring disclosure of philosophies, processes, and measurements (GRI), or processes, decisions made, and documentation (ISO). You may conclude that organizations making the effort to file a high-level GRI application do indeed have robust sustainability programs, but we will see this is not necessarily always the case.
- Transparency is not mandated. Even if an organization does file a high level GRI report, this still does not necessarily mean they have disclosed everything in a full and transparent manner. Like a good lawyer, they may simply use the interpretations of GRI aspects in such a way to be of maximum benefit to the organization, and not necessarily provide full disclosure.
- Organization size is a factor. There is some level of stratification of organization size in regard to filing standard selection. Many of the large, multinational corporations file with GRI because they are highly advanced and already reporting much of the information to shareholders. Mid-cap organizations are a mix of lower-level GRI, B Corp, and unstructured. Small-cap and non-profits tend toward B Corp and unstructured.
We have seen the level of Patagonia's sustainability work in prior lessons, and they not only do not file a GRI-compliant CSR, they don't file a CSR at all. They have addressed their rationale in response to the question, "Does Patagonia publish a Corporate Social Responsibility (CSR) report or social audit?" [14] [Emphasis is mine]:
Patagonia as yet has not published a CSR or Sustainability Report that follows the guidelines of the Global Reporting Initiative (GRI) or other framework used by other companies.
We are committed to co-responsibility for decent treatment of workers throughout the supply chain. We publish our factory list online. You can access social audit report results for factories that make Patagonia clothes through the Fair Labor Association (FLA) website (we are an accredited member of FLA; they randomly audit a sampling of our factories every year). Our newly redesigned Footprint Chronicles site also includes social audit results from our supply chain.
To report on environmental responsibility, the Footprint Chronicles looks at some of the environmental impacts in our supply chain. The Footprint Chronicles allows us to talk about critical social and environmental stories with all our stakeholders – customers, the press, suppliers, employees and students – in unspecialized, everyday language. We give priority to the issues that challenge us the most – or that our stakeholders regard as a challenge and ask us to address. We highlight failures and ongoing challenges as well as incremental successes.
We inform our customers and the public on our progress in social and environmental responsibility in other ways too – in the Corporate Responsibility section of The Footprint Chronicles, in our annual Environmental Initiatives booklet, in the Environmentalism section of our website, and on our blog, "The Cleanest Line." We feel these are exciting, interesting, interactive and transparent methods to show our commitment to human rights, environmentalism and ethics.
In early 2012, we became the first company in California to become a Benefit Corporation (B-Corp) with the State of California. This certification process requires annual reporting.
The advantage to the reader/user of sustainability reports that follow the GRI framework is the ability to easily compare data from different companies. The disadvantage: a sustainability report, like an annual report, can be a dull read held forth in specialized language that clouds as much as it reveals. Because we recognize the advantages of easy comparability, we are investigating the possibility of importing data we collect for the Footprint Chronicles into a GRI framework (and with as much plain speaking as possible). Sustainability reports can be expensive for a company of our relatively small size to research and produce and can only supplement, not substitute, for the Footprint Chronicles. We want to continually raise rather than lower the quality of the conversation we've created with our stakeholders over the past years.
Patagonia's sustainability reputation is well known, but many other organizations filing unstructured CSRs may not be as well known. Unfortunately, for some organizations lower in supply chains, its customers may require GRI reporting simply because it is well known and these customers do not have the resources to deeply understand an unstructured CSR. So they require what is standardized and accessible.
Philosophies for Finding Opportunity in Unstructured CSRs
While the examination of GRI-compliant CSRs may feel more like forensic accounting or auditing, finding opportunity in unstructured CSRs tends to have a less methodical, more aggressive approach. I would describe it as almost a feeling of legal discovery or journalism, as it is far less process-driven and more about considering overarching storylines and finding leads. We all have our own approaches and preferred tactics, but I will say this: When dealing with unstructured CSRs, it can be useful to stay loose and step back from the CSR often to consider the larger story and strategy. Because there are fewer clear points of comparison, unstructured CSRs can have a tendency to lead you where they want to go.
You may find that adaptations of the GRI analyses covered earlier can certainly be adapted and applied to the research of unstructured CSRs, but here are a few philosophies to consider:
- What information surrounds the CSR? In our search to unearth strategies in the CSR, it can be useful to compile non-CSR information from the same period, anything from press releases to LinkedIn posts to interviews. We want to understand where an organization is moving strategically, how sustainability fits, and our opportunity.
- What is the organization's context? If a local dairy created a 10-page unstructured CSR, it would be both rare and commendable... if Ben & Jerry's did the same, it would be both out of character and highly questionable. Because the breadth of circumstances and complexities is so wide with unstructured CSRs, we must always be conscious of context. For example, if we are an organization attempting to strengthen a strategic relationship with a customer based on its sustainability goals, we must consider that a smaller company may not have the resources to share all of its sustainability goals in a CSR, let alone pursue them all at once. If we seek to strengthen our relationship with PepsiCo, there is probably a high probability that staying within the stated goals of their CSR will serve us well, as those goals have likely been through rounds of refinement and expertise.
- What are they proud of? This may sound a bit odd, but where does the company seem to get a little twinkle in their collective eyes? What do they seem especially proud of? Do they have a pet project or product line? In engaged organizations taking on innovative projects, it can be hard for them to suppress their own excitement, especially in interviews and PR. This is also true for sustainability reports. Where do they tell the most stories and put the most effort?
- What might they not be talking about? Are there omissions from the discussion that would otherwise seem obvious? Are there areas which you might expect to warrant considerable attention in the CSR which seem to be glossed over? There may be something more to the story. If an automotive manufacturer issues a 120-page CSR and there are two sentences on fleet fuel mileage, chances are something is off.
- Are there embarrassments? Are there areas where the organization has come under scrutiny from customers, mass media, social media, or NGOs? Did they address it in the CSR, and if they did, how did they address it? There are some fairly inspiring examples out there of organizations taking embarrassments head-on in CSRs, and there are also some which completely ignore anything negative. We can learn from both.
- How do they compare to peers? Because two peers may have significantly different levels of unstructured filings, we need to take a more holistic view. Does the company's level of strategy and intent in sustainability generally match, trail, or exceed other initiatives in the organization? Are they a young program showing great promise and innovation in what they are able to do, or are they generally floundering? When examining drastically different peers, we need to find some way to normalize to gain a better view.
- Where are the over- and understatements? Is the report loaded with overstatements and greenwashing, or does the filing have a certain feeling of "duck feet"... that is, a serene and somewhat understated public appearance with furious effort not visible to the casual observer? The companies that tend to have that duck-like appearance may have far larger strategies and plans in the works, while those overstating tend to have far less happening beneath the surface. (If you are curious about where the 'duck foot metaphor' comes from, here is an example of the source material. [15])
As we begin to be able to critically analyze both GRI-compliant and unstructured CSRs, we will be able to understand not only the spaces in which we wish to innovate, but also the strategies and tactics that true innovators undertake to find opportunity to grow sustainability as a core business imperative. Much as in our earlier example of Van Gogh's color theory, our goal is to be able to deconstruct the work of others so we may be able to find our own philosophies and construct our own ideas. Being able to deconstruct sustainability filings will be a centerpiece of this effort.

Supplier Scorecards and Requirements
Supplier Scorecards and Requirements

Understanding How Organizations "Push Down" Strategies
As we seek to understand the landscape of organizations, actions taken, and underlying strategies, supplier scorecards can help us to understand the steps actively taken to "push down" their sustainability strategy into the supply chain. This tends to be an excellent measure of how far along the sustainability path an organization is, as it tends to be the more advanced that have rigorous supplier sustainability scorecards, with the most advanced being those that integrate sustainability measures into the core of their supplier ratings. When those scores determine how much business a given supplier may receive and how protected they are from supplier trimming efforts, it takes on a very different feel than an "optional" supplier sustainability scorecard.
If you are unfamiliar with supplier scorecards, there are a range of manifestations as wide as you could imagine. The common thread is that the intent of supplier scorecards is to help an organization understand key supplier relationships and high performers, and similarly, to signal low performers that could be eliminated from the supplier list. Ultimately, it is up to the organization to dictate what they include on a supplier scorecard depending on their needs and emphasis, and could include anything from on-time delivery measures to ratings of responsiveness.
Why this is so important to us is that by understanding what is on a supplier scorecard and what the organization emphasizes, we can gain a view of the "scoring rubric" of what the organization holds most important. We understand what is important to the organization by understanding what they make important to suppliers. In most cases, these scorecards are an excellent barometer for how true an organization is to their stated strategy.
In many cases, for those organizations which have not added sustainability reporting requirements to supplier scorecards, we can see the paths already being established in GRI reports. Some organizations will clearly state their timelines for supplier sustainability requirements in their GRI filings, while others may allude to the fact that they will seek and measure supplier sustainability efforts in the near future.
While the specifics tend to not be public, here are a few samples of what organizations have to say in regard to supplier sustainability requirements:
PPG's supplier sustainability requirements: [18]
PPG expects suppliers to evaluate and maintain sustainable processes and raw material sources throughout their supply chain and supplier base. PPG's preferred supplier criteria includes vendors that demonstrate world-class sustainability practices and marked improvements regarding their respective organization’s sustainability within the markets they serve. PPG will foster and maintain a sustainability culture with our suppliers, encouraging these suppliers to innovate and develop new products requiring less intensive material and energy consumption, along with leveraging their collective strengths to meet PPG’s sustainability goals.
WPP's supplier sustainability requirements: [19]
Selecting preferred suppliers
We evaluate all potential new suppliers against a set of business requirements before they can become a WPP supplier. These include assurance of supply, quality, service, cost, innovation and sustainability. Our sustainability criteria cover six areas: policy, senior responsibility, materiality and issues identification, reporting, supply chain and anti-bribery and corruption.
Alcatel-Lucent: [20]
Sustainability is increasingly a key consideration in the way we select and manage our suppliers. For example:
- Suppliers must have a "satisfactory" sustainability rating to become a preferred production supplier.*
- General or product/service-specific sustainability requirements are integrated into suppliers’ bids and tenders, and account for a portion of the total scoring and selection criteria.
- Sustainability performance is one of the eight areas of the supplier scorecards used during business reviews with our suppliers (see section 4.2).
- * "Preferred" suppliers are those sources for a given purchasing family that we consider first for new projects. Our objective is to concentrate our spending on these suppliers. Preferred suppliers take priority for incorporation into new designs and must be used for purchase orders whenever possible.
Siemens: [21]
Sustainability requirements – as a guiding principle for our supply chain management – are an integral part of all relevant supplier management processes – such as supplier selection, supplier qualification and evaluation, and supplier development. We require all of our suppliers to comply with the principles of our Code of Conduct for Siemens Suppliers, which include, besides others, respect for the basic rights of employees, strong safety and health and environmental protection standards as well as zero-tolerance on corruption and bribery. We also require them to support its implementation in their own supply chains. We have established and continually further develop a risk-based system of appropriate processes to enable us to systematically identify potential risks in our supply chain. It consists of sustainability self-assessments by suppliers, risk evaluation conducted by our purchasing department, sustainability questions within supplier quality audits and sustainability audits by external auditors. To further encourage sustainable business conduct throughout our entire global supply chain, we are committed to building our suppliers’ competence and intensifying knowledge transfers related to sustainability.
Of all of the developments in sustainability we will discuss, the addition of sustainability measures to supplier scorecards may be one of the most direct and tangible ways we will see sustainability spread across organizations in the near future.
Much of this may act to shift how sustainability is framed in organizations.
Frames for Sustainability: "Active Reward" Versus an Emerging "Passive Detriment"
The "Active Reward" Frame
During our time together this semester, we have examined organizations that lead in sustainability across a range of concerns, from community involvement to profitability to waste reduction. What we may see in these organizations–and many of those leading in sustainability–is they share a very active approach to sustainability, and one which is highly biased toward seeing the rewards of sustainability.
Let's briefly examine the titles statements of leading sustainability reports I chose at random. Emphasis is mine:
- "Local Citizen: Making Sustainable Progress Possible One Community at a Time" - Title of Caterpillar's 2014 Sustainability Report
- "Creating Shared Value" - Title of Nestle's 2014 Sustainability Report
- "Finding the Upside" - Title of Abbott Laboratories 2014 Global Citizenship Report
- "At the BMW Group, we believe that sustainability means investing in our future." - Headline of BMW Chairman Dr. Norbert Reithofer's Letter in BMW's 2014 Sustainability Report
- "Enhancing personal well-being," "Building stronger communities," "Protecting the environment" - Coca-Cola's definitions of their 2020 Sustainability Commitments
- "Reaching Further" - Title of Biogen Idec 2013 Sustainability Report
- "Making Progress, Driving Change" - Title of Unilever's 2013 Sustainability Report
This is just a very brief sample of messages, but it acts to help illustrate what is currently a dominant frame in sustainability: To receive the benefits of sustainability, whatever they are, it will take effort. Thus, we see many active, driving, aggressive-type frames. We can call this the "Active Reward" frame for sustainability, one which we see almost everywhere in organizations, NGOs, people, the media, and elsewhere.
What is important about this frame is it creates a belief that if one is not compelled by the "reward" of taking on sustainability, they simply need not be "active" in those efforts. The core operations of the business are unchanged if they do not engage in these seemingly extracurricular activities.
The "Passive Detriment" Frame
What we may begin to see with the emergence of sustainability requirements in suppliers is a new frame for sustainability–one where there will be a very tangible and significant detriment to the organization if they take a passive approach to sustainability. In essence, the integration of sustainability requirements in supplier scorecards will begin to establish new frames for sustainability:
- 'We will lose preferred supplier status if we do not perform on sustainability criteria.'
- 'Not reporting on sustainability will close doors to potential new business.'
- 'Our core business will suffer if we do not meet (company's) supplier criteria and are dropped.'
- 'If we do not meet the criteria, X% of our revenue will be at risk.'
While enterprising and innovative organizations will continue to see the more positive and benefit-oriented "Active Reward" sustainability frame, organizations which are passive will begin to see the negative effects of inaction.
We can only imagine what the passage of a carbon tax would do for the creation of a "Passive Detriment" frame in organizations.

Non-Sustainability Sources
Non-Sustainability Sources
Rounding Out Our Understanding
I'd like to start out not by laundry-listing the non-sustainability-oriented sources of information which may be of interest to us, but instead examining what we seek to gain from those additional sources of information.
Whether we seek to understand opportunities to deepen relationships with customers, niches within which to innovate and create offerings, or to understand the competitive space, sustainability filings can only reveal part of the overall picture. In fact, while examining only sustainability reports may not actively hinder our research, we may find that our insights lack a certain depth because they rely only on the sustainability viewpoint. I firmly believe that as you gain experience researching or performing fieldwork, you do indeed develop an almost unconscious feel for when the insights are well-developed. I like to say that at a certain point, the insight takes on a certain "bite"... that it stands alone, has a certain crispness of information, and exudes power and verve. It may be hard to explain, but a significant goal of this course is to help develop that feel for when insights have "bite" in yourselves and your colleagues.
(If you ever want to test if your insight really has bite, try to create a one-page infographic centered on it. Something about the infographic format condenses thought and forces interest while adding some narrative... while bad infographics are instantly boring.)
In our efforts to provide a full, unbiased view of the desired topic, it can be beneficial to integrate other sources of research, some which we have briefly before, and some of which may be a bit less conventional. Regardless of the corroborating sources of information, it can be useful to "triple source" to provide a full view of the question at hand.
Triple Sourcing to Help Validate and Deepen Understanding
Far too often, research becomes an effort of finding information that confirms a frame or narrative we already hold. In fact, the clearinghouse of seemingly all initial understanding, Google, tends to underscore this tendency for confirmation (and sloppy research). What may begin as a search for "Ford sustainability" returns an overwhelming set of results, so we may lense it with "Ford sustainability leadership" or "Ford sustainability award."
The most significant liability in any research is that our initial beliefs may cloud or bias our extraction of source information, which will in turn cloud our results and the insights we create. Unfortunately, the effect is especially pronounced as the timelines for research are condensed and searches become even more directed and biased, as we seek to find substantiating information that won't stray from the developing narrative. (If you would like to see this at work on a daily basis, you may notice many media outlets citing Tweets in-line in otherwise journalistic pieces. They support the story's narrative because these supporting "sources" for seemingly any story are only a fraction of a second away.)
Triple sourcing is a quick mechanism which can help us to avoid not only our biases, but also instances of a single statistic or story (usually PR-oriented) potentially coloring our substantiating research. How it works is that we match our primary source for a given piece of information with two secondary sources to test the primary source. This is designed to be in initial screen, as deeper research will likely go far beyond three sources, but it can be very helpful.
Source 1: Primary Source
This is the initial finding of the information you will potentially include in your research. For the sake of argument, let's assume one of the "big three" sources of initial information we will tend to use will be: a GRI-compliant sustainability report, an unstructured CSR, or a company's 10-K filing.
Source 2: Contrarian or Third-Party Source
The goal of this source is specifically to test your primary source. So, if your initial source provided a glowing take on a company's sustainability efforts, your goal for Source 2 is to find third-party information specifically refuting that original source. This is where you may consciously search for biased information, and furthermore, you will consciously slant your search for this source in hopes of unearthing contrarian views or other information. Your goal is to find any information that may bring the first source into question, or otherwise provide depth.
Source 3: A "Voiced" Source of Information
While a voiced source may come from anywhere, I tend to favor those who are not in PR or Communications from the organization. Where the greatest information tends to come from is someone actively working with the area in question, be it an engineer, product manager, or otherwise. Industry publications tend to be excellent for this, as they tend to concentrate on areas of expertise, and not so much on PR posturing. What you are looking for in this source is specifically someone from the organization talking about the topic in question in an unscripted way.
So, if you found an interesting story on worker safety at an organization in their CSR, the ideal would be to find a Safety Manager talking to EHS Today about the tactics the company uses to create such a stellar safety record. What we are looking for is ground-level substantiation of the original source, or otherwise to see any disconnects or "overstatement" in the CSR, for example. The CSR could talk about "a new, proprietary machine safety system reducing injuries" while a safety engineer talks about adding $50 of acrylic sheets to danger areas to prevent people from sticking their fingers in machines at the wrong time.
One note on finding voiced sources: If you see strikingly similar wording between the sources, chances are they're scripted or PR. They may be accurate and valid for our research, but just know that they may be prepared statements.
Some Non-Sustainability Sources of Supplemental Information
Financial Filings, Namely 10-K or Equivalent
As mentioned earlier, these tend to be centered on the shareholder and financial interests of a publicly-traded company, but we see increasing airtime for sustainability information, especially in the Risks section. Where 10-K can be especially valuable for us is in testing if the assertions made in the sustainability filing in fact make it to SEC filings. If the sustainability report alludes to climate change as a major long-term risk to the organization's operations, we would certainly expect to see that fact addressed in the 10-K risks.
General Media and Reporting
Open reporting on a topic is, and will likely remain, a viable source for information. This is certainly no surprise.
Blogs (with significant additional substantiation)
This is a surprise to some, but really should not be. Here's why: they live and die by the posts they publish. Can they be sensationalist or overstated? Absolutely. Can they be expertly written and researched? Absolutely. But, here is where all of that should net out for us: blogs can do very real, very substantial damage to brands, and I would argue that blogs are quite close to NGOs for the potential they can have to disrupt the otherwise normal flow of a sustainability program. The last boycott you read about may have all started with a blog post. Organizations should ignore at their own peril.
For this reason, blogs can also be an excellent media for those contrarian sources we seek in triple sourcing.
PR
PR tends to be interesting no so much for what it can reveal, but for what it may confirm. If you think of PR as the 'sanctioned stream of consciousness' of an organization, it can be interesting to see what themes are carried from CSR or other sources and into PR. Those that do make it have been formally sanctioned by management in the organization as noteworthy and able to be shared at one point or another. This is interesting to us as we may see developing themes in the CSR which are then not part of PR conversations they otherwise would be.
Industry Interviews
As I mentioned earlier, these can sometimes fly under the PR radar at an organization because they may be related to industry groups, whitepapers, and other discussions. Having someone not speak from "the teleprompter" while talking about issues important to the organization can be especially interesting to us in research and finding opportunity.
LinkedIn and Posted Openings
Finding where people are moving positions and seeking headcount can be a great way to color research or provide another viewpoint. If the company offers a one-liner on their excitement on the new sustainable offering but you see that there are 12 openings posted for product management and support in for that product line, something may be afoot. Similarly, LinkedIn resumes can signal where internal expertise is moving within an organization to support emerging businesses.
Anywhere Else
Quite literally, anything can potentially be a source of information. From asking a customer service representative when a new product release is happening (gauging if the message has been formalized across the org and if there has been training) to researching the filings of related companies or suppliers for shared themes, some of the least-common sources can be the most valuable.

Closing Remarks
Closing Remarks

.jpg#metadata)
“As you can see, I am immersing myself in color—I've held back from that until now; and I don't regret it.” -Vincent van Gogh to Theo van Gogh, September 3, 1882 [25] in speaking of a sketch of this work, The Beach of Scheveningen
Analyzing How Others Have Used Their Palettes
In this Lesson, we are quite granular in the analysis of whatever sustainability source material may be laid before us. With highly structured filings, we are able to have highly structured analyses, and with less-structured filings and information, we take a more blended and philosophical approach to extract as much meaning as possible. We are quite literally immersing ourselves in the colors of sustainability to find areas of opportunity on which to innovate. Our research is rarely a finite, directed highway, but far more often an exploration of winding and converging paths through which we find areas of interest. Many times, these areas represent opportunity.
As we have discussed before, there is this perception that creative people create. They lock themselves in rooms and somehow exude these brilliant thoughts onto their respective canvases, and that those who rely on weaknesses like "analysis" or "deconstruction" or "comparison" somehow fall short.
One would never conceive that van Gogh, arguably one of humanity's most important artists, actually thought about his work or analyzed his own creative process, correct? His letters show otherwise.
Here is an excerpt from later in the letter noted above, referring to another sketch of a wooded area:
Painting it was hard graft. There are one and a half large tubes of white in the ground — yet that ground is very dark — in addition red, yellow, brown ochre, black, terra sienna, bistre, and the result is a red-brown that varies from bistre to deep wine-red and to pale, blond reddish. Then there are also mosses and an edge of fresh grass that catches the light and sparkles brightly and is very difficult to get. There at last you have a sketch which — whatever may be said about it — I maintain has some meaning, says something.
While making it I said to myself: let me not leave before there's something of an autumn evening in it, something mysterious, something with seriousness in it.
However, because this effect doesn't last, I had to paint quickly. The figures were done with a few vigorous strokes with a firm brush — in one go. I was struck by how firmly the slender trunks stood in the ground — I began them using a brush, but because of the ground, which was already impasted, one brushstroke simply disappeared. Then I squeezed roots and trunks into it from the tube, and modeled them a little with the brush. Yes, now they stand in it — shoot up out of it — stand firmly rooted in it. In a sense I'm glad that I've never learned how to paint. Probably then I would have learned to ignore effects like this. Now I say, no, that's exactly what I want — if it's not possible then it's not possible — I want to try it even though I don't know how it's supposed to be done.
Here is one of the world's greatest painters interspersing a discussion of the tactics of colors and his attention to shaping the paint to create satisfactory trunks (and later, complaining about the cost of paint), with philosophy and his uncertainty and concern about being able to execute his final vision. This creative and strategic struggle lies at the foundation of the Clouds and Roots Model: Tangible tactics must be linked to higher level strategies and visions to be effective, and vice versa. We will spend time in what seems like frustrating and messy minutia and analysis, and then be struck with a vision of what could be possible... but then face the stark reality that it may not be possible or feasible.
What is important is that although the final products may seem beautiful and elegant and masterfully executed, the creative process is messy and far more rigorous than one might imagine.
If it were an easy, clean, or defined process, it would be paint-by-numbers. No one is remembered for their paint-by-numbers artistry.
A Modern Example of the Rigor and Analysis of Creation
In this discussion of the rigor and analysis underlying elegant, powerful, interesting creations from humble tactics and analyses, I'd like to also offer a modern example of the creative process. In this case, our look into the creative process is with Aaron James Draplin, the mind behind DDC, a one-man logo design house in Portland. He has done work for companies from K2 and Burton Snowboards to Nike, and I thought this unfiltered look into the thought and rigor underlying creation was especially illuminating. (I can tell you from experience, logo design is far, far harder than it looks.) Please watch the following 16:14 video.
Video: Aaron Draplin Takes On a Logo Design Challenge (16:14)
We'll start by me getting the lens cap off that thing from all the professionals here in the shop. Hi, I'm Aaron James Draplin, and welcome to the Draplin Design Company. Here we are. Let's get going. (rock music) Here at the Draplin Design Company, I mean, it's basically just me, doing whatever it takes to make cool stuff. (rock music) Along the way, a full line of spirited merch, plastic things with DDC all over it, and of course, Field Notes. It's just a little book, and there's some staples, and some paper, you know, and nice little edges and rounded corners.
(rock music) I am surrounded by tons and tons of things. I've had to go dig it up in the deadest, weirdest places, you know, places where you have to, like, talk to people, and other sketchy stuff like that. Out there in the world, you're digging around, you're looking at stuff, you're going to find stuff like that. (rock music) We're in this world where those programs, they offer you a million, million options, and you see too much used.
When you go back and you look at this old world, there's just sort of reminders of just a simple little logo, a simple couple little shapes. I like things that worked 40 years ago, and then work right now in the smack dab of 2014. (rock music) Okay, you guys. Lynda.com has sort of challenged me to make a logo. I picked one called All Base, right? All Base would be, and the story goes, they're from Tennessee, and there's a sort of heritage component, where they've been doing business for a lot of years.
It's slab concrete. All Base Concrete Foundations, right? What if they came to me and said, "We've been doing business for 100 years, "and we don't want to look like 2014. "We want to look like something "maybe our grandparents might have signed off on "50 or 60 years ago." With any logo, just start writing the name out. Lower case, upper case. We're just kind of taking a look at what we're working with here. Now maybe there's something about it being this heritage quality, where you're going to do this handwritten thing.
But you quickly, quickly, quickly, just this way, kind of say, well, there's maybe something there that we go explore, right? Now listen. This is sketching. This is meant to be fast and fun, and just kind of like free. Your hand is freer here than it would be on your illustrator. Now, of course, you look at that and you kind of say, that A, you know. What if we just make them a killer, burly A? It's this big slab of concrete. There's already colors that start coming to mind, these grays, maybe a little bit of earth tones, or wet concrete or something.
Right there you already have a color palette. You start making notes about stuff. So you're just kind of saying, all right, concrete, grays. You're just sort of writing stuff down. When you make this logo, there's like a sense to me that All Base needs to pretend that All Base is as big as their biggest competitor. Right? But more often than not in my life, they're smaller and crustier. Right? Design can elevate them. There's a sort of subversive quality to that. When my buddies in the band come to me, it's a fight.
It's a fight to say, "We're not funded. "How am I even getting paid?" But we're going to make them look as good, or even better, or more considered, than the guys in the major label. That's been my life forever now. The same thing sort of here. Let's go take a look at - We've looked at what things look like out there. You see a certain vernacular and a certain flavor. But what's most appropriate for these guys. What if we start making some slabs here? I'm thinking of sediment and layers and things underground and stuff.
You take a look at that thing and you say, okay, we've got a little A happening right there. There's so many ways you could take it. You think of, like, what are the basics of an A. This, this, and this. Well, if we take that guy, and there's our big old foundation. Something's coming out of that thing. Now, listen, I already hit a couple things just in the last two minutes that I wasn't expecting. That's the magic of a pencil on paper. On Field Notes.
On Field Notes. $9.95 for three, you guys. Come on, get it together. (rock music) So listen, I love books. You can see behind me I have a big old library here. But to trace back, the things that have been super critical in my half-wit career, it's two books here by Mr. Kuweyama, any which one of these pages, there's just, you can see I have beat this thing pretty good.
But there's just this sense of like ... There's just this sense of clarity. I'll just go dig around these things to look at the simplicity. Because listen, first thing to remember, all this has been done before. But yet, any one of these in the right context in 2014, it'll feel just as fresh today. Now, I don't think that works the same when you take something made in 2014, and try to go back there to the dawn of sort of like corporate design.
This is the stuff that I love. Corporate Identity Manual. It's just like, man ... Corporate's a weird word, especially in this town of Portland, Oregon. But you can't mess with the sort of bedrock of understanding how a logo works all over the world. Or let me just see if I can find something cool here. Oh, man, that is great. How to handle it. This idea of like, okay, here's this Louisiana Pacific.
They made this killer logo. But you really got to think, they're going to be on trucks. Big trucks, little trucks, sides of trucks, hoods of trucks. Here's how they go and look. It's one thing to design that logo, and have it just floating on this PDF, and you're sort of drunk of white space and negative space and just floating. Rarely will you see it that way. The way you're going to see it is on some stupid little Instagram in the corner, right? Or on a guys business card, or embroidered on his sweatshirt or something. That's where you're going to see it.
So at all times, show context, show context. (rock music) Okay, we're going to take a couple of those sketches that we busted out pretty quick, and we're just going to go try to rebuild it. So let's just start. Everything is a basic shape. So take this guy, and remember, command and dupe, and pull it off to the side. Then you kind of say, well, I want a little triangle out of my Symbols palette.
I've got these guys already built for quickness sake. So we're just going to jump in here, and kind of say, okay, let's get a color that kind of weird. Let's make a little line here. That's going to be our little separators here. Let's just get these things to snap on these edges, because all we're using is we're just going to try to go make four equal parts. There's one, two, three, four. So we'll grab these lines and pull them out.
We're going to center everything. The top line and the bottom line snap to these top and bottom edges. But we want to go through and make sure that those little guys are equidistant, so there you go. Now we're just going to be ... Before we do anything, we're going to click and drag and dupe it. Because here's the thing. When you look at that, you don't want to go and start tearing this thing apart until you, to make sure, because what if you have to take a step back. You have to make sure that you've got that thing. Because now we're going to look at that sketch. We're going to put these other little lines in here. Just real quick, real fast.
We're going to click and drag again. We're going to grab all that stuff. We're going to make it white. We've got a logo that we're already starting to build there, right? Look at that. That's starting to work. Then you can quickly take this little guy off to the side, group it all. Make a tiny little version of it, and then kind of just see how the feel. There's already something starting to happen there. Now it becomes the fun part. We've got something to work with. Now maybe that top was just a little too much.
We can take that little guy, and kind of scootch it in a little bit. Say, okay, that's cool. Now pull it off here to the side. Let those guys go white. And then start messing with some of this stuff, to make these big old slabs. So maybe there's an A that's starting to happen. But it's kind of getting this pyramid thing going. But now as you step back, that's another version right there. That's just a little different than what we were having happening right here.
So you can kind of see here. I've built this thing pretty quick. When you go look at your outline version, all that math is all nice and intact. You've got it live. Always keep it live. Because now if we go grab a piece of type, something's starting to happen already. It's just some big extended Akzidenz-Grotesk. So now to quickly take a look at that thing and say, wait a second. I kind of liked this one sketch where I had the A kind of working off some of the different pieces back there.
Let's go plop one in there. So we'll go grab a little triangle. We just started one right here. We're going to get rid of this guy. We're going to snap it to the bottom of here. We're going to get that thing in there. We're going to bring it down. We'll get rid of this other guy, and kind of say, okay, now we're getting into some zones here. You kind of say, all right. Maybe it's a little too much. But remember, now we've got those pieces. We can always go back to where we were.
So we can go back and say, all right. Let's try this real quick. You can take a version over here, and just quickly say, well, let's go try it to where we have the triangles on the inside of there also. So quick ways to do it are just go through, flatten that guy. What do you call it? What do you even call that thing? Just sort of minus front. Go grab those two right there.
This is just to be fast, because the math isn't going to be totally perfect. But if you got your math right, things might start to feel good. You can see here, I was doing this. All these angles were all the same, because I was using parts and pieces to subtract and minus and kind of pathfind my way out of it. You start hitting right here, you're saying, all right, man. We've got an A. We've got a little base. There's your All Base A, maybe. As we're working through this stuff, there's all sorts of pieces you can start building. Now I put it in some shapes.
I put a little type next to it. You can see there. Man, that thing's feeling pretty good. As I start working my way over, it's like, what if there's a gradation? What if there's this little base part that's a little bit darker? We've got some quick ideas of what this thing could be. There it is working in concrete. Here it is laid over a photo. Here it is as just a nice shape, and then a nice piece of type next to it. If the type isn't, if we're not feeling it, okay, that's okay, that's okay.
Because there's a lot of ways you can do it. You can do it something like this, and bring this guy in a little bit smaller, and just let it be, like, there's your patch on your hat, already done. But the cool part is, if we pull this guy out of here, it'll work that way, too. As a way to test this stuff, I have all these things built in my symbol palettes, just to kind of say, all right. Those first t-shirts for all the worker guys there.
We're just going to make some shirts for the dudes out loading up the cement. Bam. You know, we were hitting something over here, and maybe that's it right there. That might feel like a little tent or something, but we're just going fast. Now let's just grab this guy real quick, and plop something in there. Now it's not going to be quite right. But when you take this guy, and put that guy on a t-shirt, and you can kind of say, wow, man, that might work, too.
That might work, too. The thicknesses need a little bit of work. But I left all those guys live in there. So you can kind of take this and say, all right, I want that thickness to be brought up just a little bit more, so there's all three equidistant pieces. There's something starting to happen. If it isn't feeling right, you can kind of take a look at what these things could be. Here it is sort of 1960. Here's a big old house industries. Maybe to modernize this thing, if you look at some of these characters, they're these nice, big, chiseled edges.
There might be something there. Let's just get those colors all feeling right. Make sure it's all nice and centered up. You know, somethings starting to happen. At all time, as you're going through, what we're going to do is we're going to quickly take another big blast of color, and see what it feels like on a dark value. So at all times you want to make sure that this thing feels good on a dark value also.
Nowith you kind of say, well, that's kind of hard to read. That's kind of hard to read. So, okay, let's give it just a little bit of hierarchy. There's our logo. Here's our name. Stuff is starting to happen. (light rock music) That was what? A couple minutes of sketching. Bring it into the machine. Tuning things up. Seeing how things felt. I know if I go another 20 minutes, or another couple of days, that we're going to hit something and be able to show them seven, eight strong directions.
Complete with a nice rationale of why we did what we did, and what we were thinking. It's kind of like a volume knob. To kind of say, here it is, what we think it could work right now. But we get out into the ether a little bit, and it might be really fun that way. That's just sort of my job to show them a range. It all comes from here, and then quickly building it here, and then getting into a nice presentation, and well, sealing a deal. (rock music) When I went freelance in 2004 it was hard to leave, because you left health insurance.
You left 401K's. But equally my horizon opened, to where I could take on little crusty things, and then take on things that were maybe for no money. But later on trick design into hiring me. So that leap for me was just sort of like, it just really freed me up. Has freelance always been perfect? Not even close, you know. I've had guys stiff me. The client completely do like a big old 180, and you lose all the work you've done. But that's what we're up against.
I've found that in my life, working for myself, working with my buddies, has been just more, like a reason to want to get up in the morning. I feel better about it. I feel excited. I feel engaged. I can dream. I turned 40, and your bones hurt, and your back hurts, and your feet hurt, and whatever the hell else. It doesn't matter, because I need to make some new little logo for something. I can't wait to see how the sticker turned out, with the cool little kiss cut in the back, as much as the poster with six colors and flash printing and weird paper, and then how to ship them here.
Every time I turn around, there's something to deal with here. I love that little world I've sort of built for myself.
Our approach to deconstruction and analysis needs to be just as thought out and rationed as our creative process. This is why we devote a significant part of our time together to analysis, philosophy, and theory. In our next lesson, we take the next step–merging the analytical and the creative as we classify the results of our research and analysis into clusters of opportunity we refer to as White, Gray, and Black Spaces.
Applying Our Analytical Lens
To refresh ourselves, our goals specifically for this Lesson are to:
- critically evaluate sustainability filings and stated strategies through the lens of an organization's stated mission, vision, and values;
- articulate the role GRI plays–and does not play–in an organization's sustainability reporting;
- analyze filings through omission, indicator, narrative, and commission analyses;
- propose public sustainability filings as a platform for innovation and competitive advantage;
- discern what the major filings do–and do not–require an organization to do to comply.
To these ends, this week's case will allow us to open the palette a bit and find our own areas of interest and perform our own critical analysis using available data.