Part 1: Data and Data Collection

Dr. Smart Asks Kim to Write a DMP
A new graduate student, Kim, has just come on board Professor I. B. Smart's research team. For Kim's first assignment, Dr. Smart has asked her to prepare the data management plan for a grant proposal he is writing. He has gathered initial data and asked Kim to look at them to determine what's been collected and how to begin describing the data. Kim's assessment will help both her and Dr. Smart understand the data types and formats the proposed project will address.
In this part, you will be able to describe the types of data that will be collected during your research, with attention to the following:
- Method of data collection
- Approximate quantity (also growth rate and rate of change) of data
- Tools or software needed to produce, process, and analyze (also visualize, if applicable) the data
1.1 Method of Data Collection
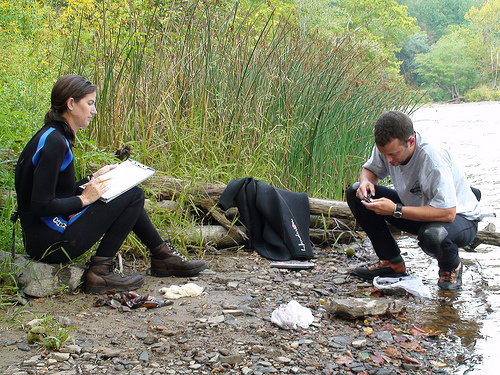
In this part of the DMP, provide a brief statement on your research methodology, addressing the goals of data collection and how you will collect your data. This is also where you may discuss the design of the research project and integrate any information about, or references to, secondary data - perhaps data generated previously for a different project that might impact or influence this one.
For example, do you plan to conduct a survey or interviews, use observational or experimental techniques? You will need to describe each in enough detail that the reader can understand your plan as well as judge the appropriateness of the technique. If you plan to utilize existing data, you will describe the source.
1.2 Data Types
Along with describing your method of data gathering, you will need to state the types of data the project is likely to produce.
Occasionally, grant funding agencies provide guidelines on types of data to document. If you are applying for an NSF grant, then check to see if the directorate overseeing the grant program offers any guidance on data types to be documented.
Research data comes in many flavors and may be classified or categorized as the following (from the U. Edinburgh, “Defining research data” (pp. 5-6), in Edinburgh University Data Library Research Data Management Handbook [3]):
- sample or specimen data
- observational (e.g., sensor data, data from surveys)
- experimental (e.g., gene sequencing data)
- simulation (e.g., climate modeling data)
- derived or compiled (e.g., text mining, 3D models)
- reference or canonical (e.g., static, peer-reviewed data sets, likely published or curated, such as gene sequence databanks or chemical structures)
While certain kinds of data can withstand benign neglect, most digital data requires a more active approach for preservation as described by Ben Goldman, Digital Archivist at the Penn State University Libraries.
1.3 Data Formats
In addition to documenting the types of data likely to be collected, a DMP also describes the format(s) the data are likely to take. Experienced researchers are familiar with how frequently formats and storage devices change. Dr. Stephenson describes his experience in the following video.
The formats that research data can take include, but are not necessarily limited to, the following (from the U. Edinburgh, “Defining research data” (pp. 5-6), in Edinburgh University Data Library Research Data Management Handbook [3]):
- Text files - MS Word docs, .txt files, PDF, RTF, XML (Extensible Markup Language)
- Numerical - SPSS, Stata, Excel
- Multimedia - jpg / jpeg, gif, tiff, png, mpeg, mp4, QuickTime
- Models - 3D, statistical
- Software - Java, C, Python
- Discipline specific formats - Flexible Image Transport System (FITS) in astronomy, Crystallographic Information File (CIF) for crystallography
- Instrument specific formats - Olympus Confocal Microscope Data Format, Carl Zeiss
- Specimen collections
Other factors to consider when thinking about data formats include whether the format is proprietary or is an open, community-supported standard. Some formats that are proprietary, such as .docx and .xlsx, are widely used, that it is likely they will be around for a long time, thus avoiding format obsolescence.
The use of formats that are open, well-documented standards with robust usage by researchers helps ensure that your data will be accessible over the long term (from “File Formats for Long-Term Access,” [6] at MIT’s Data Management and Publishing site). Ben Goldman describes some resources available to help researchers select appropriate formats in the following video.
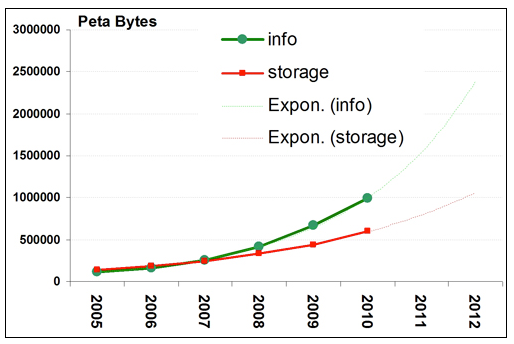
1.4 Data Quantity and Rate of Growth
If possible, a DMP should estimate how much data is expected to be generated and the rate at which it will likely grow. Such an approximation will also inform storage capacity and other related needs.
Some questions to consider, if data collection has already started, are the following:
- Where and how are the data currently stored?
- How long has data collection been occurring?
- During this period, how much data has been collected or generated?
- How much storage capacity is the collected data using?
- How frequently have you needed to access the data?
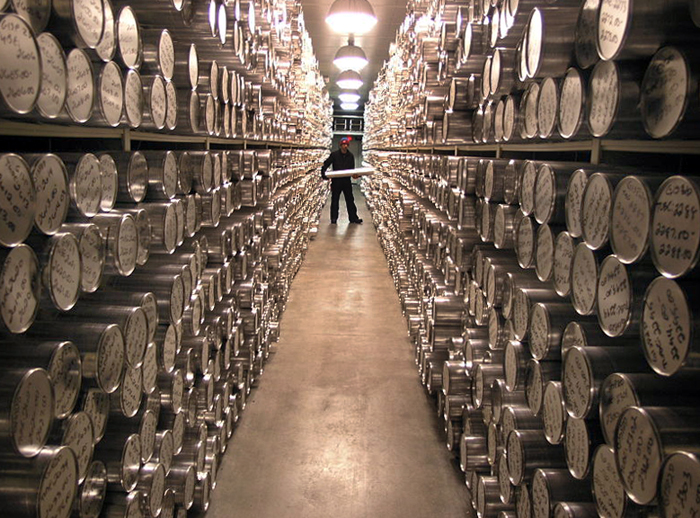
If a specialized storage facility or capability will be required, it should be described in this section. This is more common for collections of non-digital resources such as physical samples, but may be helpful to address with other data types as well.

1.5 Tools or Software to Interpret and Manipulate Data
In addition to describing data types, formats, and quantity, provide a statement about any tools you will use in order to produce, process, and/or analyze the data. Include any tools that the project is likely to leverage for visualization or display of the data. Also, mention any additional materials that will be provided in order to help others who are interested in using your data to understand them.
It is always helpful to describe the software and version used to record your data, if in digital form. In the video below, Ben Goldman describes some of the challenges digital archivists face related to dealing with obsolete software formats.
Examples of tools and software used to interpret and manipulate data:
- Spreadsheet software such as Excel
- Visualization software
- Mapping software such as ArcGIS
- Statistical programs such as SAS, SPSS and Minitab
- Survey software such as REDCap, ....
- Hardware for data capture such as digital cameras, scanners, telescopes...
- Measurement devices such as calorimeters, gauges, scales, thermometers, ...
For any of these tools, it is useful to record the version or model. For example, what software version did you use? What model of scanner? What resolution was used? Other supporting information that might help understand how the data was collected or encoded is useful. For example, knowing that the instrument reported data in metric units, to a particular accuracy, etc. is particularly helpful information for future users of your data. Other types of useful data include codebooks and calibration information.
Click to expand to provide more information
At Chicago, bound books and pamphlets were scanned using both Epson Expression 1640XL flatbed scanners and a Minolta PS 3000 with a grayscale board. Books from the General Collection and pamphlets that opened flat were scanned on the flatbed scanners at 8-bit grayscale at 300 dpi or 400 dpi (depending on the quality and size of the printed text) using Lasersoft Silverfast 5 and saved as uncompressed TIFF files. Image files were cropped at the page edge and edited using Adobe Photoshop 5.5.
In order to minimize stress to fragile bindings during scanning, Special Collections bound books were scanned face-up on the Minolta PS 3000 at 8-bit grayscale 400 dpi and saved as high-quality JPEG files using ISE-Scan software. The option to save these files as uncompressed TIFF files in grayscale was not available. It was somewhat difficult to get good-quality scans of some of the texts scanned on the Minolta, due to faint ink, waviness of the paper in the original, or tight bindings, all of which caused a blurry scan and necessitated re-scanning. Image files were cropped at the page edge and edited in Adobe Photoshop.
At the Filson Historical Society, all books and pamphlets were scanned on an Epson Expression 836XL flatbed scanner at 8-bit grayscale 300 dpi, except for color plates and title pages from rare or significant texts, which were scanned in 24-bit color. All files were saved as uncompressed TIFF files and edited in Adobe Photoshop.
1.6 Summary
Your DMP should describe briefly the research methodology for your project - i.e., how you will collect data for your project and what the goals of such collection will be. Will there be secondary data from a previous or existing project that you'll use? Be sure to integrate any additional information that will help reviewers understand clearly your project and the techniques you'll be implementing.
Be sure to note the types of data you'll be collecting - e.g., specimen, observational, experimental, simulation, derived, etc. The DMP should also state what formats your data will be in - will they be text files, numerical data, modeling data, software code? Use, where possible, open-source (i.e., non-proprietary) formats - or, at the very least, formats in heavy use by your research community. For example, many researchers use Excel to keep track of data they're collecting; though a proprietary format, it's almost ubiquitous usage is providing assurances that it will subsist for some time.
In addition, the DMP should describe the tools or software you'll rely upon to make sense of the data and perform analyses on them.
Finally, in writing about your research methodology and data collection practices in a DMP, try to estimate how fast (or slowly) your data will grow. Where will the data be kept? How much storage is it possible to anticipate to cover the expected rate of data growth? How often will you need to access the data you're collecting? If there are data from an existing project, then it might prove a relevant exercise to revisit data from a previous project and see if the rate of growth could be tracked over a certain period of time.

Check Your Understanding
In each example below, choose the preferred format to ensure accessibility for the long term:
(a) .doc
(b) .txt
 Click for answer.
(a) TIFF
(b) GIF
Click for answer.