Module 8: Water Resources and Climate Change
Module 8: Water Resources and Climate Change
Video: Earth 103 Water Module (2:04)
Today, there are more than a billion people living without access to clean drinking water and that's really hard for us to imagine on the east coast of the United States, where there is water everywhere. Today, I'm standing in a stream near Lemont, Pennsylvania. And if I were here a hundred years ago, I would have readily taken a sample of this water and drunk it. But I’m not quite so sure about that today. There are factories around, there's farms around, and this water is probably not quite good enough to drink. This stream behind me is a tributary to the Chesapeake, and ultimately this water ends up in the Chesapeake Bay, and if I can't drink this water here in rural Pennsylvania, can you imagine what it's like by the time this water gets to the Chesapeake? It would definitely be a bad decision to drink the water flowing into the Chesapeake Bay today.
The other part about being on the east coast of the United States is we're in a lush region, and climate change here is forecasted to make this region maybe a little bit more lush and a little bit higher rainfall in the future. We'll never have a problem with access to drinking water in this part of the world. But if we go out to the western part of the U.S., climate change forecasts predict that the region will become a lot drier, and communities out west in the U.S. are going to have to make really tough decisions as to how they manage their water resources. Such tough decisions have already been made in places around the world such as Australia, where devastating droughts over the last two decades have led rivers to virtually reverse course, and communities have had to make very tough decisions about how they manage their water resources.
So, in this module, we'll learn a lot about how water behaves on the surface of the planet, what is going to happen in the future with climate change, and the choices communities are going to face with dwindling water resources. Now, enjoy it, and please get started.
Introduction
There is a new generation of super-rich, highly influential people who are starting to invest massive amounts of money and influence in truly important causes. Bill and Melinda Gates in global health, Warren Buffett in reproductive health and food, the Jolie-Pitts in community development, and the Katrina recovery effort. Now, enter Matt Damon and Gary White who have co-founded water.org, an organization dedicated to developing and delivering solutions to the global water crisis. Visit water.org [2] and you will find an impressive array of information and programs. Here are direct facts from that site that convey the magnitude of the current global water emergency.
- Nearly 1 billion people are living without accessible water
- 2.5 billion without adequate sanitation
- 440 million school days lost
- 220 million hours each day are spent collecting water
- 3.7 miles walked each day by women and children
- 4100 children under five die each day from a preventable water-related illness
- 3.4 million people die each year from a preventable water-related disease
More than any other resource, with the exception of food, water is crucial for human survival. Ancient civilizations were repeatedly forced to deal with the threat of diminishing water supply. Now, climate change presents a new threat by causing the supply and distribution of water to change over the coming decades and centuries. This situation will be made significantly more dire by explosive population growth in parts of the world where water is scarce and by pollution that will continually limit the supply of clean drinking water. The IPCC (2007) stated the situation very clearly: “Water and its availability and quality, will be the main pressures on, and issues for, societies and the environment under climate change.” The latest 2022 report stresses the need for adaptation. This will be much easier in the developed world than in developing countries where resources are limited.
Because groundwater systems recover very slowly from human impacts, remediation can be extremely difficult and expensive. In this module, we begin by examining the distribution and behavior of water close to the Earth’s surface; next, we consider how climate change will alter the supply of water and how population growth will change the demand; finally, we present management strategies that will hopefully preserve the supply of water for humans around the globe.
Ancient civilizations developed in some of the driest realms of the planet. Populations in Egypt and Mesopotamia (an area that includes parts of modern Iran, Iraq, Syria, and Turkey) learned how to survive in an arid environment. For example, ancient Egyptians and Mesopotamians constructed an extensive network of canals to transport water away from the Nile River for irrigation. Shadufs, which are contraptions consisting of buckets at the end of a boom which could be lowered with a rope, were used to haul water out of the canals and onto the fields. These civilizations routinely had to live with highly irregular precipitation consisting of periods when large amounts of rainfall flowed through the canals and flooded large areas, alternating with times of almost no rainfall.
Examples of Ancient Civilizations
As the population has increased, and especially with the rise of industry in developed nations, so has demand for water soared. Moreover, industry has increased competition often for the cleanest drinking water supplies.
Nowhere has the interplay between the increasing demand and limited supply of water been more complicated than in the desert southwest of the US. The city of Los Angeles receives a meager 38 cm (15 in) of rain a year. Yet, the city has the highest water usage in California and some of the highest use rates in the country. You would never know by looking at the number of golf courses and car washes and the abundance of lush, green lawns that the city is located in a desert. The same is true for Las Vegas, which receives significantly lower rainfall and is one of the fastest growing cities in the US.
Los Angeles uses much more water than it receives from precipitation and, thus, it imports water from the northern part of California and from states to the east via the Colorado River. In fact, much of the development of Los Angeles was fueled by this supply of water from the Owens Valley in the Sierra Nevada and the Colorado River to the east. Water from the Colorado River began to flow into Los Angeles in the 1920s and 1930s and included the construction of Parker Dam and the Colorado River Aqueduct.
Water Supply and Demand
The growth of other cities that lie in arid locations closer to the Colorado River, including Denver and Phoenix, will likely lead to bitter litigation over water rights in the southwest in the coming decades. Water supply to the Colorado River is declining markedly as a result of climate change and this is clashing with booming growth of these soutwestern cities. In Spring 2023, the US government brokered a deal with the southwestern states that includes a 13 percent decrease in water supply from the river. This will mandate major consrvation efforts and slower growth. Overseas, countries in arid parts of the globe, for example, Turkey, Iraq, and Syria have also had major disputes about water rights and management. Turkey, which lies at the source of the Tigris and Euphrates rivers, has constructed dams on both rivers for irrigation purposes as well as for hydroelectricity, and this has led to long conflicts with countries downriver including Syria and Iraq.
With projections for the increasingly rapid growth of world population and coupled demand for water for drinking and agriculture, as well as for industry, maintaining a clean water supply looks to be one of the grand challenges of the 21st century. The goals of this module are to learn about how water is cycled on the Earth’s surface and how climate change coupled with the growth of the population will accentuate the global water crisis.
Goals and Learning Outcomes
Goals and Learning Outcomes
Goals
On completing this module, students are expected to be able to:
- describe the processes that affect the flow of water in aquifers;
- explain how human activity is impacting the quality of water;
- predict how climate change will affect water supply in different locations;
- propose strategies to cope with an increasingly thirsty planet.
Learning Outcomes
After completing this module, students should be able to explain the following concepts:
- the uneven distribution of water on Earth’s surface
- how water is cycled near the Earth’s surface
- behavior of water in aquifers
- the concepts of permeability, porosity, water table
- causes of land subsidence
- causes of cone of depression and groundwater contamination
- arsenic groundwater contamination crisis
- cause of saltwater incursion
- climate change predictions for water supply
- drought and its consequences in different parts of the globe
- water management, including desalinization
- the growing battle over water in the western US
Assignments Roadmap
Below is an overview of your assignments for this module. The list is intended to prepare you for the module and help you to plan your time.
| Action | Assignment | Location |
|---|---|---|
| To Do |
|
|
Distribution of Water on the Earth’s Surface
Distribution of Water on the Earth’s Surface
Introduction
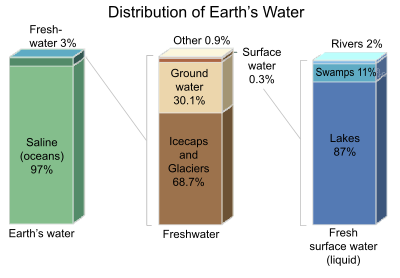
The distribution of water on the Earth’s surface is extremely uneven. Only 3% of water on the surface is fresh; the remaining 97% resides in the ocean. Of freshwater, 69% resides in glaciers, 30% underground, and less than 1% is located in lakes, rivers, and swamps. Looked at another way, only one percent of the water on the Earth’s surface is usable by humans, and 99% of the usable quantity is situated underground.
All one needs to do is study rainfall maps to appreciate how uneven the distribution of water really is. The white areas on the map below had annual rainfall under 400 mm for the last year, which makes them semi-arid or arid. And, remember, projections are for significant aridification to occur in many dry regions and for more severe rainfall events to characterize wet regions.
The Water Cycle
The Water Cycle
The following video provides a schematic summary of the water cycle.
Video: The Water Cycle (1:23) This video is not narrated.
The hydrologic cycle describes the large-scale movement of water between reservoirs including the ocean, rivers and lakes, the atmosphere, ice sheets, and underground storage or groundwater.
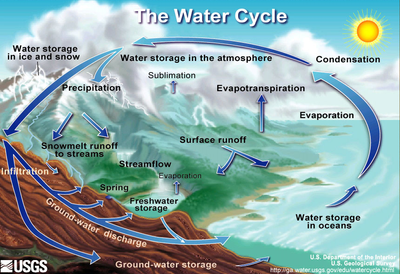
Water evaporates from bodies of water such as the ocean and lakes to form clouds. The moisture in clouds ultimately falls as rain or snow, some of which returns back to the ocean, lakes, and rivers. The remainder percolates into the soil, where it reacts with organic material and minerals and ultimately moves downwards to form groundwater. The amount that percolates depends strongly on evaporation as well as soil moisture, as shown in the video below.
Video: NASA Land Globe Animation (1:00) This video is not narrated.
As rain and snow fall to earth over the land, the increase in water competes with the loss of water due to daylight evaporation.
Precipitation:
0.01 to 10 millimeters per hour in steps of (0.01, 0.1, 1, 10)
Different kinds of soil retain different amounts of water in the ground, so the flow of rivers and the filling of underground aquifers can be hard to predict.
Rate of change of total land water:
-1.5 to 1.5 grams per square meter per second in steps of (0.5)
Freshwater used for drinking, agriculture, and industry derives dominantly from rivers, lakes, and groundwater, with the latter reservoir accounting for approximately 30 percent of freshwater on the earth’s surface by % of potable (i.e., safe drinking) water. In the US, 86% of households derive water from public suppliers, and 14% supply their own water from wells. Nevertheless, households utilize only one percent of water extracted, the remaining 99% of water is supplied to industry (4%), agriculture (37% compared to 69% worldwide), and thermoelectric power plants (41%). Water use in most areas of the US has increased substantially over the last century.
Check Your Understanding
Lab 8: Stream Flow
Lab 8: Stream Flow
Download this lab as a Word document: Lab 8: Stream Flow [7] (Please download required files below.)
In this lab, we will observe the impact of precipitation on stream flow and flooding. The practice and graded sequence of steps are identical. Please go through the following sequence of questions for the practice, check your answers in the Practice Lab, then take the Graded Lab when ready.
Practice Questions
The US Geological Survey maintains the water watch website, which shows the current state of stream flow, drought, flood, and past flow and runoff. We will focus on stream flow data, and you will be required to summarize national trends. The data are expressed as percentiles over normal stream flow for the date of interest. The site has an animation builder [8] that allows you to observe changes in stream flow over short periods and intervals back to 1999. The animations show both regular stream flow and flood stage locations.
Observe the flood and stream flow animations for the following intervals, and describe what you see in terms of major floods and general stream flow. (You can toggle back and forth between these two kinds of animations using the Map Type menu on the animation panel; Real-Time is general stream flow, while the Flood maps show black triangles for places where the streams are actually flooding above their banks.)
Using the USGS animation builder [8], answer the following practice questions:
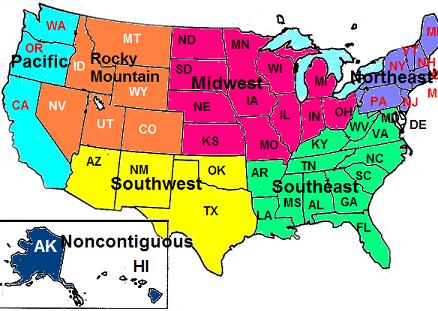
- Between 1st July and 31st August 2010 — which region of the US experienced the most flooding? Use the map below of regions in the US to help you answer this question. Note this is the first part of a two-part question.
- When do the major floods occur between 1st July and 31st August 2010? Note, this is the second part of a two-part question.
- How does the July and August 2010 flooding relate to precipitation anomalies? To figure this out, go to the Federal Ministry of Transport, Building and Urban Affairs [10] website and set up the visualization parameters according to this screenshot:
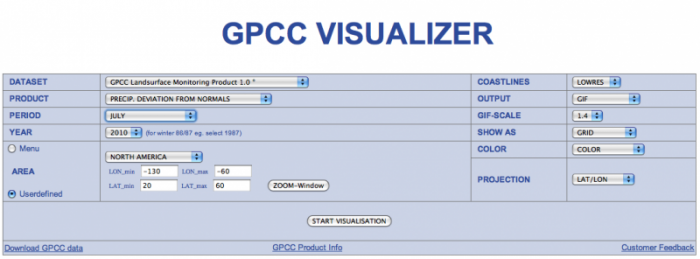 GPCC VisualizerCredit: US Geological Survey
This will show you precipitation anomalies relative to the monthly mean for the 1950-2000 period, in millimeters per month. Then review the months of June, July, and August, comparing these images with the flood occurrences. During June, July and August 2010, the increase in flooding coincided with ________________? - In what region do major floods happen in August 2011? (Refer to the map in Question 1 to see which states are in which regions.)
- How does the timing and location of August 2011 flooding relate to hurricane activity in the Atlantic? (Hint: Do a Google search for 2011 Atlantic hurricane season). The peak flooding in August 2011 coincides with the landfall of which hurricane?
- Where are the major floods in early December 2010?
- Are the December 2010 floods in the eastern portion of the country more likely related to a prolonged period of high precipitation, a hurricane, or a brief, strong storm system moving through the area?
- What is the relationship between the December 2010 floods in the western part of the country to ENSO? December 2010 was during a La Niña event. Go to the National Weather Service Climate Prediction Center [11] to see what the typical pattern of precipitation is for the US during a La Niña event.
If you run your cursor along the column of letters on the left side, you can see the maps of precipitation anomalies for 3-month periods, so you could look at the maps for NDJ (November, December, January) and see what the typical precipitation anomaly is. For more explanation of these maps, click on the link in the upper right of the window that says "Information on Data, Methods, and Interpretation."
December 2010 was a La Niña year. During a La Niña year, the southern US experiences _______precipitation and the northern US experiences ______precipitation.
In the second part of the lab, in Google Earth, we will observe discharge (in cubic feet per second) for various points along the Mississippi during the devastating floods of 2011. Stream gages are planted in the middle of the river, and the gage measures the volume of water passing through a known volume during a known time. The units are in cubic feet per second.
River Height and Discharge
Please load the Google Earth Mississippi River Stream Gages Updated [12]kmz [12] file [12]. Make sure you look at the dates correctly as well as the discharge axis scale. Please answer the following questions: - Roughly when is peak discharge at Winona, Minnesota (give your answer in month date format. e.g., November 05 for November 5th).
- Roughly when is peak discharge at St. Louis, Missouri (give your answer in month date format. e.g., November 05 for November 5th).
- What is the peak discharge (in cubic feet per second) at Winona? (to nearest 50,000 cubic feet per second). Just give a number.
- What is the peak discharge (in cubic feet per second) at St. Louis (to nearest 50,000 cubic feet per second)? Just give a number.
- Generally, is stream flow increasing up or down river?
- Why does discharge increase so abruptly at St. Louis? (Hint: Look at the Google Earth Map in the St. Louis area very closely.)
A. Because of runoff from the city
B. Because the Missouri River flows in at that point
C. Because the river triples in width
D. Because the river deepens significantly
Behavior of Water
Behavior of Water
Because of the significance of this groundwater for human use, we consider the behavior of water underground in some detail here. It might seem complex at first, but water flow follows very simple laws of physics.
Water Tables and Aquifers
Water at the surface of the Earth seeps slowly into the soil, a process known as percolation. Water will percolate through the uppermost layer of soil and loose material that contains air, the aerated zone, down to a level called the water table. The water table is at the top of the permanently waterlogged or saturated level.
The water table is a critical level because it determines the level of groundwater available for drinking and irrigation. The flow of water underground is controlled by a number of factors, including the permeability of the aquifer and the hydraulic gradient. Explained simply, the hydraulic gradient between two wells is the difference in hydraulic pressure (known as hydraulic head) divided by the distance between them. If the difference in hydraulic head is high, water will flow readily; if the difference is nil, then water will only flow if pumped. The hydraulic gradient at points at the top of the water table is generally level.
Relationship between porosity and permeability
- Crystalline Igneous Rock - low porosity and low permeability
- Clay-rich layer (many small pore spaces) - high porosity and low permeability
- Quartz Sandstone - high porosity and high permeability
- Glacial Till - low porosity and low permeability
The permeability of a rock is a function of a number of factors that include the amount of pore space, the arrangement of pores, and the amount of surface tension from grains, especially tiny (micron-sized) clay minerals that have very high surface area. The larger the pore space, the more connected the grains and the less clay, the higher the permeability, and the more easily water flows. Conversely, where pore space is tight and poorly connected, and there is a lot of clay, permeability is low and water cannot flow readily.
The best aquifers are often made of rocks with both high porosity and high permeability, such as sandstone, but rocks with generally lower porosity can also be highly permeable. For example, limestone is often jointed and is readily dissolved by groundwater, leaving the rock highly permeable; rocks such as granite and basalt are often heavily fractured allowing water to flow readily. Some of the most productive aquifers are called “contained” or “confined,” and are sandwiched between low-permeability layers called “aquicludes.” Common aquicludes are shale and mudstone layers. Such contained aquifers can have a high hydraulic gradient because the aquicludes hold a significant hydraulic head; confined aquifers often produce wells called artesian wells that, owing to substantial confining pressure, produce water without pumping.
In other cases, the tops of aquifers are not confined by an impermeable layer. Such aquifers are called unconfined and will, all other things being equal, be characterized by less confining pressure. Groundwater is continuously exchanging with other reservoirs in the hydrological cycle. Aquifers are recharged with water from rain and snow percolating through the aerated zone. Conversely, groundwater flows back into rivers and lakes or into wells and springs in a process known as discharge. The time water spends underground is called the residence time, which varies from a few days to 10,000 years or more. As we will see later, the water table can move downward as a result of drought, and this is happening in arid areas today.
Check Your Understanding
Current Water Problems
Current Water Problems
Introduction
Communities around the world are facing a variety of different problems related to the supply of water. Many of these are not new, having been faced by ancient civilizations, for example, the problem of irrigation in desert regions. A number of problems are becoming more urgent as a result of population growth and demand on aquifers. Improving understanding of groundwater behavior and remediation and advancing technology are helping to solve some of the most pressing problems; however, many groundwater issues continue to become more dire through time, especially in developing nations. Here, we discuss some of the most pressing problems. We stress that these problems are experienced globally, although we provide regional and local examples.
Land Subsidence
Land Subsidence
Like any layer in the subsurface, aquifers, and aquitards structurally support the overlying strata, and in turn, the ground level. If an aquifer is excessively pumped, water is drawn in from the surrounding aquitards. In cases where the aquitards are soft and unconsolidated, for example, composed of clays and silts, overpumping can cause these layers to fail structurally, expel much of their water, and literally collapse. When this happens, the overlying ground level can be lowered as a consequence, a process known as subsidence.
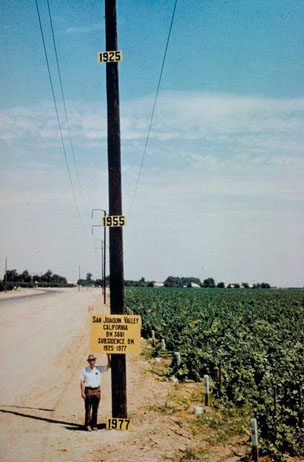
In the case of arid regions where aquifers are naturally recharged at very slow rates and where they are pumped intensively, significant subsidence can result. Some of the most drastic and best-known subsidence resulting from overuse of aquifers occurs in the San Joaquin and Sacramento Valleys of California, where the land level has subsided up to 10 meters in the last 90 years.
The San Joaquin and Sacramento rivers flow together in an area called the Sacramento-San Joaquin River Delta, an inland version of the Mississippi Delta where a series of tributary channels meander over a low-lying, flat plain. The area is an inland estuary with the Pacific Ocean on its western edge. The Delta area, as it is known, is some of the most productive farmland in the nation and provides 70% of the water supply of northern California. The water in the Delta channels has been controlled by human-made earthen levees to prevent flooding of low-lying agricultural areas as well as large developed areas including parts of the cities of Tracy, Stockton, and Sacramento. The 2600 mile long levee system has been built over more than 100 years and is beginning to suffer from the test of time. Subsidence has occurred as a result of oxidation of organic material in soils and compaction from farming, and the structures have been weakened by erosion and seepage. Areas behind the levees have subsided by up to 25 feet, placing further strain on the structures. Failure of levees has already occurred over 30 times in the last three decades, leading to substantial flooding, massive evacuation and six fatalities in Marysville in 1997.
Flooding in California due to levee breaks
Levees in the delta are maintained by the Army Corps of Engineers to withhold the strain of a 100-year flood. However, increased precipitation as a result of climate change has led some to question the Corps’ definition of the 100-year flood, and the same critics warn of catastrophic levee collapse, which could lead to massive numbers of fatalities and enormous property damage. Ultimately, what is required is a significant investment in fortifying levees to prevent this from happening.
Subsidence as a result of overpumping is actually a relatively common problem, especially in areas with rapid population growth, for example around Las Vegas, which until recently was the most rapidly growing city in the US. In Las Vegas, water use has exceeded recharge for many decades, leading to structurally controlled subsidence of up to 2 meters along pre-existing geological faults. Subsidence of some 3 meters has also occurred in the area around Houston as a result of population growth combined with extraction of large amounts of oil and gas from the subsurface.
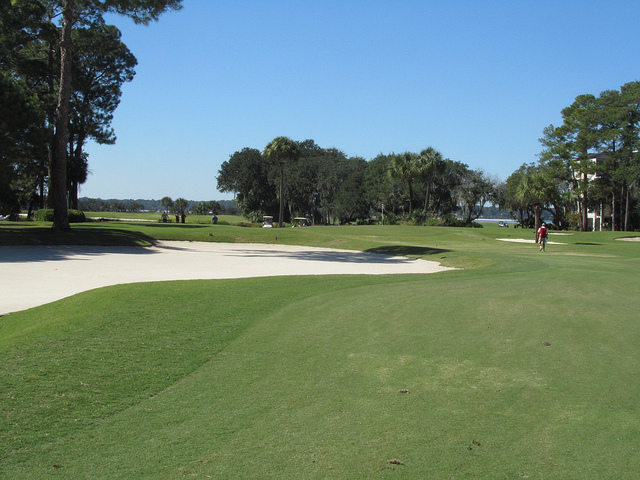
As we will study in detail in Module 10, significant subsidence in the Mississippi Delta region around New Orleans has resulted partially as a result of over-pumping. Even along the east coast of the US in the Carolinas, subsidence, although not as severe as out west and along the Gulf Coast, has resulted from over pumping for agriculture and industry. In fact, one of the major demands on water in the Carolinas is for golf courses (see the lush grass in the photograph above), which account for about 60% of irrigation usage in some areas.
Without major changes in water usage and conservation, subsidence will continue and even accelerate into the foreseeable future.
Cone of Depression
Cone of Depression
Overuse of groundwater does not have to lead to major land subsidence before it causes problems. On a more local scale, over-pumping can result in lowering of the water table in a process called “cone of depression,” a generally concentric pattern of water table drawdown. Such over-pumping often results from industry or agriculture, but individual landowners often feel the repercussions.
Alternatively, a cone of depression can result when housing developments, particularly those with many small lots, use wells for water supply. A cone of depression can drastically decrease water pressure, or worse, lower the water table below the level of the well, leaving a home or a farm without a water supply. The only solution for this is to drill the well deeper, which can be an expensive proposition for an individual landowner. Left unchecked, a cone of depression can modify the flow of groundwater as well as the distribution of pollutants,
Groundwater Contamination
Groundwater Contamination
Contamination of groundwater supply can occur as a result of natural processes as well as industry and agriculture. Probably, the most lethal and extensive groundwater pollution problem globally is actually natural in origin: the contamination of groundwater with high concentrations of arsenic. Approximately 100 million people globally are exposed to high levels of arsenic in groundwater. Nowhere is the problem more devastating than over large regions of Bangladesh and the West Bengal region of India, where millions have been poisoned by arsenic. This area is intensively irrigated, which has changed the flow of groundwater over a large region. As a result, a shallow aquifer is the source of groundwater for 35-77 million inhabitants who obtain their water from shallow tube wells.
Arsenic in Groundwater
High levels of arsenic in this water likely derive from microbial activity that dissociates arsenic from organic material. Arsenic is highly poisonous and carcinogenic and long-term exposure to it can lead to high incidences of skin lesions, bladder, lung, skin and kidney cancer, respiratory disease, and liver and kidney disease. Because the threatened regions are heavily populated, this pollution has made millions of people sick and caused thousands of deaths each year. Even though the hydrology of the affected areas is not well understood, the solution to the arsenic contamination issue involves a combination of extensive monitoring, closing down high-concentration wells, distribution of filters and chemicals to remove arsenic from drinking water, and ultimately tapping deeper aquifers.
The following video provides an overview of the arsenic problem in Bangladesh.
Video: Bangladesh: Traces of Poison in Water (5:03)
Announcer: From United Nations television: This is UN In Action.
Narrator: Bangladesh awash with an abundance of water. Monsoon rains blanket the country during the wet season. All over the countryside, thousands of shallow wells have been dug using this traditional technique.These wells offer life during the long, dry season: water to drink, water to clean, water to live. But in early 1990s, dangerous levels of arsenic water were detected in these shallow wells. Suddenly, an unseen poison threatened Bangladesh's water supply. The crisis has led to a long and arduous search for safe water in the country over the past 20 years. Dr. M. Khaliquzzaman from the World Bank.
Dr. M. Khaliquzzaman: The arsenic issue was identified in the early 90s in Bangladesh, and roughly about 35% of the whole country is now infested with this problem. The amount of people involved is more than 50 million. So, this is a huge, huge problem.
Narrator: Almost overnight, one of the country's bountiful blessings became a deadly curse. Yan Zheng from UNICEF.
Yan Zheng: Arsenic is very interesting because interacts with cells the genes in many, many different ways. So, it is a toxin. It's probably one of the only environmental toxins that attacks more than one organ in human body. And it also causes various gene mutation or expression differences that other environmental carcinogens just incapable of doing.
Narrator: This villager has dealt with the effects of arsenicosis for over 20 years. Arsenic can create painful lesions on the skin and cause various cancers.
Villager (translation): It was hurting so much, I wanted to cut it out.
Narrator: As part of the arsenic mitigation efforts,, the International Atomic Energy Agency (IAEA), in collaboration with the Bangladesh Atomic Energy Commission, has used nuclear techniques since 1999 to help locate safe water. Called isotope hydrology, they discovered that arsenic occurred naturally in the groundwater. By analyzing the age of groundwater and tracking its movement, they have helped predict where safe water can be found. Once the cause was discovered, villages were discouraged from digging shallow wells. Water from this well might be used to clean clothes but will not be safe for drinking or cooking. Nasir Ahmed from the Bangladesh Atomic Energy Commission.
Nasir Ahmed: This shallow aquifers is highly contaminated. The deep aquifer is one of the solutions for providing the safe and sustainable the water supply to the rural people.
Narrator: Working in 12-hour shifts, these men drill deep into the ground to find safe water for a village. It will take a week to reach 700 feet, where water is free from arsenic. In the town of Chapai Nawabganj, the IAEA and World Bank have used isotope analysis to find safe water. The discovery helps Bangladesh to save lives and money and investments needed for arsenic removal and water treatment plans. People now know that the best treatment for arsenic poisoning is drinking safe water, says this villager.
Villager (translated): If we get safe water, that's the real medication for us. Water is life. No one can live without safe water.
Narrator: Enormous progress has been made in projects like these over the past 20 years. Yet more needs to be done to ensure that clean drinking water in this country would remain arsenic-free long into the future.
This report was produced by Dana Sachetti for the United Nations
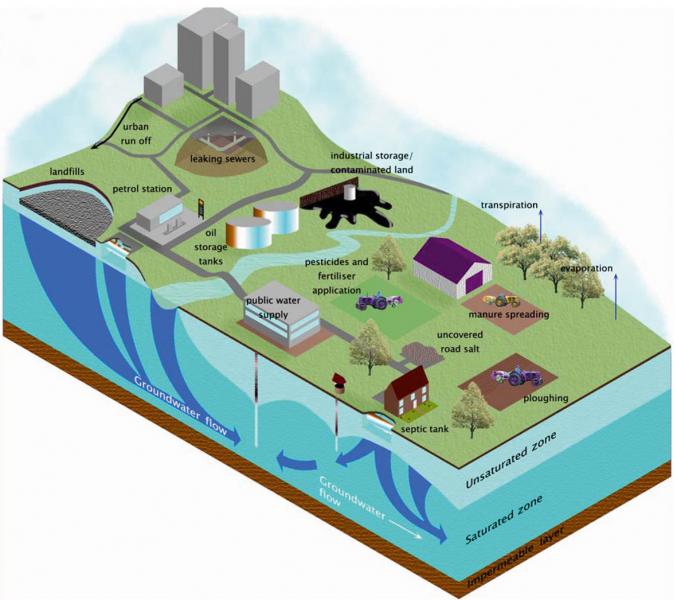
Pollution from agricultural and industrial sources is common, although not always as lethal as arsenic poisoning. Typical sources of industrial pollution include solvents, gasoline and other hydrocarbons, paint, and heavy metals. Pollution from agricultural sources includes pesticides, herbicides, and fertilizers. Many of these pollutants are carcinogenic. Both sources of pollution can lead to the growth of toxic microbes. Agricultural and industrial runoff can deliver pollutants into groundwater systems
Human and agricultural sewage is another potential source of pollution. This pollution leads to a variety of different impacts on health all the way from gastrointestinal illness to, in severe cases, cholera, typhoid, amoebiasis, giardiasis, and E. coli.
The following video explains the sources of groundwater contamination.
Video: Groundwater Contamination (4:35)
Narrator: Do you know where your drinking water comes from? Do you know what happens to all of the chemicals that you use day to day? Things such as cosmetics that wash down the drain? Pharmaceuticals that flush down the toilet? Motor oil running off parking lots, and even paint down a drain? Many of these chemicals eventually make it into the water that flows underground. Dr. Barb Mahler, a scientist at the United States Geological Survey, an adjunct professor at the University of Texas, is studying what happens to chemicals like these after most of us forget about them.
Dr. Barb Mahler: Most people don't think about the fact that there's water underground. And what happens is when it rains, some of that water infiltrates into the surface, and some it makes it all the way down to the water table. And that water table isn't static, water actually moves underground. And so, that's why we have water in creeks. Water is flowing underground and discharging into creeks, and then it becomes surface water. In karst aquifers, the water is flowing through spaces that have dissolved out of the rock. And we don't usually think of rock as dissolving. I mean, granite doesn't dissolve. And that's the interesting property that limestone has, is that when it comes into contact with water that's just a little bit acid, like rain water's a little bit acid, soil water is even a little bit more acid, there's a chemical reaction. And the rock, itself, dissolves.
Karst aquifers, such as the Edwards Aquifer in Central Texas, can be more vulnerable to contamination. But why is this? Dr. Mahler is studying what happens in aquifers with a class of contaminants known as PAHs.
Dr. Mahler: You can kind of imagine, most aquifers you could think of as a big sandbox. And the karst aquifer you'd think of maybe as a block of concrete that you'd cracked and then dissolved out some tubes through it, a system of tubes. And if you were to pour something poisonous, like a pesticide or an herbicide, or some other type of contaminant, on top of those two systems, that it would move really slowly through the sand grain aquifer. And some of it would stick to the sand grains and some of it would get filtered out. Whereas, in the karst aquifer, it would just be funneled, or focused, into those zones of what we call preferential flow, those pipes going through the rocks. So, in karst aquifers there's this very important interaction between what goes on at the surface and what goes on underground, because they're so closely connected. So, really anything that we use at the surface is going to find its way underground, and it's going to find its way underground quickly, and it's going to move through the underground very, very quickly to come out at springs. One category of contaminants are pesticides: insecticides, herbicides, things that we put on our landscaping and our gardens and on golf courses to try and control weeds and try and control pests. Well, those things are, by design, toxic. They're meant to kill things, so they are contaminants. And whenever it rains, they wash off the surface and they go into the groundwater system, and they can move very quickly, sometimes in a matter of hours, from the surface to come out at Barton Springs. Another category of contaminants that we're all familiar with are things like gasoline, gasoline spills and oil spills. Also, leaking from underground gasoline storage tanks. Those can enter karst aquifers very quickly and can cause contamination that can move through the system in pretty much the same concentrations that we find them at the surface, they could come out the springs. Yet a third kind of contaminant is sediment, and contaminants that are associated with sediments. So, there are some contaminants that tend to adhere to sediment. And if the sediment moves through the system, they'll bring those contaminants with them. The reason that you find them in karst is that the openings in the subsurface are large enough for contaminants on sediment to move through and for that sediment to not get filtered out. So, these are contaminants that sorb to solid phases, rather than being dissolved in water, and in karst systems, we can find those as well.
Flint Water Crisis
Flint Water Crisis
You can’t mention lead in groundwater without telling the terrible story of Flint, Michigan. Flint has had a rough economic time with General Motors pulling out of the city in the 1980s, and this is partially responsible for significant unemployment and high levels of poverty. The city is 57% African American. Minority communities have been subject to terrible inequity in terms of access to clean air and drinking water, and Flint is one of the most devastating cases of all.
The city used to derive its water supply from Lake Huron, as did the city of Detroit. This high-quality water was very expensive, and as the city was carrying great debt, back in Spring 2014 the state decided to switch the water management agency and at the same time to supply water to the city from the Flint River. Treating water from a river is far more difficult than treating water from a lake, and the processing facility wasn’t equipped to handle the poor quality of the river water. In particular, the water wasn’t treated with additives to lower its corrosiveness. Moreover, the water had very high levels of bacteria. So the end result was the water delivered to the citizens of Flint came out of the faucets dirty, smelling bad and tasting terrible. Even after citizens protested and showed jugs of this nasty water, officials told them the water was safe to drink. Turns out the water was so corrosive that it stripped lead from the antiquated pipe system of the city. In most cities, old pipes have been replaced, but that was not the case in Flint.
The high levels of the bacterial Legionella led to an outbreak of Legionnaires Disease. This waterborne disease causes a severe flu including respiratory, gastrointestinal and even neurological symptoms, and it can be fatal. In Flint, 12 people died and almost 90 became sick. There have been numerous investigations of the connections between Legionnaires and the Flint drinking water, and in all the most logical finding is that the high bacterial levels were a result of low chlorine in the water because it had reacted with the high lead and iron levels.
Video: Lead In The Water In Flint, Michigan (1:05)
Insert transcript here
But the lead is what is likely to cause the most permanent damage, 100,000 people were exposed to high lead levels including about 9,000 children who drank this dangerous water for up to 18 months. And it took the state 9 months to inform the citizens that they had discovered the lead. Children are more susceptible to long term impact of lead poisoning because their bodies are developing. Lead exposure can cause permanent brain damage, learning and development problems including lower IQ and speech and hearing issues lasting for a lifetime. Tests showed that lead levels had doubled or tripled in Flint children.
The city switched back to old water supply in October 2015, but that was not the end of the story. Lead was still in the water because of the damage to the pipes. The outrage from Flint citizens was a major reason for the state and federal response to the crisis. They joined with environmental and legal groups to petition the EPA to research the environmental impacts and to sue the city and state to provide safe drinking water. And they won. The judge mandated that thousands of lead pipes be replaced and bottled water be delivered to all citizens. Now several years later, the legal battles continue with criminal charges pending for numerous city and state leaders. Most of the active lead-bearing pipes have been replaced, but even now there is still widespread mistrust surrounding drinking the city water.
Saltwater Incursion
Saltwater Incursion
A serious problem can result from the overuse of groundwater in coastal regions. Here, there is the potential for salt water to flood into the void where aquifers are drained excessively. This process, which is termed saltwater incursion or saltwater intrusion, happens readily because salt water has a higher density than fresh water, hence the pressure under a column of seawater is greater than the pressure under an equivalent volume of fresh water. This results in flow into freshwater aquifers near the coast. Humans and other mammals cannot process large amounts of sodium in water. Ultimately, it leads to renal (kidney) failure. This is why early explorers who became lost at sea were told not to drink seawater. Likewise, salt water kills crops.
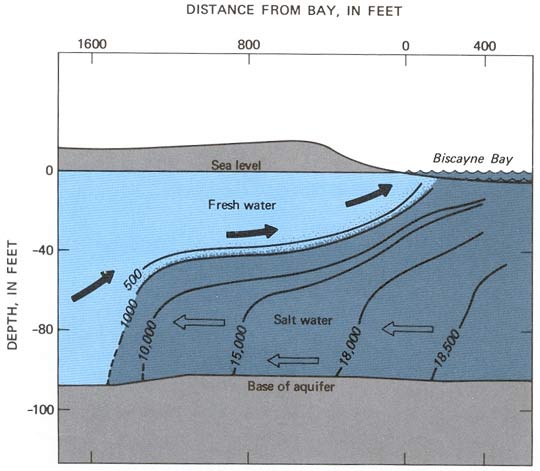
Saltwater incursion can occur in one of three ways, all as a result of over-pumping. The first is large-scale, lateral flow into the coastal aquifer, the second is vertical upward flow, and the third is flow into the aquifer from coastal streams and canals, often forced by tidal movements.
Probably the most well-studied example of saltwater intrusion occurs in south Florida, where development combined with highly irregular precipitation patterns have stressed local aquifers. The Biscayne aquifer is the main source of drinking water in the Miami metropolitan area. The aquifer is unconfined, meaning that it is not overlain by aquitards, i.e., it lies at the surface. This renders the Biscayne sensitive to changes in rainfall, evaporation, and over-pumping. Saltwater intrusion occurs as a wedge underneath the surface with a transitional interface with the overlying Biscayne aquifer.
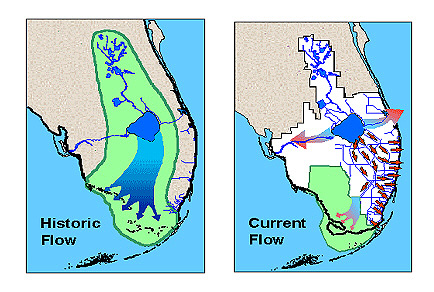
The history of incursion dates back to the 1900s as defined by the first measured increase in salinity (chloride levels) in the Biscayne aquifer. Construction of drainage canals began in 1909 and this resulted in the further inland intrusion of salt water. Intrusion continued unabated until 1946 when salinity-control structures were constructed to prevent inland, tidal movements of salt water. In the 1960s, a large drainage canal system was constructed as part of the massive development of south Florida.
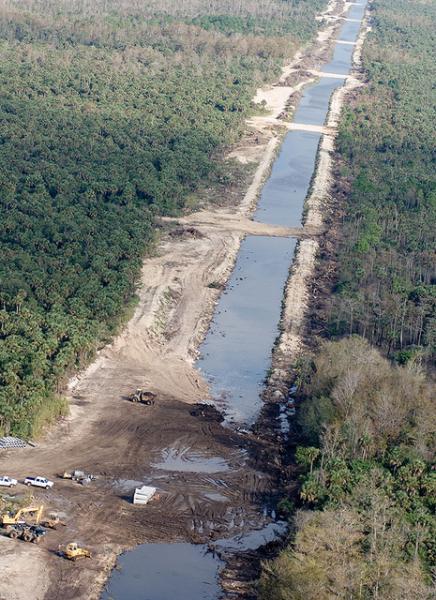
The canals included flow-control structures to prevent excessive drainage from the canal system. However, the design of the structures led to a lowering of freshwater levels in the Biscayne aquifer, leading in turn to increased saltwater intrusion, especially during drought years. Continued movement of the saltwater lens towards the coast and inland has occurred as the new parts of the aquifer have been developed and others tapped less intensively. As in other coastal regions, saltwater intrusion is an ongoing issue that will require constant monitoring as development continues, and demand on aquifers increases. The potential of saltwater intrusion is one issue behind the development of desalinization technology in arid regions.
Sea level rise will increase salinization of coastal aquifers, especially in areas that are dry or subject to seasonal rainfall variability.
Check Your Understanding
Climate Change Predictions
Climate Change Predictions
As we have seen, climate change will alter precipitation patterns on a global scale, leading to higher rainfall in some areas and significantly lower rainfall in others.
Superimposed on this will be changes in evaporation, runoff, and soil moisture, which will generally exacerbate droughts in areas where rainfall decreases. Generally speaking, regions that are already dry will not get wetter in the next century, and many will become significantly drier.
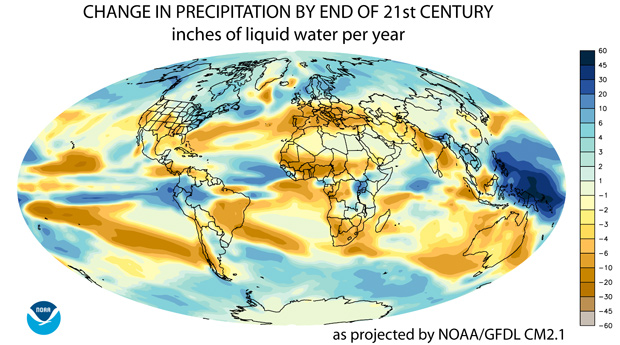
Regions that are already wet will often become much wetter in the future. Climate change will act in tandem with stressors on the water sector as a result of population increase. Therefore, climate change will generally render precipitation patterns more unequal than they are today. Further, as stated by the Intergovernmental Panel on Climate Change (IPCC),
The negative impacts of climate change on water resources….will outweigh the positive impacts in all regions of the world. Those places in which precipitation and runoff are projected to decline are likely to derive less overall benefit from freshwater resources. In those places that receive more annual runoff, the benefits of increased water flows are expected to be offset by the adverse effects that greater precipitation variability and changes in seasonal runoff have on water supply, water quality, and risk of flooding. (Intergovernmental Panel on Climate Change)
In more detail, recently observed trends of decreasing precipitation over latitudes 30°N to 10°S are projected to continue. Thus, arid and semi-arid regions in the south-central US, Southern Africa, and the Mediterranean are expected to experience decreasing water supply. In some of these regions, water availability is projected to decrease 10-30% by 2050. The IPCC estimates that two-thirds of the world population could be living underwater stress or water scarcity by 2025.
The areas that are expected to suffer some of the worst consequences of changing precipitation are generally some of the least developed and poorest nations, with some of the highest rates of population growth. This combination will likely lead to significantly reduced groundwater recharge, declining surface water reservoir levels, increase in the frequency of groundwater pollution, and most critically, to rapid declines in per capita water availability.
Increased precipitation intensity, more extreme events, increased runoff, decreased infiltration, increased likelihood of contamination with sewage, fertilizers and farm wastes, less ice and snow storage, and increased droughts even in areas that receive more precipitation all will place burdens on water supplies in the future.
Check Your Understanding
Drought and its Consequences
Drought and its Consequences
Drought could be one of the most serious consequences of climate change from a human and an economic perspective. On a global scale, droughts will likely lead to losses in revenue from agriculture on the scale of billions of dollars, and worse, force the migration of millions of people in arid regions of the world. Not every country can afford to engineer its way out of drought the way that Southern California has done for the last century.
As we have already seen, drought has plagued civilization for millennia and humans have learned to adapt to areas where water supplies are not plentiful or regular. However, the critical difference today is explosive population growth that is placing much more pressure on water supplies. Combined with projections that parts of the globe will become significantly drier in coming decades, drought will likely be much more of a serious issue in the future than it has in the past.
The following video provides an excellent summary of the global drought problem.
Video: Droughts 101 - National Geographic Society (2:58)
It's signs are subtle and slow. The earth dries. Water levels fall. The rains do not come. And the land is gripped by drought. At its most basic, a drought occurs when more water is used than is replenished. It is a balance between supply and demand, with both natural and human factors in play. The weather is constantly in flux. A low pressure system allows moist air to rise, cool, and form rain clouds. A high pressure system traps the air beneath it and banishes the clouds. Droughts form when changing wind patterns cause high pressure systems to last for months, or even years. Aggravating the problem is society's demand for water. Farms are heavily dependent on water to irrigate crops and provide pasture for livestock. Urban areas also place huge demands on available water supplies. If the demand can't be reduced, then the drought begins to take its toll. Crops eventually wither and die. Soil erodes away into clouds of dust. Forest fires spread rapidly. The damage to the environment has large-scale consequences for its human population. Short-term droughts cause stress on both the environment and people. Long-term droughts can lead to war, famine, disease, or mass migrations. In the 1930s, a severe drought in the Great Plains caused massive crop failures. In some places, the drought lasted eight years. So much soil blew away, it became known as the Dust Bowl. Over 50 million acres of land were affected, forcing many farmers to abandon their own property. But by historical standards, the Dust Bowl was mild and short-lived. Some droughts have lasted for decades. The famines they create have killed over 40 million people in the 20th century alone. Like other forms of weather, droughts are one of the Earth's natural processes. There is very little we can do to stop them. The best we can do is prepare for when droughts do come, before everything blows away.
Here, we provide two modern-day case studies of the impacts of drought on water supplies in Australia and China and how these countries are responding to them.
Australia: The Murray-Darling Basin
Australia: The Murray-Darling Basin
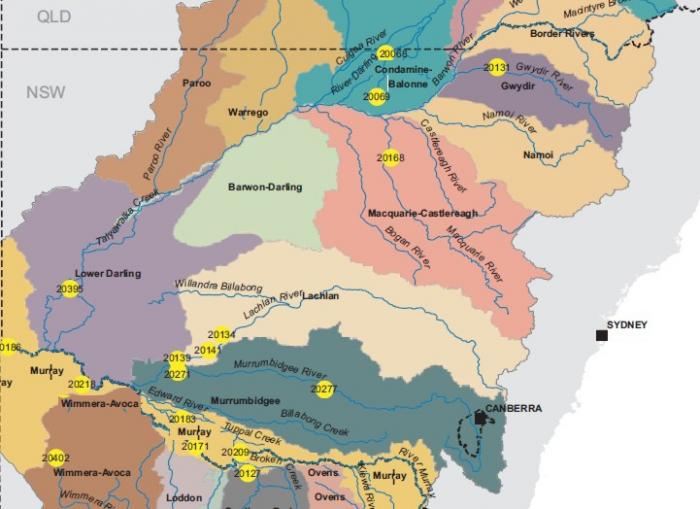
Until 2011, much of Australia was in a decade-long drought, providing a grim picture of what the future possibly holds for the driest continent. The Murray-Darling Basin is the most productive agricultural areas in the country, producing a third of Australia’s food. The basin covers over a million square kilometers, about one-seventh of the whole continent, and includes some 20 rivers, most notably the nominate rivers, the Murray and Darling. The region is generally dry (average precipitation is about 500 mm). The total flow of water carried by the Murray and Darling Basin Rivers is significant compared to other Australian rivers, but the amount is dwarfed by the flow of other river systems with equal drainage areas. Thus, the region is prone to drought, and there have been numerous times in the past when the Murray, and especially the Darling, have completely dried up. The Murray- Darling basin produces wool, cotton, wheat, sheep, cattle, dairy produce, rice, oil-seed, wine, fruit, and vegetables. And three-quarters of Australia's irrigated crops and pastures are grown in the basin. Thus, the rivers are vital to the Australian livelihood.
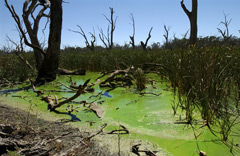
Drought in the Murray-Darling Basin
Between 2006 and 2009, precipitation in the mountains in the eastern part of the drainage area, which supplies nearly 40% of the water to the rivers, was lower than at any historical time. Other parts of the basin had a total rainfall deficit of about 1.5 meters below normal for the period 1996-2008. Overall, warmer temperatures that led to higher evaporation rates exacerbated the impact of the drought. For example, the 1oC warming in the basin area is roughly equivalent to a 10% increase in evaporation.
In recent decades, studies have repeatedly confirmed that the environmental health of the Murray-Darling Basin is in decline. On top of the drought, over-extraction of water as a result of past entitlement system has combined with high salinity levels and overall poor water quality, the growth of blue-green algae, declining wildlife, and land degradation to provide a dismal outlook for the basin.
To preserve the water resources of the Murray-Darling, the Australian government has developed a basin plan with a critical provision: an annual water usage (termed a level of take) from the Murray-Darling rivers of 10,873 gigaliters per year (GL/y) that is environmentally and ecologically sustainable for the long term. This take is a cut of about 2750 gigaliters over current levels and will be instituted over a seven-year period. The government is also setting aside some $6 billion to invest in infrastructure, including upgrades to irrigation systems. The plan, which became law in 2012, divides the basin into different surface water (i.e., rivers and lakes) and groundwater areas and sets goals for water usage by agriculture and communities in each of these areas.
Moreover, these districts will have the right to trade water with one another. Overall, the plan is one of the world’s most forward-thinking water use policies. However, it is turning out to be highly controversial. Environmentalists have charged that the plan is too little, too late, insufficient to ensure continued flow through the basin, and not enough to alter the high salt loads in river waters. Politically, there are also significant issues, with some areas targeted for much more drastic reductions in water use than others. However, the policy has the most serious implications for individuals, especially farmers in areas where the most stringent reductions are slated. Enforcement of the water restrictions will almost certainly cause many farmers to go out of business. You can Google “Murray Darling water” for the latest on how this policy plays out.
China: A National Water Emergency
China: A National Water Emergency
China faces some of the most serious water issues on the planet. The problems stem from explosive population growth and an inadequate water supply, which has pitted demand for clean drinking water against the demand for industry and agriculture. So in China, drought and pollution combine to make devastating water problems. To put the problem in context, the country has 20% of the world’s population with less than 8% of its water; in other words, the Chinese per-capita water supply is a quarter of the world average. Half of China’s large cities, including Beijing, face a water shortage.
Superimposed on the overall shortage is a significant disparity in supply with the northern tier of China being significantly more arid and the southern tier being significantly more moist. Just under 50 percent of the population of China lives in the northern tier, and close to 60 percent of cultivated land is also in this area, yet only 14 percent of the country's total water resources are found in the region. Production of grain has gradually shifted from the south of China to the north, exacerbating this problem. As a result, the water table is dropping by 1.5 meters per year in parts of the northern portion of the country.
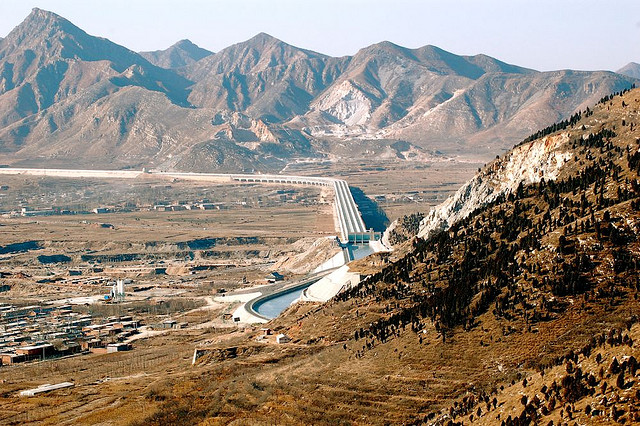
In all, explosive population growth and rapid industrialization have fueled the demand for water nationwide over the last sixty years with the construction of more than 86,000 reservoirs, drilling of more than four million wells, and development of 580,000 square kilometers of irrigated land that generates 70% of the country's total grain production. Generally, lax Chinese environmental controls have led to some of the worst water quality in the world with widespread pollution. Factories are very often situated on river banks for water supply, yet a shortage of water treatment plants results in about 80% of wastewater bring discharged untreated back into the same rivers it came from, and about 75% of rivers are polluted. Worse, approximately 90% of groundwater in urban areas is polluted. Unfortunately, farmers have no choice but to use contaminated water for their crops. And an estimated 700 million people drink contaminated water every day. In some parts of the country, high incidences of digestive cancers (stomach, esophagus, intestine) have been tied to water pollution.
Examples of Pollution in China
Video: China's 'cancer villages' reveals the dark side of economic boom (4:58)
Woman speaking Chinese (Translation): The doctor told me I have a disease. It's cancer.
Man speaking Chinese (translation): My father died from cancer in 1997. My aunt got cancer too, in 2009.
Another man speaking Chinese (translation): All kinds of diseases that did not exist in the past have started to appear.
Narrator: The village of Xinglong in Yunnan province is a rural idyll next to an industrial hell hole. Before the factories came, this was a healthy community. Now, everyone here knows someone who has died of cancer. Xiao Lian lost his aunt and father to the disease after the village streams change color.
Xiao Lian speaking Chinese (translation): When I was a child, we used to water our cows here. The stream used to be crystal clear, surrounded by trees and grass. Now, it is polluted. The water here is red. Our former spring is yellow, polluted by the chemical factory. Before the factories were built, there was no cancer. We were free of strange diseases. Now, we hear every year that this person or that person has cancer. Especially lung and liver cancer. My aunt never drank alcohol or smoked. Her cancer was completely caused by pollution.
Narrator: The government doesn't recognize the problem, nor do the factory owners. But the local doctor has no doubt that 3,000 residents are at risk.
Local doctor speaking Chinese (translated): In the past, cancer was not obvious...but in recent years, it has become a very evident problem. Last year alone, we had five cancer cases. Most cases are stomach or lung cancer. People tried to protest, but they were not allowed to do so. The chemical factories here are not state-owned...but they contribute a great deal to the local economy.
Toxins from the chemical and paper factories enter the food chain through water, cattle, and crops. The impact may well have spread beyond the village, but local farmers say they have no choice.
Local farmer speaking Chinese (translation): When the wind blows in this direction, a thick layer of soot settles on my peach trees. Lots of fruit turn black and fall to the ground. I dare not eat the rice I plant and harvest because the pollution is so bad. I sell it on the street.
Narrator: There is said to be more than 100 cancer villages in China. Jongu Mae has reason to fear her community has become another.
Jongu Mae speaking Chinese (translation): I have cancer, and I am now getting treatment. See? My hair has fallen out...The poison comes from chemical factories. the rice we eat and the water we drink are polluted. That caused my cancer...My brother-in-law has cancer like me. He is dead already. I want to tell the factories that they make too much pollution. Because of them, Xinglong village is sick.
Narrator: Today, it's a personal tragedy, but wider questions about the sickness villages like Xinglong will be asked for generations to come.
Mismanagement of water resources is commonplace. Diversion of rivers for industrial purposes and irrigation has caused water shortages in areas that once had a steady water supply. The Yellow River, once a sizeable waterway and source of water for agriculture, has been diverted for irrigation and dries up for increasing portions of the year, in 2010 for more than 200 days. As in many parts of the world, industrial demand for water has trumped demand for agriculture. Even when water remains for agriculture, a large amount is wasted through evaporation. The total lost from canals and irrigation systems is 60-80% of the supply.
The following video discusses the water pollution problem in China. Watch the first 10 minutes or so.
Video: China: Shifting Nature (59:03)
ALL: [SINGING IN CHINESE]
NARRATOR: China's people are paying the price for her rapid economic growth. The prosperity touches some. The pollution touches all.
SPEAKER 1: People welcome the factories. Because with factories moving in, we could earn some money and prosper.
WU DENGMING: [SPEAKING CHINESE]
INTERPRETER: But then once the factories were here, people realized, our water is being polluted. We can't drink it. Our soil has been polluted, and grain production has fallen. Our fruit trees have died of pollution. Our pigs have died. Our sheep have died. And our people have died, too-- died of cancer. Then they thought, we don't want the benefit like this, factories like these. At first, we wanted money. But now, we want quality of life.
[MUSIC PLAYING]
NARRATOR: Nature in China is becoming a battleground, contested by scientists, environmentalists, government, and ordinary people-- 1.3 billion of them-- whose water, air, and soil are at stake.
[MUSIC PLAYING]
PAN YUE: [SPEAKING CHINESE]
INTERPRETER: The environmental challenge isn't just to provide our children with future happiness, but the real question of whether our generation can survive intact.
NARRATOR: Development creates human as well as environmental cost. Giant construction projects involve resettling people in new cities, uprooting millions from land, job, and home. There are places in China which remind us what it must all have once been like when the rivers were at the center of daily life, when the water was clean enough to wash vegetables--
[MUSIC PLAYING]
--when the air was pure enough to dry meat safely, when taming nature meant using cormorants to catch fish.
[MUSIC PLAYING]
And the Chinese also have a long history of improving nature. Two and a half thousand years ago, they started building the Grand Canal, linking rivers and cities.
[MUSIC PLAYING]
By the 1950s, heavy industrialization was the priority.
MAO ZEDONG: [SPEAKING CHINESE]
NARRATOR: Chairman Mao Zedong urged the Chinese people to conquer nature, thereby freeing themselves from it. Half a century on, China opens a new coal power station every week of the year and emits more greenhouse gases than any country other than America.
LEI HENGSHUN: [SPEAKING CHINESE]
INTERPRETER: You can't solve the problem of poverty without economic development. But as you speed up economic development, you can't help but destroy the environment.
LEI HENGSHUN: [SPEAKING CHINESE]
INTERPRETER: To cultivate more land, you have to build roads, chop down forests. You have to do the same to build a factory. And with this kind of economic development, emissions of industrial waste and gases massively increase, as does human sewage with the rise in population density and living standards. And so, there's more and more pollution.
PAN YUE: [SPEAKING CHINESE]
INTERPRETER: Of the world's 10 most polluted cities, five, unfortunately, are in China. Such severe pollution is undoubtedly a grave threat to the physical health of the Chinese people.
NARRATOR: The Huai River flows for over 600 miles across the middle of China, providing water for 150 million people.
HUO DAISHAN: [SPEAKING CHINESE]
INTERPRETER: I was born on the banks of the Huai River. It was in 1987 that I grew worried about the problem of water pollution in the river. I'd gone back to take pictures of the scenery, but there no longer was any scenery. Instead, I found myself taking photos of people dredging up dead fish.
Huo Daishan gave up his job as a news photographer to save the Huai. Research took him to its main tributary, the Shaying. Nearly half a million tons of human sewage a day are tipped into it. There's a million tons of untreated wastewater from paper mills, tanneries, chemical works. Some used process is banned elsewhere. Their effluents include ammonia, cyanide, arsenic.
HUO DAISHAN: [SPEAKING CHINESE]
INTERPRETER: Water from this river has flowed through irrigation channels into villages and sunk into the ground. People who drank this polluted groundwater just became ill. The water of this river-- black and stinky water-- takes death with it wherever it flows.
It really is a river of death. Before, the local rate for cancer was 1 in 100,000. Now, in some villages, it's 1 in 100. Cancer doesn't differentiate between age or gender. This cancer sufferer is one-year-old.
A grandfather, grandmother, father, and mother have all died from tumors and cancers. She has cancer of the liver and has had an operation which left a deep scar. This woman had esophagus cancer and had an operation followed by chemotherapy. She lost all her hair. When I saw her, she was already beyond cure, was preparing for death, and had put on her burial clothes.
This is an esophagus cancer sufferer from Huangmengying Village. Her name was [? Jiang Weijia. ?] The cancer had blocked her whole gullet. Not even a drop of water could get through it. Shortly after I took this photo, she died.
WANG CANFA: [SPEAKING CHINESE]
INTERPRETER: It's widely reported that because of Huai River pollution, there are cancer villages. But if you sue through the courts, the requirements for evidence are very strict. If you don't have this evidence, you might lose the case.
And where the cause of illness is pollution, it's very difficult to gather evidence. So, say you've got a disease like stomach cancer or lung cancer and you say it's caused by polluted water. It's extremely difficult to prove the causal connection between the two.
NARRATOR: The scales are tipped firmly against the victims. To secure proof, they need independent forensic analysis.
WANG CANFA: [SPEAKING CHINESE]
INTERPRETER: I've been advocating the establishment of just such an organization to inspect and evaluate water, but there isn't one yet. There are two environmental medicine research institutes, but they don't normally carry out inspections for victims. They usually investigate cases handed them by the government, and they don't publish the results of their investigations.
NARRATOR: Vice Minister Pan Yue does not need convincing of the link between people's health and their environment.
PAN YUE: [SPEAKING CHINESE]
INTERPRETER: Two million of our people die from cancer every year. We don't have accurate figures. We haven't done the sums, but many cancer cases are related to environmental pollution.
NARRATOR: But a booming economy is one of China's priorities. And the environment administration has limited power to hinder that.
PAN YUE: [SPEAKING CHINESE]
INTERPRETER: Our environmental law has tens of sections. But it stipulates that we can only play a supervisory role and don't have the power to shut down polluting companies. It's surprising that in all these sections, we haven't been granted this authority.
We don't have the power. So what are we to do? The fines that can be imposed are tiny. The cost of observing the law is high, but it costs very little to break it. So, why would anyone listen to what we have to say and stop polluting? Of course, they won't.
NARRATOR: Another problem is the complex web of links between local industry and local government. These range from legitimate common interests like maintaining employment to out and out corruption. Some liberal governments even part own polluting factories. And treating waste eats into profits.
HUO DAISHAN: [SPEAKING CHINESE]
INTERPRETER: Local protectionism is everywhere. These big companies are pillars of the economy. They're powerful taxpayers. They play an important, supported role for local finance and development.
NARRATOR: Environmental campaigners like Huo Daishan operate in a gray area. Nationally, they could be taken as heroes, fighting for cleaner, safer China. But locally, they can seem more like troublemakers.
HUO DAISHAN: [SPEAKING CHINESE]
INTERPRETER: I've had anonymous, threatening phone calls, saying this isn't any of your business, so keep out of it. Don't stick your nose into matters that don't concern you. That's one thing, but it's not all. I've been beaten up.
NARRATOR: One result of local protectionism is that some officials tip off factory forces that inspectors are on the way. Then the factories hurriedly treat the waste, making the river flow clear for a while.
HUO DAISHAN: [SPEAKING CHINESE]
INTERPRETER: There's a folk song going around with the words, meeting clear water is the sign that soon it's official inspection time.
NARRATOR: China's official news agency Xinhua has said that around 50,000 people along the Shaying River have been found to have cancer-- As for Huangmengying, the original cancer village, local government was shamed by Huo Daishan and these photos into giving the villagers a deep well with safe water, but only after 118 of them had died.
HUO DAISHAN: [SPEAKING CHINESE]
INTERPRETER: The situation there is improving, but Huangmengying Village isn't a special case. It isn't a chance incident. These high cancer rates we're seeing-- these cancer villages are just the tip of the iceberg.
NARRATOR: The scale of the problem is daunting. Almost anywhere there are people, there's pollution. And pollution is easily spread. This river flows from Tibet into India and Bangladesh. A third of the world's population uses water from China. China's acid rain falls on Korea and Japan. Pollution from its factory chimneys lands in Canada. There's little incentive for individuals or industry to take responsibility for waste.
[BIRDS SQUAWKING]
[MUSIC PLAYING]
Here's a typical scenario-- a small factory on the edge of a village. Around the side-- an outflow for waste from the industrial process.
[MUSIC PLAYING]
This is then piped into an irrigation channel, which provides water for farmers' crops.
[MUSIC PLAYING]
This is called the Clear River, but it's being killed by the waste from a pulp factory.
[MUSIC PLAYING]
China grades water into five categories. Over half the country's major river systems are below level three and so are unfit for any human use. A third is so polluted, they don't even make level 5. One of the few lawyers in China who take on pollution cases is Wang Canfa.
[SPEAKING CHINESE]
He's won nearly 18 environmental cases securing restitution for victims. He helps draft environmental laws and trains judges, but it's hard getting justice in pollution cases.
WANG CANFA: [SPEAKING CHINESE]
INTERPRETER: According to our system, the courts are financed by local government. So if a court finds a local business in the wrong and orders it to cease production, the local government will stop receiving tax revenues. That's why there's often interference in court cases, so you can't get a fair judgment. If we had a lever for forcing local governments to see the protection of the environment as their responsibility, even their mission, then environmental protection would be improved.
NARRATOR: There's no consistent pattern. Some local governments resist environmental protection groups. Others encourage them. The Han River in Hubei Province runs through areas of heavy industrial pollution. But it has guardian angels, both in Communist Party offices and along its banks.
[SPEAKING CHINESE]
Yun Jianli leads the Green Han River Group on a campaign and field trip. Their members include teachers, engineers, policemen, and businessmen. Senior local party official Ma Li sees them as allies.
MA LI: [SPEAKING CHINESE]
INTERPRETER: The government has always supported these activities. We think that having such a beautiful mother river-- we should treasure it as we do our own eyes. We take pride in the fact that you can drink water straight from the middle reach of the Han River.
NARRATOR: One of the group's main tasks is getting local people to help look after the river.
SPEAKER 2: [SPEAKING CHINESE]
ALL: [SINGING IN CHINESE]
NARRATOR: The group is worried about heavy use of chemical fertilizers and pesticides, which run off the fields into the river. Yun Jianli preaches green values to a poultry farmer.
YUN JIANLI: [SPEAKING CHINESE]
NARRATOR: A mile downstream, another member of the group decides to taste the water. What gives the Green Han River Group the freedom to operate is the approval of local officials who put the environment ahead of local commercial interests.
MA LI: [SPEAKING CHINESE]
INTERPRETER: There's a fermented soya paste factory in the upper reach of the Han River. And the waste it produced heavily polluted the river. Around a thousand people worked in this factory, but we shut it down. We shut it down without any hesitation. And there have been many cases like this-- cement factories, paper factories. There's a lot list. Whether it's governmental organizations or NGOs, we pursue the same aim-- a better life, a better environment.
[MUSIC PLAYING]
NARRATOR: In the north of China, millions of people don't even have dirty water.
MA LI: [SPEAKING CHINESE]
INTERPRETER: It'd be OK if it rained. The trees would grow in the mountains. We'd have water to drink. The wheat would grow, so we'd have food to eat. The problem is, it doesn't rain.
NARRATOR: China is trying to feed 20% of the world's population on just 7% of the world's arable land. Over a quarter of China is sand. And an awful lot of that sand is in Ningxia, a partly Muslim region in Northern China.
[MUSIC PLAYING]
The terraced fields have been plowed, waiting for rain that doesn't come. This village is even called Crying Out for Water. The people of Ningxia are among the poorest in China. Some like Ma Li follow tradition by making their homes in caves.
MA LI: [SPEAKING CHINESE]
INTERPRETER: We have nothing. You see there's nothing here. We don't wash much. No water, no washing things. Water costs money. No money, no water.
NARRATOR: Ningxia's main source of water is the Yellow River. It's also been Ningxia's barrier against the Gobi Desert to the north. But people have chopped down the trees, which once lined and protected its banks. Forest has given way to sand, pushing up soot levels in the river. The Gobi Desert is now spreading into Ningxia. Some people have overplowed and overgrazed, turning grasslands to desert. Add climate change and the result is sandstorms, hunger, poverty, but not for all.
MA ZANLIN: [SPEAKING CHINESE]
INTERPRETER: [? Hongsapu ?] was virtually part of the Gobi Desert. It really was a desert with one sand dune after another. And now, it's being turned into an oasis.
NARRATOR: The Chinese have created fertile farmland in the desert at a cost of 200 million pounds.
[MUSIC PLAYING]
Pumping stations and canals bring precious water up from the Yellow River 20 miles away.
[MUSIC PLAYING]
150 square miles of desert is now producing crops.
[MUSIC PLAYING]
Millions of trees have been planted to strengthen embankments and act as windbreaks. And with the hydraulic engineering, there's social engineering. 400,000 people have been resettled here from the driest parts of Ningxia
MA ZANLIN: [SPEAKING CHINESE]
INTERPRETER: They see it as their right to survival and development. Our country, among others, now advocates human rights. But if people don't even have subsistence rights, how can you talk about their rights to development? So, as long as the state can afford it, we should try our best to move people up here from the south.
NARRATOR: The first house in this new village was built by Ma Yingzhong.
MA YINGZHONG: [SPEAKING CHINESE]
INTERPRETER: People are very happy to come here. It's not like we don't want to. Even if you didn't want to move, what could you do without rain? There was no way of surviving. The wind was slight yesterday and didn't blow away the sand. Big improvement. Wherever there's water, things are good. That's why we have a summer harvest on the land here.
NARRATOR: But they can't afford to move everyone. 1.7 million people will have to remain in the arid areas.
MA LI: [SPEAKING CHINESE]
INTERPRETER: I want to go. And I'd take mom, dad, and everyone with me. Who doesn't want to move? But we're not being moved. We have to stay here.
NARRATOR: Ma Zanlin isn't worried. He believes the pressures will ease on those left behind.
MA ZANLIN: [SPEAKING CHINESE]
INTERPRETER: Take one chopstick out of a bunch and you lose the rest. So, relocating one family helps three families.
NARRATOR: But the argument that there'll be more water to go round doesn't work where there isn't any water in the first place.
MA LI: [SPEAKING CHINESE]
INTERPRETER: The other day, I said to a government official if you won't move us, can you at least give us running water? Running water? he said. That would be a bit tricky. You see, we're too far and too high. They can't get the water up here.
NARRATOR: Drought in the Gobi Desert are creeping across Northern China. The Gobi is just 100 miles from the outskirts of Beijing. Leading hydraulic engineer Liu Zihui puts the problem in practical terms.
LIU ZIHUI: [SPEAKING CHINESE]
INTERPRETER: People from Northern China like eating dumplings-- Chinese dumplings. And when they finish the dumplings, they like drinking the broth. As there's a shortage of water in the region, you could eat as many dumplings as you want in a restaurant, but you won't get any more broth.
NARRATOR: Beijing's 10 million people rely for their water on Miyun Reservoir, 50 miles from the capital. But the level has dropped to a third of its capacity. The water's edge has receded so far that farmers now cultivate the land.
LIU ZIHUI: [SPEAKING CHINESE]
INTERPRETER: The mayor of Beijing would be very nervous if there weren't enough water in the reservoir. If the water supply stopped, it would be a disaster for Beijing. A crisis like that would affect the stability of people's lives, the stability of our society.
NARRATOR: 200 million people across the north of China face the real possibility that one day the water will run out. To head off this catastrophe, their leaders plan to spend 32 billion pounds, diverting water from the south of China to the north. Three new canals will be created, each hundreds of miles long. It's the biggest hydraulic project in the history of the world. Professor Liu is responsible for this-- the middle canal.
LIU ZIHUI: [SPEAKING CHINESE]
INTERPRETER: You could describe this project as extremely big. Its total length will be 900 miles. We're talking, in effect, about building a new river, a rather large man-made river, running from the south to the north.
NARRATOR: All three waterways involve mighty feats of engineering. At Danjiangkou Reservoir, they'll have to raise the height of the dam by 50 feet to increase water capacity. Here, Professor Liu's canal will burrow under the Yellow River itself.
The eastern line will commandeer the ancient Grand Canal, studding it with pumping stations, forcing the water uphill to Beijing. But the most challenging and uncertain route requires tunneling for 160 miles, through the mountains of the Tibetan Plateau. The whole project will take perhaps 50 years to complete.
LIU ZIHUI: [SPEAKING CHINESE]
INTERPRETER: I don't feel we are conquering nature. We think nature itself isn't very fair. God isn't fair. Why is that? He's given Southern China so much water, but given the North so little. It's good land. Nice, flat land up there, but it's got so little water. So, we say, as God isn't fair, we are trying to balance out God's unfairness.
NARRATOR: But there's no point in balancing it out with dirty water. The Grand Canal is so polluted that the northern city of Tianjin with low reserves and 10 million people is reluctant to accept water from it.
[MUSIC PLAYING]
And what effect will the South-North Diversion itself have on China's environment?
ZHANG JIYAO: [SPEAKING CHINESE]
INTERPRETER: We'll assess the ecological impact during the process of the project's implementation. That's precisely why we've divided the project into several stages. According to our current assessment, the South-North Water Diversion would not have much effect on China's ecology.
NARRATOR: But all that water going north has to come from somewhere. And the less water there is in a river, the higher the proportion of pollution. The river which is going to provide much of the water for the middle line is the Han River. So Yun Jianli and the Green Han River Group are out campaigning again to foresters at a riverside plantation.
YUN JIANLI: [SPEAKING CHINESE]
LEI HENGSHUN: [SPEAKING CHINESE]
INTERPRETER: We've been forced into the South-North Diversion because of China's particular situation. Of course, a lot of experts are against it. The most crucial thing is to guarantee the quality of water. If it's dirty water being diverted over thousands of miles, then the losses will outweigh the gains.
NARRATOR: The Han River flows into the Yangtze at Wuhan. This booming city has realized that water pollution now threatens its very character. But for once, rivers aren't the problem.
[MUSIC PLAYING]
A suction pipe blows a geyser of black mud into the sky.
[MUSIC PLAYING]
Dead fish pull up at the edge of water too dangerous to paddle it.
[MUSIC PLAYING]
A drain is backed up, sending raw sewage into another of the city's ornamental lakes. Wuhan was once famed for its hundred beautiful lakes. But as the city has grown, it's used them as dumps for industrial waste and raw sewage. Now, the people who go boating on Lotus Lake take not picnics, but funnels, filters, sample bottles. Professor Wu Zhenbin is an expert on water in the environment. He's running an experimental project over three years to try and clean up just six of Wuhan's lakes.
WU ZHENBIN: [SPEAKING CHINESE]
INTERPRETER: We're collecting samples to analyze the water quality and its biological composition. We collect samples four times a week. The water may look all right, but its quality is actually very poor. If you touch it, it's bad for you. And just standing near it, you can tell it stinks. So, it's no good for people's health. 30 years ago, people used to be able to swim in water. Not anymore. But we really want to use the lakes.
NARRATOR: The cleanup has already begun using natural methods. Water is pumped up from the lake and pass through rows of plants, which absorb and break down pollutants. It then seeps through a bed of earth, which acts as a second filter.
WU ZHENBIN: [SPEAKING CHINESE]
INTERPRETER: Having gone through two levels of treatment in this experimental system, the water comes out over there, having been nicely purified. That's how the water in this small lake is being improved.
NARRATOR: Professor Wu plans to reopen connections between the lakes and flush them through with water, drawn from the Han River by this new channel. Cities around China are watching to see if his solutions will work for them.
WU ZHENBIN: [SPEAKING CHINESE]
INTERPRETER: It looks like what we're doing is changing things. Actually, what we're doing is recovering things. We're trying our best to get everything back to its original state. Our work benefits the environment as well as the quality of people's lives. That's how I see it. We don't think we're changing nature. We're trying to get back closer to nature, to how things used to be.
NARRATOR: He has more than the water to clean up. The toxic mud which forms the lake beds must be dredged out completely. It'll take 10 years to get to the lakes up to level 4, which is still unfit for any human use. Some of the rarest mammals on the planet live in the Wuhan area. Here, too, scientists are working to recover a desperate situation.
WANG DING: [SPEAKING CHINESE]
INTERPRETER: The porpoises living in the Yangtze River are the only freshwater porpoises in the world. You can't find them anywhere else. And they're different from the ones living in the sea. That's why they are unique. They're very special.
NARRATOR: The porpoises are rarer than pandas. And the pandas' environment can be protected, whereas the porpoises have to take their chances in the busy waters of the Yangtze. Pollution is only part of their problem. The South-North Water Diversion will reduce levels of the Yangtze, increasing underwater noise from ships' engines and propellers.
WANG DING: [SPEAKING CHINESE]
INTERPRETER: The porpoises use the sonar system and echolocation to survive and communicate, but the noises greatly disrupt their sonar system. Sometimes, especially during the low-water season along the narrow channels, we find them killed by propellers.
NARRATOR: This female porpoise is pregnant. Professor Wang will release her and her young with the others into a protected backwater of the Yangtze.
WANG DING: [SPEAKING CHINESE]
INTERPRETER: China is the most populous country in the world. Given this competition for resources is inevitable between man and animals as well as other living beings. Humans are always on top. But as they develop, they mustn't damage the environment too much. Because in the end, humanity as a whole will have to face the consequences.
[MUSIC PLAYING]
NARRATOR: According to official Chinese figures, 160 million people in China's cities breathe air considered very dangerous to health.
[MUSIC PLAYING]
400,000 of them die prematurely from air pollution every year, mostly from lung and heart-related diseases.
[MUSIC PLAYING]
Environmental activist Dai Qing puts herself into the mind of a corrupt official who protects polluters, rather than their victims.
DAI QING: [SPEAKING CHINESE]
INTERPRETER: Whatever I can grab, I grab and the rest. Whether others live or die, the environment, air quality-- I don't care. If there's money, I'll take it. And then when the country has got no clean water or air, so I'll emigrate-- sneak my money away and live a quiet life. But what if everyone in China did this?
WANG CANFA: [SPEAKING CHINESE]
INTERPRETER: Environment protection departments should emphasize law enforcement. And they can't just rely on one or two operations here and there to deal with companies that break the law, but should enforce the law on a daily basis. They must build strong mechanisms to enforce environmental laws. They've got to be ready at anytime to arrest those who don't abide by environmental laws and punish them.
NARRATOR: Chongqing on the Yangtze River is Western China's industrial powerhouse.
[HONKING]
WU DENGMING: [SPEAKING CHINESE]
INTERPRETER: The main pollutant being pumped out is sulfur dioxide. This comes from Chongqing's high-sulfur coal. The coal used in our power stations hasn't had the sulfur taken out. Now, the state is gradually introducing requirements for sulfur removal. But in order to cut costs, the power stations just emit the sulfur dioxide anyway.
NARRATOR: The mountainous cost of cleaning up all this environmental damage would effectively cancel out China's remarkable growth rate of around 8% a year.
PAN YUE: [SPEAKING CHINESE]
INTERPRETER: I think it's reasonable to say that the loss to our economy caused by the environment is 15% of our GDP. I want all Chinese officials to understand the linkage between the economy and protecting the environment. Economic growth alone can't solve the increasingly serious problems of overpopulation, shortage of resources, and environmental pollution.
NARRATOR: Human costs in China are not just about pollution, as the Three Gorges Dam shows. Its purpose is to generate electricity and control flooding on the Yangtze River. But there have long been serious concerns about its environmental impact and the plight of the one million people forced to relocate.
At the National People's Congress in 1992, two delegates protested, as only supporters of the dam we're allowed to speak. With a third of the delegates abstaining or voting against the project, Professor Lei and others pushed through a key amendment, giving them the right to monitor the project and highlight problems.
LEI HENGSHUN: [SPEAKING CHINESE]
I think this was an historic achievement. It provided the legal basis for people like me to carry out research in this area. Through this resolution, the state acknowledged that any problems discovered should be further investigated and solved accordingly. So, after taking part in the 1992 National People's Congress, I turned the focus of my scientific research towards the Three Gorges Dam Reservoir area.
NARRATOR: Almost every year since then, Professor Lei has made field trips into the area of the dam.
LEI HENGSHUN [SPEAKING CHINESE]
INTERPRETER: I'm an academic. I can't just trot out what other people say. I have to do research in person.
NARRATOR: First stop is a tree-planting scheme about 50 miles upstream of the dam. But even though the professor has won the right to ask straight questions about progress on the dam, he has no guarantee of straight answers.
LEI HENGSHUN: [SPEAKING CHINESE]
NARRATOR: Professor Lei strikes out on his own to talk directly to the tree planters.
LEI HENGSHUN: [SPEAKING CHINESE]
NARRATOR: The reason he's so interested in the tree planting is because after the valley is flooded, it'll be the trees that'll help stabilize the upper slopes.
LEI HENGSHUN: [SPEAKING CHINESE]
NARRATOR: No sooner does the professor join the tree planters, then he is joined by another official.
SPEAKER 3: [SPEAKING CHINESE]
NARRATOR: She, too, it turns out is from the Propaganda Department.
LEI HENGSHUN: [SPEAKING CHINESE]
SPEAKER 3: [SPEAKING CHINESE]
LEI HENGSHUN: [SPEAKING CHINESE]
SPEAKER 3: [SPEAKING CHINESE]
LEI HENGSHUN: [SPEAKING CHINESE]
NARRATOR: The professor finally gets the answer he wants from the tree planters themselves.
LEI HENGSHUN: [SPEAKING CHINESE]
NARRATOR: It's clearly the business of the Propaganda officials to paint as positive a picture of the dam as possible. But even they can't conceal what it'll do to this valley.
LEI HENGSHUN: [SPEAKING CHINESE]
NARRATOR: As well as the world famous gorges, whole cities, towns, villages, and fertile farmland will be submerged for 400 miles. And how clean will all this water be? Xiong Tongfu, local director of Propaganda, is adamant.
XIONG TONGFU: [SPEAKING CHINESE]
NARRATOR: The Xinhua news agency admits that the city of Chongqing alone tips over a billion tons of untreated waste into the Yangtze every year.
DAI QING: [SPEAKING CHINESE]
INTERPRETER: In the area of the dam, I've not only seen rubbish like polystyrene boxes and plastic bags bobbing about, but also excrement, human excrement. I've seen a dead body floating past. I've seen all these things.
NARRATOR: Professor Lei now visits Yunyang, a new town being built for over 100,000 people, whose homes are to be flooded by the Three Gorges Dam. Here, the propaganda officials agreed to stand back and let the locals talk freely. As in Ningxia, if your previous life was harsh, you welcome resettlement.
SPEAKER 4: [SPEAKING CHINESE]
INTERPRETER: If we hadn't been moved because of the dam, we'd still be in our old town where things were a lot worse. We're quite happy now.
SPEAKER 5: [SPEAKING CHINESE]
INTERPRETER: Since moving here, our living conditions have got a lot better.
SPEAKER 6: [SPEAKING CHINESE] It's like heaven.
[LAUGHTER]
SPEAKER 5: [SPEAKING CHINESE]
INTERPRETER: We never thought we'd be able to move to a house like this. It's been good for us.
NARRATOR: But 11 cities are being submerged. People have lost jobs as well as homes. Many farmers are being moved off land they've worked for generations. Modest compensation payments are soon spent. And what's a farmer to do in a block of flats?
LEI HENGSHUN: [SPEAKING CHINESE]
INTERPRETER: It's not enough for a person just to have a house to live in. How can they make a living? No job, no income. The housing is great. For peasants, they're mansions, but there's no safety net. They're slipping into poverty. People say they're beggars, beggars living in mansions. That's what ordinary people say. It's a vivid image. And it lays bare the nature of the problem.
NARRATOR: It's a long day for Professor Lei, but he's still curious to learn more about life after resettlement. He comes upon a group of people with new homes in Yunyang, but no jobs.
LEI HENGSHUN: [SPEAKING CHINESE]
NARRATOR: They become increasingly relieved that someone is interested in their problems.
LEI HENGSHUN: [SPEAKING CHINESE]
SPEAKER 7: [SPEAKING CHINESE]
LEI HENGSHUN: [SPEAKING CHINESE]
SPEAKER 7: [SPEAKING CHINESE]
LEI HENGSHUN: [SPEAKING CHINESE]
SPEAKER 7: [SPEAKING CHINESE]
[LAUGHTER]
LEI HENGSHUN: [SPEAKING CHINESE]
SPEAKER 7: [SPEAKING CHINESE]
LEI HENGSHUN: [SPEAKING CHINESE]
SPEAKER 7: [SPEAKING CHINESE]
SPEAKER 8: [SPEAKING CHINESE]
SPEAKER 9: [SPEAKING CHINESE]
NARRATOR: Finally, the professor is taken aside by a man who hints at even darker local problems.
SPEAKER 10: [SPEAKING CHINESE]
LEI HENGSHUN: [SPEAKING CHINESE]
INTERPRETER: In my opinion, because of China's particular situation, there are things being done today which aren't ideal, but get done anyway.
[LAUGHTER]
That's my personal opinion, not necessarily ideal, but they still have to be done. Why? Because the problems of survival and development of China's billion-odd people have become a real headache. Firstly, we don't have enough economic power.
Secondly, our science and technology aren't very advanced. Also, most of our people are not very sophisticated. Given these circumstances, which can't be altered in the short term, all we can do is to balance advantages and disadvantages.
As long as the disadvantages don't outweigh the advantages, we can do it, but it might not be the best plan. I think it's a choice borne of helplessness.
NARRATOR: The South-North Water Diversion scheme will dwarf the Three Gorges Dam. And its advantages won't be felt for decades and won't ever be felt by those who have to make sacrifices for it. Because raising the height of Danjiangkou Dam will raise the water level of the reservoir and the rivers feeding it. People living along hundreds of miles of fertile banks will have to move out.
LIU ZIHUI [SPEAKING CHINESE]
INTERPRETER: Our government is relocating 300,000 people in order to maintain long-term security and stable lives for 200 to 300 million people. So, the advantages from water diversion outweigh the disadvantages of relocating people. Our bottom line is to make sure that living standards after resettlement will be noticeably improved.
[MUSIC PLAYING]
NARRATOR: Fu Anyin and his wife Ai Wanying have lived, farmed, and raised their family on the upper Han River for over 30 years.
[MUSIC PLAYING]
On the hill opposite is Long Bi tower, an ancient shrine said to protect the area from flooding. But it's no match for the South-North Water Diversion.
AI WANYING: [SPEAKING CHINESE]
INTERPRETER: It's policy from the top.
[COW MOOING]
If the authorities tell you to go, you have to go. You can't stay. The people in Beijing will be drinking this water. In 2008, the water will go there. We all know that. In 2007, we all leave.
FU ANYIN: [SPEAKING CHINESE]
INTERPRETER: People who've been here a long time believe it's better for a village to be poor than uprooted. The people our age are more understanding. I'll move if the party asks us to, for the sake of the country's construction. Individuals can't stand in the way. It's for the good of the majority.
AI WANYING: [SPEAKING CHINESE]
INTERPRETER: It's easy fishing here.
FU ANYIN: [SPEAKING CHINESE]
INTERPRETER: The fish here taste good-- the shallow water fish.
AI WANYING: [SPEAKING CHINESE]
INTERPRETER: We don't want to leave here. Our lives are all right. We earn enough to eat and get by. If we move, we are too old to start again.
[COW MOOING]
All we can hope for is to be moved to a good place. If the new place isn't as good as here, we don't want to move. We have orange trees. We grow them to sell.
[ROOSTER CROWING]
The oranges are this big. If you come up to my home, I'll give you some to taste. There are some at home. Come and try them.
[MUSIC PLAYING
Next on China, how free are the Chinese to worship as they please, to read the truth in newspapers, to speak their minds? What are the limits of freedom and the threat to stability
And that's next Tuesday at 9:00. The newshounds face the writers. Next-- tonight on BBC, tune in to University Challenge Special. And on BBC Four, an extraordinary account of a deeply traumatic childhood, a unique and moving film: Tarnation
[MUSIC PLAYING]
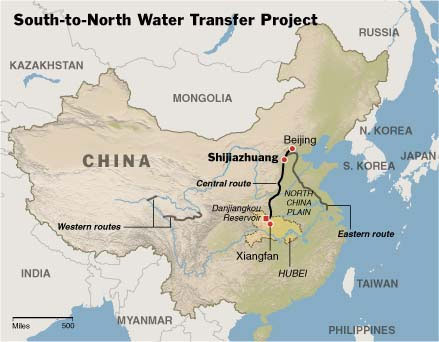
Water shortage presents a major obstacle to growth in China, moreover, pollution is a potential environmental catastrophe. To increase the supply of water to areas in the north of the country, China has developed one of the largest public works projects in the world, the South-North Water Diversion Project. This program is designed to divert water from the Yangtze River in the middle of China to rivers in the northern part of the country. Three major routes are being considered for this project, each consisting of tunnels, canals, and dams. However, the project is extremely expensive and its success is not completely ensured, thus plans remain in limbo. In the meantime, the Chinese government pledged $600 million in 2009 to improve water management and combat contamination problems.
You are certain to hear a lot more in the future about continued attempts to provide safe water for the Chinese population and agriculture, especially in the light of climate change.
Check Your Understanding
Management in the Future
Management in the Future
In areas that are forced to deal with more regular droughts and less regular rainfall, a number of management strategies will become increasingly vital over the coming decades. In rural areas especially in underdeveloped countries, potential strategies include techniques already being piloted in many places including rainwater storage, household treatment using filters, planting of drought-tolerant crops, and drilling of shallow boreholes or tube wells. As we have already seen, poor and disadvantaged populations in developing nations will bear the brunt of adverse effects of climate change. Yet these nations also have less potential to adapt as a result of limited resources. Thus, developed nations will be under great pressure to help their developing counterparts. Adaptation will be the most difficult for sub-Saharan Africa.
In more developed countries, management strategies include conservation, groundwater recharge, storm-water control and capture, preparation for extreme weather events, diversification of the water supply, and resilience to changes in water quality.
Resource Management
The following video is a great summary of our current water situation and what you can do to help out:
Video: Virtual Water and Sustainability (12:41)
PRESENTER: Water. H2O. Dihydrogen monoxide. It's the stuff of life. You may not feel it, but we're in the midst of a water crisis. Really, an impending doom for humans worldwide if we don't do something about it soon. In this video, we're going to talk a little about the problem surrounding water supply today, some new ways to view your water consumption, and how you can contribute towards a sustainable solution to the current water crisis. What better way than to jump right in.
So, where is all this water? 97.5% is in the oceans, and the rest of the 2.5% is limited fresh water. Of that fresh water, 70% is locked in the ice caps and snow cover in mountains. About 30% is in groundwater, and just 0.3% is fresh water found in lakes and rivers. Very little is available to us. Of the water that the world uses, about 70% is used for irrigation and agriculture, about 22% for industrial use, and about 8% for domestic use.
Rivers don't just transport water, they provide a habitat for plants and animals. And very importantly, they carry silt and nutrients that are vital to the natural process of carrying water from the headlands down to the ocean. They shape and create the land around them, and provide productive wetlands and floodplains where many millions of people farm.
Unfortunately, humans have changed these natural processes. We build dams, dump pollutants into waterways, and divert flows to irrigate for crops and provide water for cities. These actions cause serious change in local, regional, and even worldwide environments. Let's start with an example close by in the US, the Colorado River. The Colorado River is 1,450 miles long, bringing water to cities and croplands and generating hydroelectricity for seven states.
Virtually all of its water is used up for these purposes before reaching the ocean. All that water is carefully regulated, legally doled out state by state. However, the total water flow has been diminishing due to drought. Dam reservoirs simply hold less water than was expected when they were built. There is serious worry that there isn't enough water for all the people and cities that depend on the Colorado River.
Here's another problem, salt is building up. Normal river flow brings salt wash down from the mountains and irrigated lands all the way to the ocean. But now, none of it gets that far. Remember how almost none of the water makes it to the ocean? It's all used up. Greater evaporation at wide irrigated croplands and vast reservoirs where water is spread out at the surface causes the concentration of salt to increase. Increasing levels of salt water poison more and more fields of crops.
Here's an example you may have heard about. The Ogallala Aquifer, also known as the High Plains Aquifer, is a shallow, underground storage of water that stretches across portions of eight states in the Great Plains of the US. The Ogallala provides irrigation water for about 30% of the nation's crops. The problem is that this aquifer gets recharged, or rather, water is added, at a very slow rate that takes years and years to come back. We are literally drying up all that water, and we'll virtually never see it again.
All around the world, water projects are undertaken to provide water to people and to produce the products we consume, but the side effects are catching up. Rotting vegetation in an artificially flooded reservoir to generate hydroelectricity in the Amazon rainforest actually pollutes more through methane emissions than it would through an equivalent fossil fuel run power plant.
Remember how rivers naturally carry silt? Well, sediments are piling up in reservoirs, especially in China, but also elsewhere in the world, effectively rendering dams useless without an easy fix. In many efforts to control water and provide for growing populations, dams are constructed on major rivers. Over time, many dams across China, India, and the rest of the world have failed, spilling over with water, or bursting open with the fury of an entire reservoir of contained water. These are the dams that claim to provide stable flood control and bring peace through irrigation and hydroelectricity. But more often than not, they are met with failure.
Even if there is access to water, it doesn't necessarily mean it's safe. In developing countries, about 80% of illnesses are linked to poor water and sanitation conditions. More than one in six people worldwide don't have access to the recommended level of safe fresh water for daily use. As you can see, the water crisis is a real deal. All over the world, humans draw upon and exploit natural resources of water in order to feed, clothe, and provide for a growing population. This exploitation may have provided in the past, but the problems surrounding dams and other water control technologies are unnatural and are just setting us up for major failure.
So let's pull things in a little closer and talk about the water you and I use. Of course, we encounter water each and every day. We drink it, shower, wash our hands, flush the toilet, jump in puddles, et cetera. This is the water we see directly. What you might not consider, or have never thought about, is the concept of virtual water. This is the term for the water that is involved in the growing and manufacture of products traded all around the world.
A lot of water is used and polluted from the manufacturing of goods, like T-shirts, cars, plastics, and electronics. It also takes a lot of water to grow corn, wheat, rice, vegetables, and fruits. For instance, water is used in immense amounts, not only to water the plants, but also in the process of creating artificial fertilizers that we depend upon to grow our food.
Then there's the water used up in finding, collecting, and processing the fossil fuels used to make these fertilizers and run farm equipment. We use up water to create this artificial energy, which is then used to grow food energy. In the end, it's a large waste of water in order to grow the amount of crops for the population. It takes even more water to grow crops to feed and care for livestock like cows, pigs, and chickens, who eat those crops for you.
We could go on and on about the water used to grow the cotton in that T-shirt you might be wearing, the water used to mine the metal and process it into your car, the water used to get the coal to burn and generate electricity. But in the end, water is everything, and our decisions as consumers dictate water use around the world. The products that we buy influence water in geographically diverse areas.
That Egyptian scarf that you bought consumed water from the driest areas of Egypt, depriving local people of fresh water because of pollution from textile mills. Food, or other products, imported from around the world influence those local people. In the end, it is not OK to forget about virtual water consumption in Massachusetts just because we live in a wet climate. The products you consume have effects on water systems around the entire globe.
Let's look at a typical day. Maybe you spend about 15 minutes in the shower and use 22 gallons of water. Then you brush your teeth, shave, wash your face, whatever else, while the faucet runs, maybe another gallon or two. Over the course of the day, you use six gallons of water by flushing the toilet. Then the dishwasher uses 10 gallons of water.
We'll cut it off there, but that's already over 40 gallons. The average American uses 100 gallons of water a day directly. The amount of water that you use indirectly is staggeringly greater, but you can radically change that total by being mindful of the types of things you consume.
Let's compare some products and the differences virtual water behind them. One pound of beef takes 1,799 gallons of water to produce. Compare that to one pound of pork, which takes 576 gallons, one pound of chicken, which takes 408 gallons, and 1 pound of goat at 127 gallons. Take a look at some other product comparisons.
Some of the biggest decisions you can make to influence your consumption of virtual water is to watch what you consume. Just think about. Think about what you buy. Though you wouldn't immediately think so, everything costs water in some way. If we buy less, there's more money saved and less of a water footprint. Think about what you eat. Try to eat less meat, especially beef and pork. Choose vegetable and grain options that are both healthier for you and reduce your consumption of virtual water.
You can try once a week Meatless Mondays, or even try cutting it out altogether. After you reduce your consumption of stuff and reuse what you can, think about recycling. All products and packaging use water to produce, so recycling can be important in reducing water used to make new goods. A lot of virtual water is consumed when processing and exporting waste materials that are shipped to other countries or put in local landfills, so it's really important to reduce, reuse, and recycle,
Now, don't get the idea that saving water only matters in considering what you eat and what you consume. Your every day and weekly routines matter, too. While we've talked a lot about virtual water affecting the globe through consumption, there is also direct water use from the faucet. This affects your local and regional water that might just be down the street or across town.
Use only full loads of clothes in your washing machine with cold water. Use the dishwasher only when it's full. Pay attention to how long you leave the water on when brushing your teeth or when taking a shower. We use a lot of precious drinking water in all of these situations and it's something we can't afford to waste.
Just think. You're not only saving the water used, but also the fossil fuels used to heat the water and the sewage system that has to manage the water afterwards. Drink tap water and don't buy bottles. Plastic waste alone is enough of a worry, but it also wastes a lot in burning fossil fuels to make the plastic to transport the bottles and to keep them cold, not to mention that bottles of water are expensive. You're paying 2,900 times the cost of tap water.
Educate yourself. Think about where your drinking water comes from. If you're a student at UMass Amherst, your water comes from the Atkins Reservoir, as well as the ground water pumps in the swampy region of South Amherst. Go visit and see what your water source looks like. You'll make a connection with where your water is coming from, see that it's limited, and begin to care about how you treat it.
Now you've learned how humans are impacting water around the world and using it up in unsustainable ways. You have the power, as a consumer, to make decisions to limit your consumption of direct water and virtual water, as we strive forward for a sustainable water future. Interested in learning more about the water crisis, virtual water, and what you can do? Check out these websites.
It is likely that many or all of these strategies will be required for populations to adapt to declining water resources. One technology, desalinization, has great potential to provide large quantities of water in arid regions, especially those along coastlines.
Desalinization
Desalinization
Introduction
My one experience with boogie boarding in Hawaii was a disaster. I got caught in no man's land with 15 feet waves breaking on me and my board around my ankles. It took me five minutes to escape to shore, by which time I had consumed a lot of seawater. I had to take a night flight back to the mainland and all I can say was it was not fun! The largest body of water on Earth is the ocean. Desalinization, the removal of salt from seawater, offers great promise to supply citizens in arid regions in the future to come. Here we explore the technology and potential of this technique.
Water desalinization (often termed desalination) has enormous potential for supplying clean water for drinking as well as for irrigation, especially in regions that are arid or have irregular precipitation and are near the ocean. Desalinization is carried out in a number of ways. The most productive method in terms of the amount of water produced is multi-stage flash distillation (MSFD), which produces over 80% of the global volume of desalinized water today. MSFD is carried out in a plant divided into different units, each with a heat exchanger and a collector for the condensate.
Examples of Desalinization
The units or reservoirs are maintained at different temperatures, and critically, also at different pressures. The pressure of each reservoir is determined by the boiling point of water at the temperature of the reservoir (lower temperatures require higher pressure for boiling). A brine-heating unit is positioned near the highest-temperature reservoir. Seawater coming into the plant is pumped from the coldest reservoir towards the hottest reservoir and is gradually heated by water traveling the other side of heat exchangers. When the water is pumped into the brine heater it is heated further, then it is cycled back progressively through the lower temperature stages, returning on the other side of the heat exchangers that warmed it on its entry to the plant. In each of these stages, the water is above the boiling point and is warmer than the water on the other side of the heat exchanger. This water then begins to condense leaving desalinized water and brine, which settles in the reservoir. The key aspect of the technique is that it is extremely energy efficient, as water provides much of the heat to itself. However, there are issues in that the water produced still can have impurities if there isn’t significant treatment before entry into the plant. In addition, the technique leaves a large about of brine that needs to be disposed of (this waste is usually disposed of in the ocean).
There are other desalinization processes that also use distillation for the removal of salt and other chemicals. However, the main alternatives to MSFP are those that use reverse osmosis (RO). RO is the most common process used in desalinization, even though RO desalinization plants currently produce about 15% of desalinated water by volume.
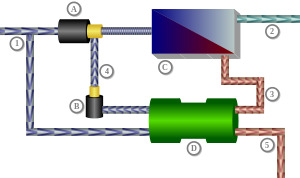
- Sea water inflow
- Fresh water flow (40%),
- Concentrate flow (60%),
- Sea water flow (60%),
- Concentrate (drain),
- Pump flow (40%),
- Circulation pump,
- Osmosis unit with membrane,
- Pressure exchanger
Like MSFD, RO requires significant pretreatment to remove solids and bacteria, and to adjust the pH and chemistry so that products such as calcium carbonate and metal colloids do not form. This is critical in the case of seawater, which contains high amounts of turbidity, and organic materials that can clog RO membranes. RO takes place when water is exposed to pressure as it passes through a membrane. As its name implies, the process is the reverse of osmosis, which is the process whereby solutions separated by a barrier such as a membrane flow from the side with low concentration to that with high concentration. When pressure is applied to the membrane in excess of the osmotic pressure, the fluid will flow from the side with the high concentration to that with the low concentration. In so doing, solutes remain on the membrane and the fluid flows from one side to the other. In RO plants, water passes through a number of membranes before it is pure enough for drinking.
The key factor besides purity in the viability of desalinization to produce large quantities of drinking water and water for irrigation is cost, usually referred to as the cost per volume of drinking water produced. The most significant cost is the construction of the plant, but once developed, the key expense involved in desalinization is that of energy. The increasing price of energy could limit the viability of desalinization in many places.
Desalinization is critical to growth and sustainability in countries in the Middle East, and much of the technology was developed here. Today, Saudi Arabia is the largest producer of desalinized water, followed by the United States. In the US, desalinization plants are focused in California and Florida. Countries such as Australia, with extensive arid regions and highly irregular precipitation, are gearing up to increase the amount of water produced by desalinization. For example, in Australia, investment in desalinization will involve a tripling of the number of plants between 2004 and 2013.
Desalinization technologies have applications beyond seawater. For example, desalinization is applied to treat groundwater in inland areas that are too salty for drinking or for irrigation, for example in the El Paso region of Texas. Desalinization can also be used to treat effluent from sewage treatment plants.
In summary, the future of desalinization is very promising, and this technology will likely play an increasing role in countries that can afford to develop it.
Check Your Understanding
The Growing Battle Over Water
The Growing Battle Over Water
Even in regions where desalinization has the potential to add water and strict management practices are underway, water is such a vital commodity that water rights of communities, cities, and even states are often contested in court. Such legal battles sometimes stem from old agreements about the distribution of rivers and groundwater between municipalities that were drawn up before substantial growth occurred. With population growth requiring water for drinking, domestic use, agriculture, and industry, the value of water has increased substantially, and old agreements are often extremely prohibitive to growth. Some of the most bitter water disputes occur in the western US, where, as we have seen, southern California relies heavily on water derived via aqueducts from the Colorado River to the east and the Owens Valley in the Sierra Nevada Mountains to the north.
California Aqueducts
Owens Valley
The City of Los Angeles has had brutal showdowns with farmers and environmentalists in the Owens Valley, from where it derives about half of its water. The city built the first of two aqueducts from the valley between 1908 and 1913 and the second in 1970. These aqueducts substantially lowered water levels in Mono and Owens Lake and the Owens River and took a terrible toll on farming in the Owens Valley. The impact was so negative that farmers used dynamite to breach the aqueduct and temporarily return the flow to the Owens River. After the second aqueduct was built, a series of litigation began between municipalities in the Owens Valley and ultimately the Sierra Club. The net result has been rulings in favor of the Owens Valley, and some increases in water levels in bodies such as Mono Lake, but ultimately southern California continues to withdraw water at a faster rate than it is being replenished, so the conflict is by no means over.
The Colorado River Compact
To the east of Los Angeles, water rights for the Colorado River were defined by the Colorado River Compact of 1922, which divided states bordering the river into upper basin states (in the Rocky Mountains) and lower basin states (in the plains to the west). The compact appropriated the annual amount of water each group of states could withdraw from the river with the upper basin states receiving the same amount as the lower basin states.
Today forty million people from Wyoming to Mexico receive water from the Colorado River, so the river is vital to communities small and large and for residential and agricultural use. Since the compact was developed, the lower basin states (Arizona, California, Nevada) have developed especially rapidly and now use a lot more water than they did in 1922. Cities such as Phoenix and Las Vegas have experienced some of the most rapid growth in the country.
The compact was modified when the Hoover Dam was constructed, at which time the lower basin states were allocated annual withdrawal amounts. These amounts have led to fierce litigation between Arizona and California, which changed the appropriations in Arizona’s favor. For a long time, only California has completely utilized its quota each year and its surplus was guaranteed by the Secretary of the Interior until 2016. By that time, surging development in Arizona and southern Nevada required full use of their quotas from the Colorado so that the surplus was no longer available to California.
Two major reservoirs exist in the lower Colorado River basin, Lake Mead and Lake Powell, bounded by the Hoover Dam and the Glenn Canyon Dam, respectively. These reservoirs were designed for water management, but both have been drying up recently. The situation is dire in both reservoirs, as the images below show. Let’s start with Lake Powell. This reservoir provides water and electricity generated through turbines in the Glen Canyon Dam to millions of people. The level in Lake Powell is lower than it has ever been. As of June 2023, the level was at 3580 feet with the normal level being 3700 feet. If the level drops below 3490 feet (a level known as “dead pool”), water cannot flow downstream to the lower basin states from the reservoir. In addition, the dam would not be able to generate electricity, potentially cutting off power to millions.
Lake Mead’s issues may be even more pressing, as the lake provides 90 percent of nearby Las Vegas’s water. The largest reservoir in the country had a level of 1049 feet in May 2022 which was 170 feet below the maximum capacity. The level was so low that sunken boats resurfaced and an intake valve (for pumping to Las Vegas and other communities) was exposed. Las Vegas was taking water from the lower intake valves, which were installed to retrieve water at lower lake levels. Fortunately, there was a massive amount of snow in the mountains in the winter of 2022-2023 and the level has risen somewhat. But regardless, Las Vegas is planning for a future when low water supply is the new normal and frequent dead pool” events when no water flows out of Lake Mead. Fortunately, a third intake valve and pumping station for Las Vegas’s water has been installed below the dead pool level, so the city will still receive water, but the city is already imposing severe water restrictions including banning grass in yards and strictly limiting watering of grass on golf courses. The city also recycles a lot of its water. These and other measures have been successful in reducing the demand for water: over the last twenty years the population has grown by 49% but water use has shrunk by 26%. Regardless, the future looks bleak as the decades long drought in the area is forecasted to continue.
So, the situation is dire for both Lake Mead and Lake Powell, and recently in 2023 the US government brokered a temporary deal whereby the lower basin states (California, Arizona and Nevada) must lower their water extraction from the Colorado by 13 percent. However, a longer term deal must be reached by 2027 and this will likely involve some tough negotiation. Essentially, the original 1922 compact was developed at a very wet time in the west, and the upper basin states (Colorado, Wyoming and New Mexico) can’t afford to give 50% of the water to the lower basin states when they need the water to fuel growth in cities such as Denver and Albuquerque as well as provide the water farmers and ranchers desperately need.
A sign of the times to come, Phoenix just imposed restrictions on development in the fastest growing suburbs where the supply comes from groundwater. The new rules say that no new development can take place without an alternate source of surface or recycled water. Such controls are likely in all of the southwestern cities in the future as climate change leads to even lower water supplies.
Video: 40 Million People Rely on the Colorado River, and Now It's Drying Up (9:32)
What a mess! What an absolute mess! I mean, each time you say, “Oh this is different than it was what's it going to be like in October what's going to be like next April. There isn't a lot about the Colorado river that Jack Schmidt doesn't know. He's been making research trips on it for decades, but he's never seen the river this low. Look at this. Yeah, you used to be able to back a truck in here right into the water. Is this new this year? Essentially, yeah, it's happened within the past six months. I am stunned by how horrible this is. The Colorado is the lifeline of the American Southwest. It runs nearly 1500 miles supplying water and electricity to seven states. In Mexico, some 40 million people rely on its resources. But 20 years of drought made worse by climate change have brought things to a moment of crisis. This part of the river was once the upper end of Lake Powell, one of the two main reservoirs Lake Powell filled for the first time in 1980. That concrete ramp was filled with houseboats, people backing in motorboats, people water skiing, and now look at that. Essentially 1999, 2000 was the last time the water was up at the base of that concrete ramp. And now, it's lower than it's ever been since it filled.
It's not only Powell, Lake Mead, the river's other major reservoir above the Hoover Dam is only about a third full. Unless things change, which they won't this month, officials will declare a tier-one shortage for the first time ever. That means next year major cutbacks are coming, starting with Arizona farmers. When that happens, a lot of farms will look like, Nancy K Woods, she relies on water from another river a tributary to the Colorado, but it got so low she was totally cut off in April. So, this out here, just looking at this, I mean is this, take a look. Is this dead? Now well we don't think it's going to green back up. What were you growing here? Alfalfa. See the seed lines and how it's just all dead?
[Music]
Our dam has no water. We have no water period. [Music] so this is my granddad, and he bought the farm in about 1930, and here he's in the 40s. And he's listing a field getting ready to plant cotton it's an amazing photo. It's about the only picture I have of him on the farm. And this is our family. This was out in a cotton field it's really hot, everybody squinting, it was in august. What I’m struck by looking at this picture, you said it's august but you're standing in a bright green field, beautiful green and it's right over where that dead alfalfa is. Isn't that gorgeous? And that was taken in 2019. I feel like we've been talking about this moment as a future thing for a long time, this idea that there's going to be a time when we have to reduce water usage, we have to we have to pay attention to that, but being out here it feels like that moment's here. It's here. Here we are and there's no turning back. No, right now the population is not going to feel affected. Farmers are going to feel it. Does that create a little bit of a divide where farmers are in this place where you're, well you're taking the bear? To me, yeah. You know, yeah I think it does. There's a big push for land development here, encouraging industry to come in here. You know, new businesses, which means more homes and as that happens, they're going to be using water just like we are. The decisions over who loses water first were largely made back in 2019 as part of a drought contingency agreement between the states that used the river. It took six years to work out and was set to expire in seven. That means negotiators are already starting to worry about how they'll do it all again with many states still trying to build new pipelines and developments and even less water to go around. Tom Bushotzky is responsible for making Arizona’s case and navigating all of these tensions. Starting with the job contingency plan discussions in 2018, and 2019, we have been talking about climate change and the hotter and drier future, really putting that point out there to the water users that we have to be prepared for that. And I think a lot of what's going on with the Colorado river is the hotter drier future's already here. And it might get a little bit worse. Is it fair that farmers who ostensibly are doing something that's sort of essential, growing food for us to live, that they're having to cut back when other people are watering their lawns and not having to limit their shower length? That is a debate that has been growing. But the way the legal priority system works for water supplies, the farmers have that lower priority than the cities. Do you think as this gets harder over the coming years that the interstate negotiations are going to get trickier, so the harder it is in your state, the harder it will be between the states. So, the answer is clearly yes to that question. It remains to be seen what will happen. I know that we collectively will negotiate something. We will. What it's going to be, I don't know. When it's going to be, I don't know. But failure is not an option. It is because otherwise mother nature is going to take over. There are no easy answers for this are there? There are not. And in water, there never are.
[Music]
Do you think we're at a critical point? I think we're at a point where the old ways will not suit us going forward. So, we are at a political critical point where we need to really have hard-nosed talks about where is the best place to use water to do the best good for human society. We have lived with the imagination that there is more water to develop and so we can increase development and it won't hurt anybody. But it is a zero-sum game. There's not any more extra water to develop.
[Music]
Hoover Dam was the first major dam of its kind that was built. And at the time it was built it was the largest in the world. It impounded Lake Mead and downstream agriculture was the primary reason that it was built. We just recently passed a historic low in Lake Mead. It's now at the lowest level that it's been since it filled in the 1930s. In 2000 Lake Mead was at about 95, which was about 15 feet below that walkway right now, just 20 so years ago 2000. Wow that's kind of impossible to picture. Right now, standing here, it's dramatic. Do you expect it'll get back to that point? We need at least four or more years of consecutive good runoff into the upper basin, good snowpack for the reservoirs to be able to rebound completely. Can you talk me through what these structures are? These are intake towers. Water goes in, spins a turbine, which spins a generator and creates hydropower, which goes out to all of these power lines that you see. That's how Las Vegas is lit up at night. Las Vegas is lit up at night and Arizona, and California also receive power from Hoover Dam. I’m waiting to feel my ears pop. We produce our own power. These are little generators. There's one on the Nevada side too. And this is the power for the dam itself. The way it works as the reservoir level is high, there's more pressure pushing the water in to the pipes to the turbines. As it lowers, there's less pressure. Is there a lower limit to how little water there can be in here for them to still work? Elevation 950 is the lowest that we'd be able to go and still produce hydropower. The water level at Lake Mead is currently around 1067 feet. So, if the water level gets below 950, this dam will no longer really function as a generator of power. That is true. But we don't anticipate that happening. Right. Is it a little despairing for you to come out and see? It's concerning. I mean, all of us are concerned but I also have a lot of faith in the people that are working on the problem.
The following animation shows how Lake Powell has dried up since 1999.
Video: Earth 103: Water Level in Lake Powell (00:42) This video is not narrated.
Check Your Understanding
Module Summary and Final Tasks
Module Summary and Final Tasks
End of Module Recap:
In this module, you should have learned the following concepts:
- how water is distributed on the Earth's surface;
- the processes that control the movement of water in the Earth's subsurface;
- the causes of major problems associated with groundwater including subsidence, contamination and saltwater incursion;
- forecasts for precipitation changes related to climate change and how they will play out in terms of groundwater;
- major droughts in the past and their impacts on groundwater;
- water management strategies, examples from the Murray Darling Basin;
- desalinization technologies;
- potential battles over water in the western US and their historical context.
Assignments
You should have read the contents of this module carefully, completed and submitted any labs, the Yellowdig Entry and Reply and taken the Module Quiz. If you have not done so already, please do so before moving on to the next module. Incomplete assignments will negatively impact your final grade.
Labs
- Lab 8: Stream Flow