
The Changing Economics of Solar Energy
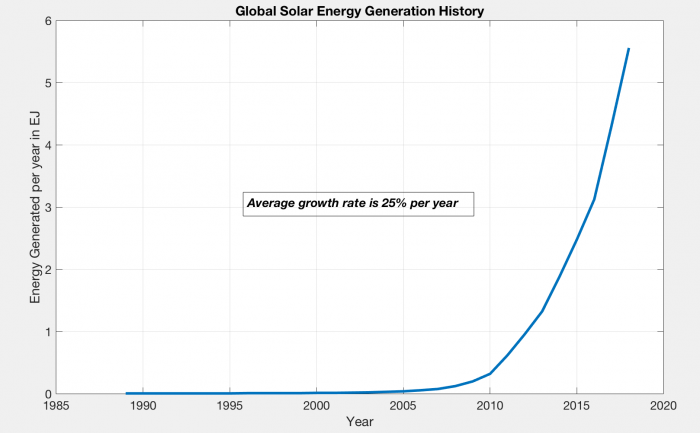
The generation of solar energy – primarily through Solar PV – is a story of exponential growth. Since 2000, the global Solar PV industry has grown by around 25% per year on average, so installed capacity has been doubling every 2.7 years (see below). Even so, solar represents a very small sliver of total global power generation — for now.
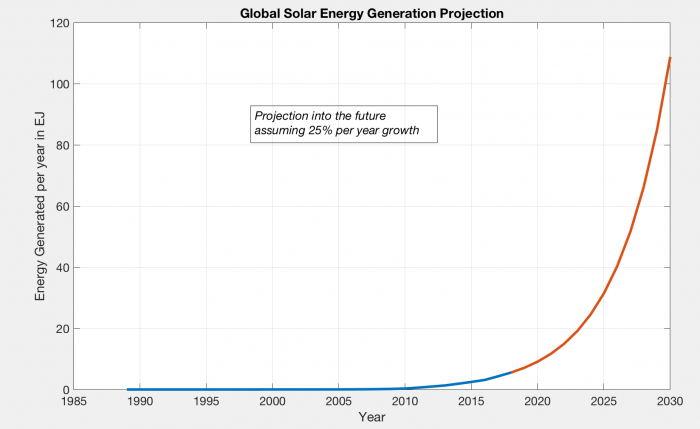
The nice thing about exponential growth is that it is easy to project it into the future. Over the time period shown in the graph above, solar energy generation has grown by 25% per year; if we continue that into the future, we find that before long, we would have enough solar energy to make up a substantial portion of the global energy needs by 2030 (see figure below). By the year 2040, this growth would rise to 1360 EJ, more than twice the global energy consumption of the present. Of course, that makes no sense — we would not produce more energy than we need, and this reminds us of an important fact, which is that exponential growth cannot continue forever.
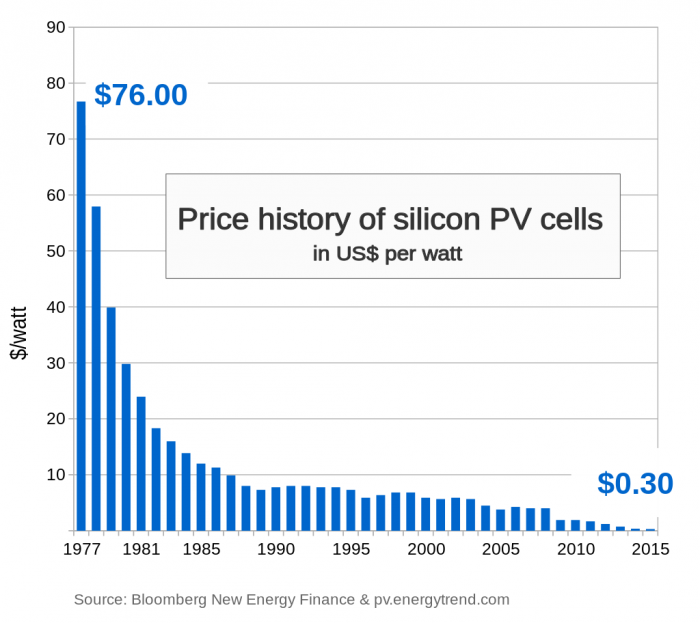
One reason to trust this projected future growth is that the price of solar energy has fallen dramatically over time as can be seen in the graph below. In fact, if the generation of solar PV energy has been growing exponentially, the price has been dropping exponentially.
The price decrease is following a pattern that has been given a name: Swanson’s Law, which states that the price drops by about 20% for each doubling in the number of PV cells produced. This law suggests that the prices of solar PV energy will continue to decline in the future.
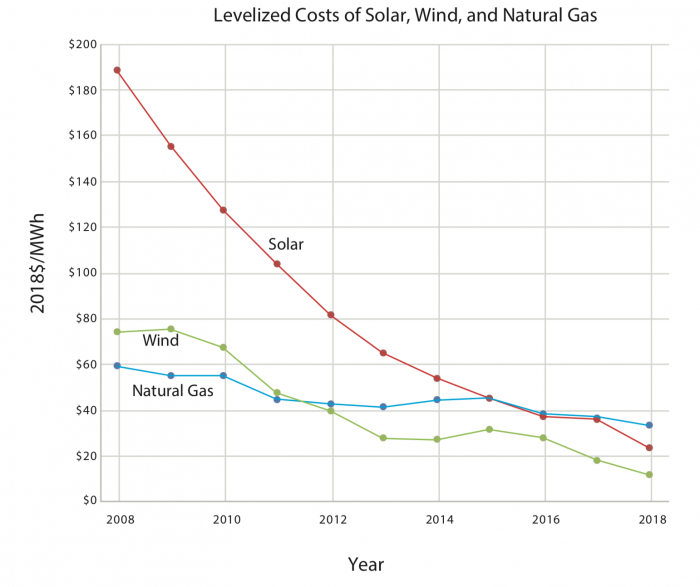
This brings us to an important question — how does the cost of solar energy compare to other sources of energy? Energy economists have come up with a good way of comparing these costs by adding up all of the costs related to producing energy at some utility-scale power plant (a big wind farm, a big solar PV array, a CSP plant, a nuclear plant, a gas or coal-burning power plant). This is called the levelized cost of energy and you get it by taking the sum of construction costs, operation and maintenance costs, and fuel costs over the lifetime of a plant and then dividing that by the sum of all the energy produced by the plant over its lifetime. This cost provides us with a way of comparing the energy from different sources. Since the boom in natural gas production due to fracking, natural gas has been the lowest cost form of energy (which is why coal is being used less and less), but energy from solar and wind have been decreasing rapidly, as can be seen in the following graph. When a renewable electrical energy resource such as solar or wind becomes equal in cost to the cheapest fossil fuel source of electricity, we say that the renewable resource has reached "grid parity". Once grid parity is achieved, the renewable resource makes sense from a purely economic standpoint, and as it drops below the grid parity point, it is the smartest electrical energy resource.
Part of the reason that solar and wind have expanded in recent years has to do with government policies — a number of countries have instituted subsidy and incentive programs that offset a large portion of the construction/installation costs of solar and wind technologies or devise rules that otherwise give advantages to electricity generation from renewables. Subsidies enacted in various countries have included feed-in tariffs (which guarantee an above-market sales price for solar power); rebates (which directly offset capital and installation costs); and favorable tax treatment (which is like an indirect feed-in tariff). Germany has one of the world’s largest Solar PV markets not because it has the best solar resource on earth but because it has been willing to support a generous feed-in tariff on solar power. (For many years the tariff was over 30 cents per kilowatt-hour, or more than five times the average power price in the United States; in recent years the tariff has been reduced.) These government policies have effectively stimulated the growth of these renewable energy resources, which has, in turn, resulted in lower prices.