
Natural and Anthropogenic Warming
VIdeo: SPM2 (2:20)
Natural and Anthropogenic Warming (launch image in a new window)
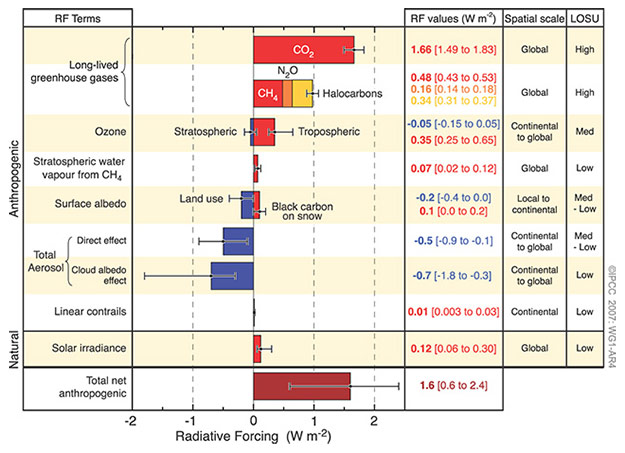
PRESENTER: This fascinating figure is from the IPCC. There's a lot of information on here. It includes the things that are changing-- radiative forcing-- or changing the climate, how much they're doing so, including the uncertainties, whether they expect the whole globe or just part of it, and the level of scientific understanding.
If we do a lot more research-- the low it probably will reduce the size of the uncertainties-- because we can learn more. But how much we understand is included in the uncertainty already. And it includes both the things that humans have done and the things the nature has done. And this goes from the year 1750 up to the year 2005.
The Biggie is our C02, together, with the other greenhouse gases that we put up, as well as the ozone that comes from human activities from pollution. So these all have a warming influence and they are pushing very strongly towards warming. Clearly, there's a couple of other little warming influences, especially us putting soot on top of snow. But there's also these cooling influences.
We've put up a lot of particles, aerosols that block the sun, and they make clouds last longer and make clouds more reflective. And together, those have a lot of cooling. And we've cut dark forests and replaced them by more reflective grasslands.
In addition, since 1750 the sun has brightened a little bit. Over the last 30 years or so, it's actually dimmed, but there's a little bit of that. Add all of these together and there's very clearly a warming influence. And the total warming influences is very similar in size to the CO2 that we've put up.
Taken together, we are pushing the world in a lot of different ways. But because of these cooling influences, if you ask how much of the warming has been caused by our greenhouse gases, the answer is more than all of it. Because it is warm despite these cooling influences.
Official IPCC Caption: IPCC Figure SPM.2 Global average radiative forcing (RF) estimates and ranges in 2005 for anthropogenic carbon dioxide (CO2 ), methane (CH4 ), nitrous oxide (N2O) and other important agents and mechanisms, together with the typical geographical extent (spatial scale) of the forcing and the assessed level of scientific understanding (LOSU). The net anthropogenic radiative forcing and its range are also shown. These require summing asymmetric uncertainty estimates from the component terms, and cannot be obtained by simple addition. Additional forcing factors not included here are considered to have a very low LOSU. Volcanic aerosols contribute an additional natural forcing but are not included in this figure due to their episodic nature. The range for linear contrails does not include other possible effects of aviation on cloudiness.
Greenhouse gases are not the only things that affect climate. But, climate changes have causes; there are no magical “cycles” that somehow change the climate without letting us know why. (There are cycles that affect climate, but they have causes, such as features of Earth’s orbit, that we understand; they are NOT magical!) So, we can assess what things are affecting the climate.
More than a century ago, the Earth was a little on the cold side in what is sometimes called the “Little Ice Age”, because the sun was a bit dim and volcanic eruptions were putting up dust that blocked the sun. The sun brightened early in the 20th century, contributing to warming, as shown by the little red bar extending to the right for natural solar irradiance down near the bottom of the figure. But, over the last 30 years when satellites have given us the best data, the sun seems to have dimmed just a bit. We humans have cut dark forests and replaced them with more-reflective grasslands, cooling the Earth a little, and we have put up a lot of particles to block the sun, with notable cooling influence (you can find blue bars for these, extending to the left, in the figure).
You may meet someone who agrees that the Earth is warming, but argues that much of the change is natural. This is wrong; over the last few decades, warming has occurred despite nature pushing a little toward cooling, and human particles and land-use changes pushing more strongly toward cooling. The most likely answer for how much of the warming has been caused by our greenhouse gases is “More than all of it”, because of warming despite these other cooling influences.
Video: SPM 3 (1:07)
Temperatures, Sea Level and Snow Cover (launch image in a new window)
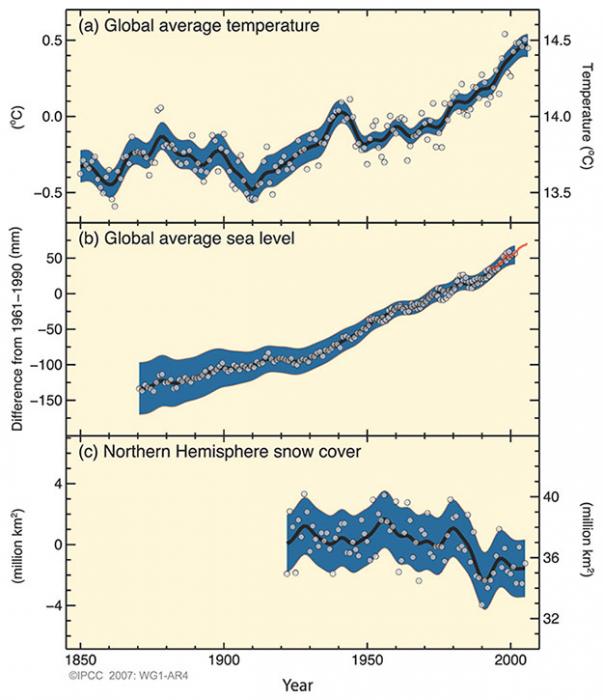
PRESENTER: This figure from the IPCC starts back in 1850 and then runs up to just pass 2000 up here on the right. And it shows indications of warming happening in the climate system. You can see on top here the thermometer record of global average temperature showing not much happening and then recent warming, very clearly.
Sea level, which is given here, rises because ocean water expands as it warms and because warming tends to melt glaciers that are holding water out of the ocean. And so we see a warming influence that shows up in the rising global sea level.
And we also look, if you go to bring time snow cover, you can see that not much was happening. And then you can see it dropping, and that's happening because of warming and the spring is melting the snow. And so these are among many indicators that are showing that yes, the climate system is warming.
Official IPCC Caption: IPCC Figure SPM.3 Observed changes in (a) global average surface temperature, (b) global average sea level from tide gauge (blue) and satellite (red) data and (c) Northern Hemisphere snow cover for March-April. All changes are relative to corresponding averages for the period 1961–1990. Smoothed curves represent decadal average values, while circles show yearly values. The shaded areas are the uncertainty intervals estimated from a comprehensive analysis of known uncertainties (a and b) and from the time series (c).
The temperature is going up. The figure shows a few of the indicators, but many more are known. Consider the next figure, for example.
Video: Surface Temperatures (1:38)
Decadal Land-Surface Average Temperature (launch image in a new window)
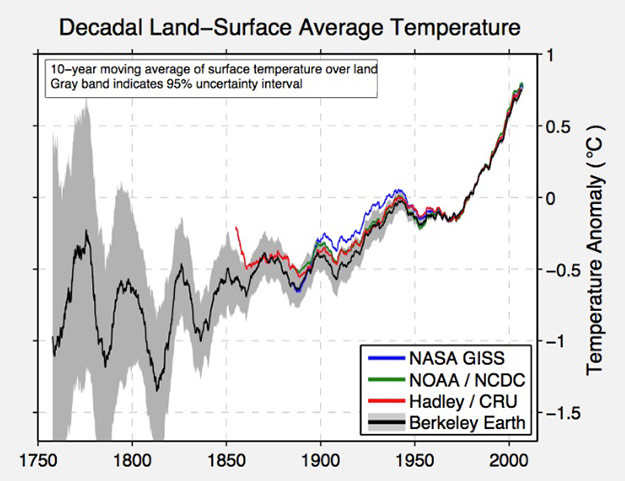
PRESENTER: This figure is from the Berkeley Earth Project. It was run primarily by physicists who did not start out as climate scientists-- with an interesting mix of funding from public sources. But also some of it came from private sources, including those with ties to the fossil fuel industry.
It's looking at the thermometer record of temperature, and just looking at the land. Now if you go back to 1750 up through about 1850, you could see that the uncertainties are really huge. So we're mostly going to focus since 1850.
Many groups have been estimating the temperature, including NASA-- the Goddard Institute for Space Studies, NOAA-- the National Climate Data Center, the British Group, the Hadley Centre, and the Climate Research Unit. And what you can see is those, plus the Berkeley Earth estimates up here on top. And what you'll notice is that the uncertainties in the Berkeley Earth are similar to the differences between the others, which also have their own uncertainties. But you'll see very clearly that there is a strong warming going on.
The different groups have used different techniques. Although, ultimately, they're all using thermometers. Whether they use them all or not this is different for the different ones. But when you have different groups with different funding, different motivations, perhaps, and some working in different places, they all give the same answer. Which is, it's getting warmer. We have very high confidence that it is warming.
The Berkeley Earth project is an interesting attempt by a group involving a lot of physicists who were not primarily climate scientists through much of their careers, to use private as well as public funding to re-calculate the temperature record from thermometers. The Berkeley work follows efforts by NOAA and by NASA in the US, and by a British group at the Hadley Center and the University of East Anglia, and other efforts by others, to calculate global temperature changes from thermometer records. You can see clearly in the figure that over recent decades when the data are best, the different groups get the same answer despite having different funding sources and different techniques. The temperature is going up.
Furthermore, if you throw away the records from thermometers in and near the cities and just look in the country, you see warming. Thermometers in boreholes in the ground show warming. Thermometers taken aloft by balloons (radiosondes), and thermometers looking down from satellites and analyzed in different ways, show warming. So do thermometers in the ocean.
The temperature-sensitive snow and ice also show warming. You would not go searching for this effect in the coldest places; if you start off at -40 and warm by a couple of degrees, the snow and ice won’t melt yet. But, the effects of warming are seen in loss around the edges, in space and time, of seasonal snow cover, river, and lake ice, seasonally and perennially frozen ground, mountain glaciers and more. The melting of land ice and the expansion of ocean water as it warms are driving the rise in global sea level. And, the great majority of significant changes in where plants and animals live, and when they do things during the year, are in the direction of warming. So, warming is occurring, despite natural and human pushes toward cooling over recent decades.
Want to learn more?
Read the Enrichment titled Global Warming Did Not Stop Recently.
We are once again taking a look at the CO2 and the Atmosphere clip. To see a little on the melting of ice, watch 7:22 - 9:04.
 Earth: The Operator's Manual
Video: CO2 and the Atmosphere (9:04)
What CO2 does was confirmed by basic research that had absolutely nothing to do with climate change. (newsreel announcer) A continuance of the upper air program will provide scientific data concerning the physics of the upper atmosphere. (Richard Alley) World War II was over, but the Cold War had begun. The U.S. Air Force needed to understand the atmosphere for communications and to design heat-seeking missiles.
At certain wavelengths carbon dioxide and water vapor block radiation. So the new missiles couldn't see very far if they used a wavelength that CO2 absorbs. Research at the Air Force Geophysics Laboratory in Hanscom, Massachusetts produced an immense database with careful measurements of atmospheric gases. Further research by others applied and extended those discoveries, clearly showing the heat-trapping influence of CO2. The Air Force hadn't set out to study global warming, they just wanted their missiles to work. But physics is physics. The atmosphere doesn't care if you're studying it for warring or warming. Adding CO2 turns up the planet's thermostat. It works the other way as well. Remove CO2 and things cool down. These are the Southern Alps of New Zealand, and their climate history shows that the physicists really got it right. These deep, thick piles of frozen water are glaciers, slow-moving rivers of ice, sitting on land... But once, when temperatures were warmer, they were liquid water, stored in the sea. We're going to follow this one, the Franz Josef, from the summit to the ocean to see the real-world impact of changing levels of CO2.
It's beautiful up here on the highest snowfield, but dangers lurk beneath the surface. I've spent a lot of time on the ice. It's standard practice up here to travel in pairs, roped up for safety. The glacier is fed by something like six meters of water a year... maybe 20 meters, 60 feet of snowfall... it's a really seriously high snowfall. The snow and ice spread under their own weight and is headed downhill at something like a kilometer a year. When ice is speeding up a lot as it flows towards the coast it can crack and open great crevasses that give you a view into the guts of the glacier. Man, this is a big one... Ten... Twenty... Thirty meters more... a hundred feet or more heading down in here, and we can see a whole lot of the structure of the glacier right here.
(man) So, what we're going to do is just gonna sit on the edge and then walk backwards, and I'll lower you. Tell me when. Okay, rolling around, and down we go. Snowfall arrives in layers, each storm putting one down... Summer sun heats the snow, and makes it look a little bit different than the winter snow, and so you build up a history. In these layers there's indications of climate, how much it snowed, what the temperature was. And all of this is being buried by more snow and the weight of that snow squeezes what's beneath it, and turns it to ice. And in doing that, it can trap bubbles. And in those bubbles are samples of old air, a record of the composition of the Earth's atmosphere, including how much CO2 was in it, a record of the temperature on the ice sheets, and how much it snowed. As we'll see, we can open those icy bottles of ancient air, and study the history of Earth's atmosphere.
This landscape also tells the story of the Ice Ages. And the forces that have shaped Earth's climate. Over the last millions of years the brightness of the sun doesn't seem to have changed much, but the Earth's orbit and the tilt of its axis have shifted in regular patterns over tens and hundreds of thousands of years. The orbit changes shape... varying how close and far the Earth gets as it orbits the sun each year.
Over 41,000 years, the tilt of Earth's axis gets larger and smaller, shifting some of the sunshine from the equator to the poles and back. And our planet has a slight wobble, like a child's top, altering which hemisphere is most directly pointed toward the sun when Earth is closest to it. Over tens of thousands of years, these natural variations shift sunlight around on the planet, and that influences climate. More than 20,000 years ago, decreasing amounts of sunshine in the Arctic allowed great ice sheets to grow across North America and Eurasia, reaching the modern sites of New York and Chicago. Sea level fell as water was locked up on land. Changing currents let the oceans absorb CO2 from the air. That cooled the southern hemisphere, and unleashed the immense power of glaciers such as the Franz Josef, which advanced down this wide valley, filling it with deep, thick ice. Now we're flying over today's coastline, where giant boulders are leftovers from that last ice age.
A glacier is a great earthmoving machine. It's a dump truck that carries rocks that fall on top of it. It's a bulldozer that pushes rocks in front of it. And it outlines itself with those rocks making a deposit that we call a moraine, that tells us where the glacier has been. We're 20 kilometers, 12 miles, from the front of the Franz Josef glacier today, but about 20,000 years ago, the ice was depositing these rocks as it flowed past us and out to sea. The rocks we can still see today confirm where the glacier once was. Now, in a computer-generated time-lapse condensing thousands of years of Earth's history... we're seeing what happened. Lower CO2, colder temperatures, more snow and ice, and the Franz Josef advanced.
Twenty thousand years ago, 30% of today's land area was covered by great ice sheets, which locked up so much water that the global sea level was almost 400 feet lower than today. Then, as Earth's orbit changed, temperatures and CO2 rose, and the glacier melted back. The orbits set the stage, but by themselves they weren't enough. We need the warming and cooling effects of rising and falling CO2 to explain the changes we know happened.
Today, atmospheric CO2 is increasing still more, temperatures are rising, and glaciers and ice sheets are melting. You can see this clearly on the lake formed by the shrinking Tasman Glacier, across the range from the Franz Josef. This is what the end of an ice age looks like. Glaciers falling apart, new lakes, new land, icebergs coming off the front of the ice. In the early 1980s, we would have been inside New Zealand's Tasman Glacier right here. Now we're passing icebergs in a new lake from a glacier that has mostly fallen apart and ends over six kilometers, four miles away.
One glacier doesn't tell us what the world is doing, but while the Tasman has been retreating, the great majority of glaciers on the planet have gotten smaller. This is the Columbia Glacier in Alaska. It's a type of glacier that makes the effects of warming easy to see. It's been retreating so fast that the Extreme Ice Survey had to reposition their time-lapse cameras to follow its motion. In Iceland, warming air temperatures have made this glacier simply melt away, leaving streams and small lakes behind. Thermometers in the air show warming, thermometers in the air far from cities, show warming.
Put your thermometer in the ground, in the ocean, look down from satellites, they show warming. The evidence is clear. The earth's climate is warming.
For recent updates on temperature, see NASA’s Goddard Institute for Space Studies (GISTEMP).