
Models Using Natural and Anthropogenic Forcings
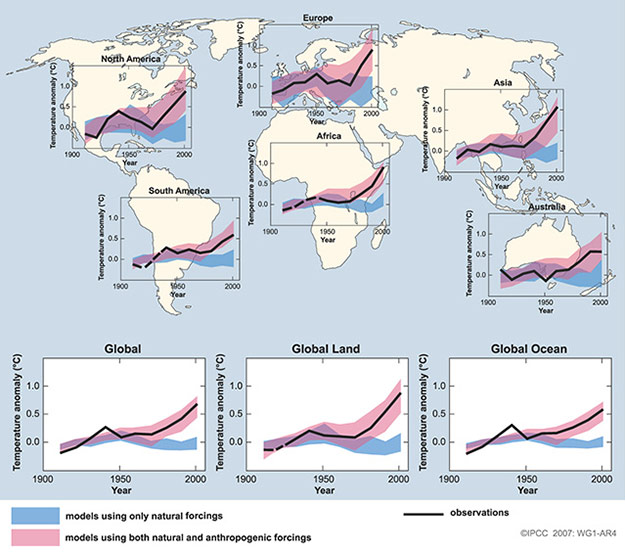
Nature surely has changed the climate in the past, is contributing to climate change now, and will contribute to climate change in the future. In the figure below, models have been used to see what nature has done, compared to what humans have done. In each case, the black line shows the actual history of temperature. The blue bands, which end up below the black line recently on each plot, show the influence of changing sun and volcanoes; a band is plotted, rather than a line, to show the uncertainties in estimating the sun's and volcanic influences and turning them into temperature changes using models. The pink bands, which so nicely match the black lines showing what really happened, were calculated including the effects of natural changes plus the human causes, including both warming and cooling influences.
Video: SPM 4 (2:09)
Models Using Natural and Anthropogenic Forcings (launch image in a new window)
PRESENTER: This wonderful figure from the IPCC is looking at the fingerprint of climate change. All of the different plots go from just more recently than 1900 up to 2000. That was the time that they could do best for this.
And in each plot, the black line is the history of temperature. This is for the globe, this would the globe's land, the globe's ocean, and then continent by continent up here, like Asia and Europe, and so on. So in each case, the black is what happened.
The blue models have been taken, and they've been told what nature did. What the sun was doing, what the volcanoes were doing. And the models then said this is the climate change that nature has caused.
In the pink, in each case, the model has been told what nature did, and what humans did. And what you will see, if you start down here, for example, with the global land, is that the warming back here is possibly caused by nature. The sun got a little bit brighter, and coincidentally, the volcanoes quit blocking the sun quite as much as they had done earlier. But recently, the dimming of the sun and some big volcanoes have tried to cool it off. Yet the temperature went up.
And so what you can see in every one of these panels is that you can explain the climate changes that were happening early in the 20th century by natural causes because the human causes were not terribly large. But by the time you get to the later 20th century, if anything, nature tried to cool it off a little bit, yet the temperature went up. And so what we see across the globe, from Australia to North America, is that the fingerprint of climate change is now that of humans, not that of nature. Other fingerprinting exercises give the same answer, which is that we have taken over from nature in controlling climate change.
Official IPCC Caption: IPCC Figure SPM.4 Comparison of observed continental- and global-scale changes in surface temperature with results simulated by climate models using natural and anthropogenic forcings. Decadal averages of observations are shown for the period 1906 to 2005 (black line) plotted against the center of the decade and relative to the corresponding average for 1901–1950. Lines are dashed where spatial coverage is less than 50%. Blue shaded bands show the 5–95% range for 19 simulations from five climate models using only the natural forcings due to solar activity and volcanoes. Red shaded bands show the 5–95% range for 58 simulations from 14 climate models using both natural and anthropogenic forcings.
Activate Your Learning
According to the model data shown in the IPCC figure above (SPM-4), can recent warming trends be explained by natural variability in factors beyond our control, such as solar activity and volcanoes? Imagine you are talking to a friend or relative who is not familiar with these models or is unclear on how to interpret them. Try your best to explain what the models show about recent climate change in your own words.
Click for answer.
Note that there are other lines of evidence confirming the relative significance of human influence suggested in the figure above. Suppose for a moment that you decide the satellite data are wrong, and the sun is really getting brighter. (This is not a sensible thing to do, but just suppose…) If this were correct, we know that more energy from the sun will warm the air near the Earth’s surface, but also will warm the air high in the stratosphere. Rising CO2 also warms the air near the surface, but rising CO2 cools the upper stratosphere. (Ultraviolet radiation heats the ozone there, which transfers energy to CO2 in collisions, and the CO2 then radiates the energy to space, so in the presence of much ozone high in the atmosphere where infrared radiation to space is easy, extra CO2 acts as a radiator and causes cooling of the adjacent air.) The observed pattern of changes—warming near the surface but cooling in the upper stratosphere—has the fingerprints of CO2, not the sun or other possible causes of climate change. Other fingerprinting exercises reach the same conclusion.
Taking all of this together, we now have very high scientific confidence that we humans are changing the composition of the atmosphere, primarily through the burning of fossil fuels, and that the rising concentration of important gases is causing warming. Feedbacks in the Earth system modify the initial warming and are acting to amplify the direct effects of our CO2 and increase the warming. The Earth is warming, based on a great range of independent data sets. This warming is occurring despite natural and human-caused cooling influences, and this warming has the pattern in space and time expected from our greenhouse gases plus the other influences on climate. The close agreement between what is happening, and what we expect to happen from our understanding of the climate system, confirms the science. And, because we are fairly confident that much more fossil fuel remains to be burned than we have burned already, the well-confirmed scientific understanding says that coming climate changes will be much bigger than those we have caused so far if we continue on the path we are now following. What that means is coming in the next module.