
For our next experiment, we’ll try a different assumption about what drives oil/gas production — demand. The demand for oil and gas has risen over time due to an increase in the global population and an increase in the per capita energy consumption. Here is what this modified version of the model looks like:
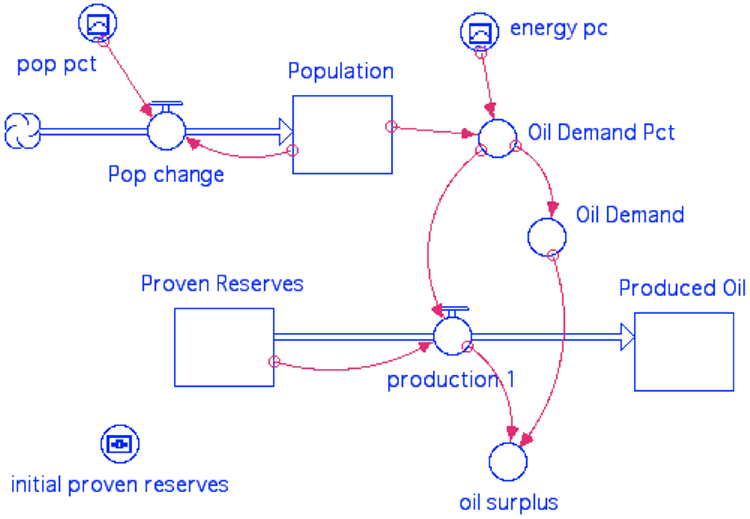
Here, the population increases according to pop pct, which is the net growth percentage per year derived from historical data and then extrapolated into the future — so it is a graphical function that changes over time. The population starts at the 1800 level of 1 billion; the net growth % drops to 0 in 2100, and at that point, the population will stabilize.
The demand for oil/gas is represented here by per capita demand, which is essentially a percentage of the proven reserves per billion people. The per capita demand is another graphical function of time, patterned after actual history up until 2010 and then extrapolated to 2100 — optimistically assuming that the per capita energy demands will level off at about 2100. Multiplying the population times the per capita demand gives us r, the fraction of the proven reserves produced in a given year, and then r multiplied by the Proven Reserves gives us the production. The fraction r will increase as the population grows and as the per capita demand grows, and if population and per capita demand level off, so will r. Recall from experiment 2 that if r is increasing over time, a peak in production is inevitable.
Because we are using real population values and real values for the per capita demand, it makes sense to use real numbers for the Proven Reserves. At the present time, the best estimates are that there are 1.5 trillion barrels of oil as proven reserves (this number includes natural gas too), and we have consumed about 1.2 trillion barrels from about 1900 to the present. This means that at the beginning of time, our Proven Reserves will be 2.7 trillion barrels.
This model also includes a component called per capita oil that keeps track of how much oil is actually available per person, by taking the production and dividing it by the population. As per capita oil increases, we can use more and more oil for our energy needs, but as it decreases, we will have to either reduce our energy consumption or turn to other sources to meet our energy demands.
Questions
4A. Can you guess what will happen? Remember that r here is just like r in the earlier models, and you’ve seen what happens to the production history when r increases over time. Which of the following represents your approximate prediction?
a) Production will increase throughout the model run
b) Production will decrease throughout the model run
c) Production will peak sometime during the model run
Now run the model by clicking this link, and and see what happens. We will consider this as the “control” for the next experiment.
| Practice | Graded | |
| Initial proven reserves | 2.0 | 3.5 |
(above numbers refer to trillions of barrels of oil)
4B. How will changing the initial size of the Proven Reserves reservoir affect the history of production? Set the initial Proven Reserves to 2.0 for the Practice Assessment (3.5 for the Graded Assessment) and then run the model and see what happens; choose the response below that best represents how your altered model compares with the control. Page 2 of the graph pad will be useful in making this comparison.
a) It peaks at the same time, with a larger peak
b) It peaks at the same time, with a smaller peak
c) It peaks later, with a smaller peak
d) It peaks later, with a larger peak
e) It peaks earlier, with a larger peak
f) It peaks earlier with a smaller peak
g) It does not peak at all
Oil per capita in 2100 = _______ (within 0.1 barrels/person)
Previous time in history with same oil per capita = _______ (within 10 years)
As you can see, this model suggests that our future use of oil will be a little like traveling back in time.