
Experiment 4 - Causes of Climate Change
Things that can cause the climate to change are sometimes called climate forcings, and we’ve just tinkered with two of these — the Sun, and CO2. It is generally agreed upon that on relatively short timescales like the last 1000 years, there are 4 main forcings — solar variability, volcanic eruptions (whose erupted particles and gases block sunlight), aerosols (tiny particles suspended in the air) from pollution, and greenhouse gases (CO2 is the main one). Solar variability and volcanic eruptions are obviously natural climate forcings, while aerosols and greenhouse gases are anthropogenic, meaning they are related to human activities. The history of these forcings is shown in the figure below.
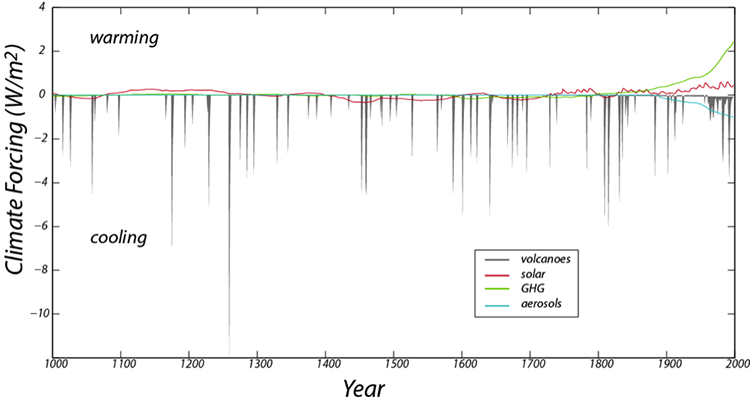
Volcanoes, by spewing ash and sulfate particles into the atmosphere block sunlight and thus have a cooling effect. This history is based on the human records of eruptions in recent times and ash deposits preserved in ice cores and sediment cores for older times; it is best during the historical period. Note that although the volcanoes have a strong cooling effect, the history consists of very brief events. The solar variability comes from actual measurements in recent times and further back in time, on the abundance of an isotope of Beryllium, whose production in the atmosphere is a function of solar intensity. The greenhouse gas forcing record is based on actual measurements in recent times and ice core records further in the past (the ice contains tiny bubbles that trap samples of the atmosphere from the time the snow fell). The aerosol record is based entirely on historical observations and is 0 earlier in time, before we began to burn wood and coal on a large scale.
In this experiment, we will add the history of these forcings over the last 1000 years and see how our climate system responds, comparing the model temperature with the best estimates for what the temperature actually was over that time period. Solar variability, volcanic eruptions, and aerosols all change the Ein or Insolation part of the model, while the greenhouse gas forcing change the Eout part of the model. We can turn the forcings on and off by flicking some switches, and thus get a clear sense of what each of them does and which of them is the most important at various points in time.
We can compare the model temperature history with the reconstructed temperature history for this time period, which comes from a combination of thermometer measurements in recent times and temperature proxy data for the earlier part of the history (these are data from tree rings, corals, stalactites, and ice cores, all of which provide an indirect measure of temperature).
First, open the model with the forcings built in, and study the Model Diagram to get a sense of how the forcings are applied to the model. If you run the model with all of the switches in the off position, you will see our familiar steady state model temperature of 15°C over the whole length of time. The model time goes from 0 to 998 years, but in reality, this is meant to be the year 1000 to 1998 (it ends in 1998, because the forcings are from a paper published in 2000).
| Practice | Graded | |
|---|---|---|
| Ocean Depth | 100 | 300 |
Questions
11. Use the switches to examine the effect of each of the 4 forcings separately (only 1 switch on at a time), and observe how well the model temperature matches the reconstructed (observed) temperature by looking at graph #1 only. Of the 4 forcings, which gives a better fit to the general (smoothed) shape of the observed temperature? (In other words, don’t pay attention to the detailed, squiggly part of the graph).
Best fit from:
- Solar
- Volcanoes
- Aerosols
- GHG (greenhouse gases) [correct answer for the practice version]
12. Now, find the forcing that does the best job of matching the detailed ups and downs (ignoring the longer term trends).
Best fit from:
- Solar
- Volcanoes [correct answer for the practice version]
- Aerosols
- GHG (greenhouse gases)
13. Now try the combinations of the forcings listed below and choose the one that gives the best fit in a numerical sense over the whole length of the model period (years 1000 to 1998).
- All forcings on
- Volcanoes + GHG
- Solar + volcanoes
- Solar + volcanoes + GHG
- GHG + aerosols + volcanoes [correct answer for the practice version]
- GHG + solar
- Volcanoes + aerosols
14. Of all the forcings, which does the best job in terms of matching the strong increase in temperature over the last 100 years? This is the upward-pointing blade of the “hockey stick” pattern. Base your answer on a visual inspection of graph #1.
- Solar
- Aerosols
- Volcanoes
- GHG (greenhouse gases) [correct answer for the practice version]
15. Look back at what was said about the scientific method as a way of learning at the beginning of this activity, and then give an example of something new you’ve learned in this activity, and how experimentation played a role in your learning process.