
Experiment 1 - Changing the Emissions Control Rate (ECR)
In the model, the ECR can vary from 0 to 1, and it expresses the degree to which we take steps to curb emissions; a value of 0 means we do nothing, while a value of 1 means that we essentially bring carbon emissions to a halt. According to Nordhaus, the most efficient way of implementing this control is through some kind of carbon tax, in which case a value close to 1 represents a very hefty carbon tax that would provide strong incentives to develop other forms of energy. In this experiment, we’ll explore 3 scenarios — in A, we’ll keep ECR at a very low level — this is the “do nothing” policy scenario, in B we'll ramp it up steadily through time — this is the “slow and steady” policy scenario, and in C, we’ll ramp it much more quickly, eventually reaching a value of 1.0 — this is the “get serious” policy scenario. You can make these changes in the ECR by altering the graphical converter.
The three different scenarios consist of 5 numbers that are the ECR values for 5 points in time (corresponding to the five vertical lines in the graph); these times are the years 2000, 2050, 2100, 2150, and 2200. There are 2 videos to watch in Module 10 Summative Assessment— the Model Introduction, which gives you an overview of the model and ECR Scenarios which explains how to modify the model to do these problems.
| 1. Do nothing | 2. Slow and Steady | 3. Get Serious | |
|---|---|---|---|
| Practice | Use defaults values (no need to change anything) | 0.005; 0.15; 0.3; 0.45; 0.6 (see video about adjusting these) |
0.005; 0.33; .66; 1.0; 1.0 |
| Graded | Use defaults values (no need to change anything) | 0.005; 0.2; 0.4; 0.6; 0.8 | 0.005; 0.5; 1.0; 1.0;1.0 |
For each scenario, run the model, study the model results, and record the results indicated in the table below and then refer to your results in answering the questions below.
This short video below explains how to make changes to the model. Please take a few minutes to watch the ECR Scenarios video. You will be happy you did later!
Video: ECR Scenarios (5:45)
For this summative assessment, we're basically going to do three different runs with this model. Each one will have a different history of the emissions control rate. So when you open the model up, just reset everything first. The reset button clears everything. Then we're gonna run it with the default values. So for the practice version we use the default values, we're not gonna change anything, we're just gonna run it. We run it and see what happens. Here you can see in red the temperature rising and it gets up to about six point eight degrees Celsius warming. In blue is the carbon emissions that rises and it reaches a peak of about thirty-one gigatonnes of carbon. And then it starts to decrease and then it just sort of ;falls off a cliff right here. It falls off a cliff right there because we actually would run out of fossil fuels at that point. And if you click ahead a few graphs, you can see...there's the emissions. Sorry, go back one. This graph shows the fossil fuels remaining. That drops to zero at this point, so we've totally run out of fossil fuels at that point. So that's a scenario number one. That's they do-nothing scenario.
The next scenario B is called the slow and steady one. And if you look over here in this table, there are some numbers that tell us the values of this emissions control rate at different points in time. So here's what you do. You click on the emissions control right here. You click on table and then these Y values here, ;the numbers that are reflected over here. So .005 point is already there. Now we're gonna put in 0.15, and then 0.3, and then 0.45, and then finally 0.60, and hit okay. And now we see we have a nice slow steady increase in the emissions control rate. That means as time goes on we're gonna kind of slowly do more and more in terms of reducing carbon emissions. That's all we have to change and then we run the model and you see that that results in a somewhat lower global temperature change. Still rises to 5.45 degrees C which is a pretty serious warming by the year 2200.
Now, will it will do one more scenario. This is the get-serious scenario and the values here according to the table are .33, .66, and then 1.0. Now when this has a value one, that effectively means we're going all out, we're going to do whatever it takes to eliminate all carbon emissions. And so we set that up and you can see here it tops out and stays at one there. We run that scenario and sure enough the temperature changes quite a bit less. We have 2.8 degrees of temperature change by the end of time. And you know if you look at the carbon emissions, let's see if you go to this one here, this is all three runs carbon emissions. So the third one would get serious. The carbon emissions they actually drop to zero by the time we get to the year 2152. And they stay at zero at that point.
So then, you've done these three runs. On a number of these graphs, the different curves are presented...run one, run two, run three. So run one would be the do-nothing scenario, run two would be the slow and steady scenario, and run three would be the get-serious scenario. And so there are a whole bunch of different graphs here. Everything is plotted. Here, by the way, these are the total abatement costs. And you can see in the first run the abatement costs are essentially zero all the way along. And then the abatement costs get very big once we've run out of fossil fuels. We have to make up for that with renewable energy and so that's going to be associated with some significant cost. The abatement costs rise up dramatically there and then level off as time goes on.
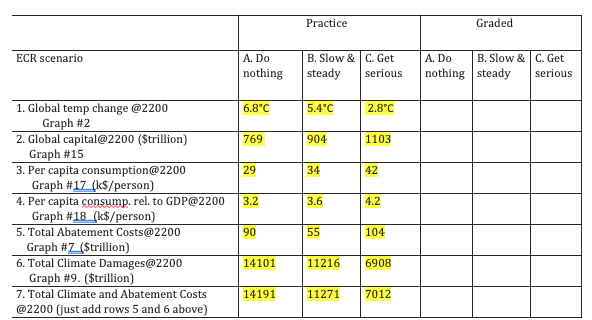
So then, in this worksheet, you see there are a whole bunch of questions to answer. What is the global temperature change at the year 2200 for a scenario A, ;B, and C? And these are the answers that you could get off of these graphs. Graph number 2, graph number 15, 17, 18, 7, 9, and so on. from doing these three scenarios and then toggling back and forth between these graphs, running your cursor along here until you get to the year 2200, and then recording the values, and filling them in in this table. So, if you fill in this part of the table with those values, then you can use these numbers to help you answer the various questions that go along with this experiment.
If you haven't already run the model for this experiment, run the Model now!
For each scenario, study the model results, and record the results indicated in the table below and then refer to your results in answering the questions below.
| Items | Do nothing | Slow and Steady | Get Serious |
|---|---|---|---|
| 1. Global temp change @ 2200 | |||
| 2. Global capital @ 2200 | |||
| 3. Per capita consumption @ 2200 | |||
| 4. Relative per capita consumption @ 2200 | |||
| 5. Sum of relative per capita consumption @ 2200 | |||
| 6. Relative climate costs @ 2200 | |||
| 7. Sum of relative climate costs @ 2200 |
Questions
1. Which of these 3 scenarios leads to the lowest global temperature change?
- Do nothing
- Slow and steady
- Get serious
2. For answer to #1, global temp change @2200 = ____________ (±0.5°C)
3. Which of these 3 scenarios leads to the highest global capital?
- Do nothing
- Slow and steady
- Get serious
4. For answer to #2, global capital @2200 = ____________ (trillion$ ±50)
5. Which of these 3 scenarios leads to the lowest relative climate costs?
- Do nothing
- Slow and steady
- Get serious
6. For answer to #5, relative climate costs @2200 = _______________ (±0.5)
7. Which of these 3 scenarios leads to the greatest relative per capita consumption?
- Do nothing
- Slow and steady
- Get serious
8. In terms of both economic costs (lowest relative climate costs) and benefits (highest relative per capita consumption), which scenario is the best?
- Do nothing — best in both costs and benefits
- Slow and steady — best in both costs and benefits
- Get serious — best in both costs and benefits
- Do nothing — best in benefits; Get serious — best in costs
- Slow and steady — best in benefits; Do nothing — best in costs
Now we step back and consider what we’ve done and learned by responding to the following questions.
9. You have probably heard people (mainly from the realms of business and politics) say that we should not do anything about global climate change because it is too expensive and will hurt our economy. After experimenting with this model, do you agree with them, or do you think they are missing something (and if so, what is it they are missing)?
10. Remember that each ECR history reflects a different economic/political policy. Briefly explain how you came to figure out which policy was the best. In answering this, you have to think about what “best” means — the least environmental damage; the greatest economic gain per person; the easiest policy to implement; or some combination of these?