
 How Wind Turbines Work
In a conventional power plant (fueled by coal or natural gas), combustion heats water to steam and the steam pressure is used to spin the blades of a turbine. The turbine is then connected to a generator, which is a giant coil of wire turning in a magnetic field. This action induces electric current to flow in the wire. The workings of a wind turbine are much different, except that instead of using a fossil fuel heat to boil water and generate steam, the wind is used to directly spin the turbine blades to get the generator turning and to get electricity produced.
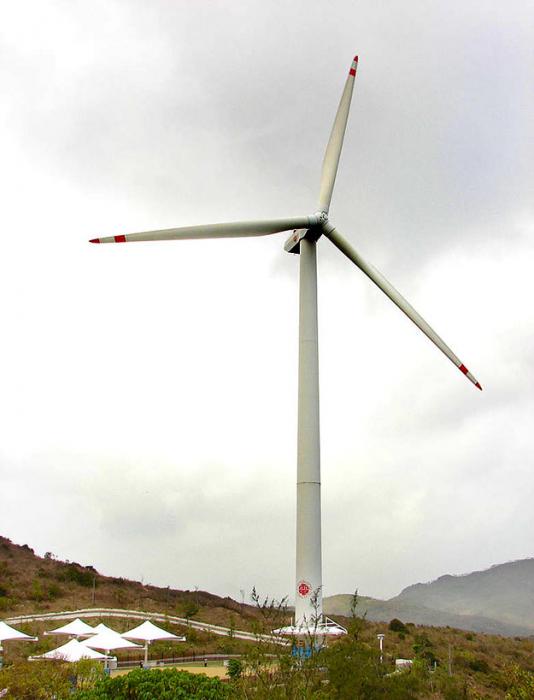
The inner workings of a wind turbine consist of three basic parts, seen in the figure below. The tower is the tall pole on which the wind turbine sits. The nacelle is the box at the top of the tower that contains the important mechanical pieces – the gearbox and generator. The blades are what actually capture the power of the wind and get the gears turning, delivering power to the generator. The direction that the blades are facing can be rotated so that the turbine always faces into the wind, and the pitch of the blades (the angle at which the blades face into the wind) can also be adjusted. Pitch control is important especially in very windy conditions, to keep the gearbox from getting overloaded.
The amount of power (in Watts) collected by a wind turbine is explained in the following equations:
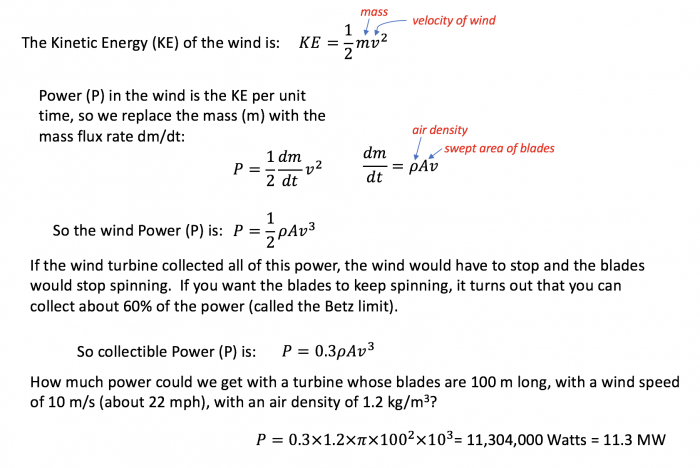
This figure explains the physics of wind power. So we begin with this notion of the moving wind having some kinetic energy which is 1/2 m v2 . So that is kinetic energy. Power is related to energy in the following way: It is energy per unit of time. So if we want the power that we can get from that moving wind, we have to take the kinetic energy, and then the mass flux rate instead of just the mass. Mass flux rate is how much mass is moving per unit of time. That is dm over dt, change in mass over change in time. And that is equal to the air density times the area swept out by the windmill blades times the velocity, so that velocity and area multiplied together gives you something with the units of measure are cubic meters per second, and then you multiply that by the density and that gives you kilograms per second and that’s the mass flux rate. If you put all that together you see the wind power is equal to one half times the air density times the area swept by the blade times the velocity cubed. So you see the velocity is super important in this. Now then it turns out that there is an efficiency limit, something called the “ Betts Limit” that means that the power you can actually collect is 0.3 times the air density times the velocity cubed.
This is clearly a lot of power! But, mechanical inefficiencies related to the gears and the generator mean that we might only get 30% of this figure, but that is still a lot of power from one turbine.
All wind turbines have a minimum wind speed that differs depending on the size but is typically about 4-5 m/s (10 mph) and maximum wind speed above which they shut down to avoid damage, usually around 20-25 m/s (about 50 mph). Most wind turbines have a maximum spinning rate, reached a bit above the minimum velocity, and when the wind speeds up, the pitch of the blades is adjusted so that the rate of spinning remains more or less constant. The figure below shows a typical "power curve" for a small wind turbine.
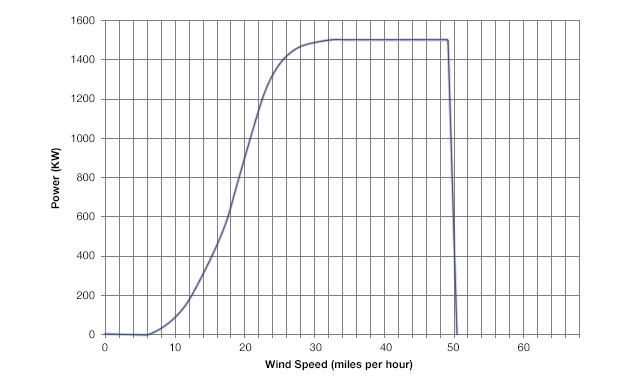
This figure shows the power curve for a 1.5 megawatt wind turbine. So on the Y-axis is the power and the X-axis is the wind speed in miles per hour. And what you can see is that there is sort of a threshold speed that is something like 6 miles per hour wind speed you start to get some power. And as the wind speed increases, the power output rises rapidly until you get to about 30 miles per hour. At that point the power sort of saturates and flattens out and with more wind you don’t get any more power. So it reaches its capacity at 1.5 megawatts and it generates that up until 50 miles per hour and above that the power drops off rapidly because the wind turbine has a shut off mechanism will turn off if the wind gets going to fast because of the turbulence that can cause damage to the wind turbine. So they just shut down if the winds get to great.
The wind, as you may have noticed, is highly variable in any given place, but as a general rule, it is stronger and steadier as you rise up above the ground. This is because friction between the wind and the land surface slows the wind. But there is also a lot of regional variation in the wind velocity. Both of these factors (elevation above the ground and location) can be seen in the maps below, showing the average wind speed in the US at two different heights.
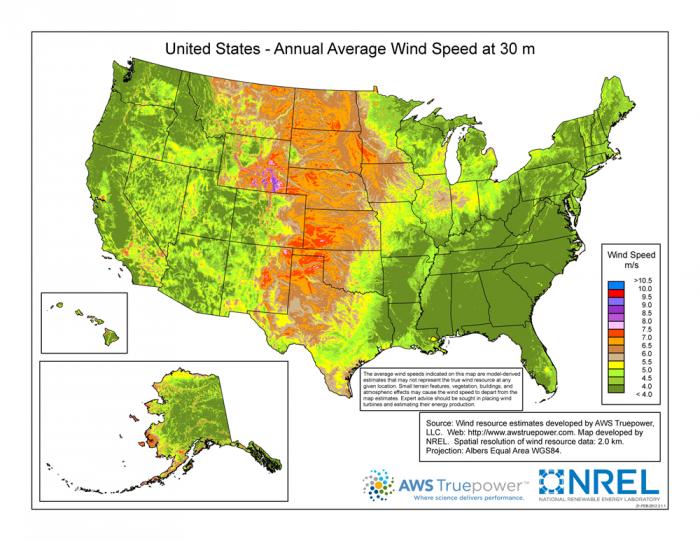
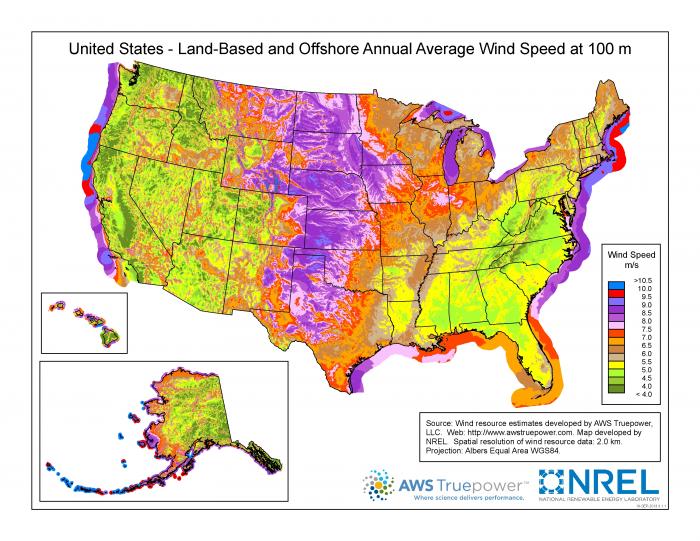
The graphs above show annual average wind speeds in the US at 2 different heights above the ground surface. For reference, 10 m/s is 22.3 mph. You can see that the wind speeds at 100 m are far greater than at 30 m — this is the friction effect of the land surface (which is minimal above large water bodies). As you can see, the Great Plains have great wind potential, as do the Great Lakes and offshore areas on both coasts.
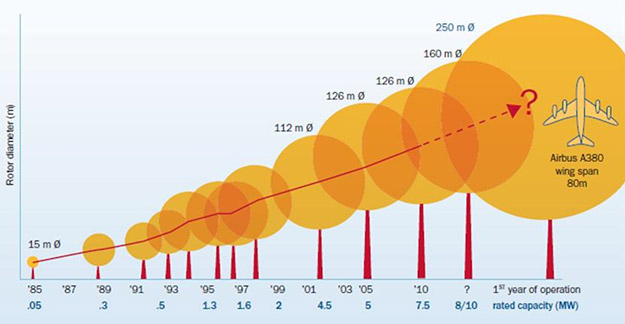
The area covered by the turbine’s blades is another important factor in determining power output. While wind turbines are available in a wide variety of capacities, from a few kilowatts to many thousands of kilowatts, it’s the larger turbine sizes that are being deployed most rapidly in wind farms. Several years ago the image on the right side of the figure below of a Boeing 747 superimposed on a wind turbine gave an astonishing representation for the scale of the state of the art wind technology. Now turbine rotor diameters are approaching the size of the Washington Monument!
Activate Your Learning
Given that the area of wind captured by the turbine is proportional to the square of the radius (essentially the length of the blade), if you were to double the length of a wind turbine's blade, how much more power would that turbine generate? Assume that wind speed and all other variables remain the same.
Click for the answer.