Enrichments
Volcanoes Cool and Warm, without Doubletalk
Right after World War II, when industry powered up in peacetime and started cranking out consumer goods, emissions increased rapidly for both CO2 and particles from smokestacks. If emissions are suddenly ramped up like that, and then held constant, the number of sun-blocking particles in the air increases for a week or so and then stabilizes, because particles are falling out of the air as rapidly as they are added. But, for a given rate of emission, the CO2 concentration of the air will rise for a few hundred thousand years, until the rate of rock weathering balances the new, raised rate of emission. (Human emissions did not remain constant, but this may help you think about things.) For industry after the war, the particles emitted in the first week had a cooling effect that was much larger than the warming effect of the CO2 emitted during that week. But, as years became decades, the particles fell down, much of the CO2 stayed up, and the warming grew to outweigh the cooling.
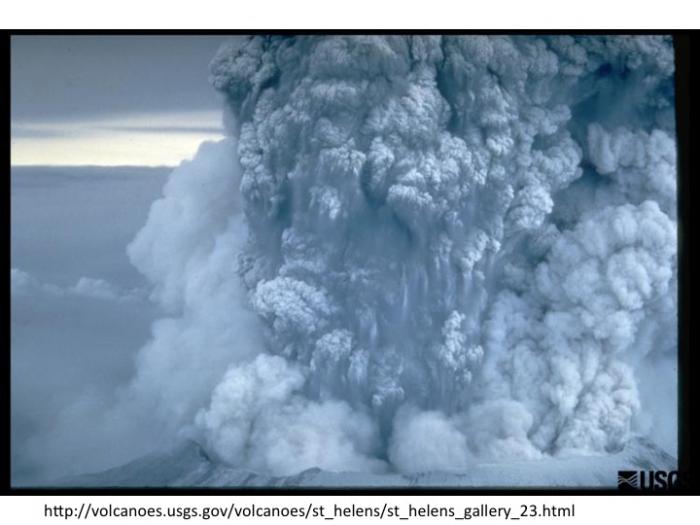
Volcanic eruptions have essentially the same story. Over short times, the sun-blocking cooling from particles exceeds the warming of the CO2. The volcanic particles typically get thrown into the stratosphere, above most rainfall, and so stay up a year or two rather than a week or so, but then fall out. So if extra volcanism continues long enough, the particles fall down, the CO2 builds up, and warming results. Exactly how long you have to wait for “short time” to become “long time” depends on the types of volcanoes and many other issues. In general, an increase in volcanic activity (typically involving many volcanoes, or huge volcanic provinces) will cause cooling over times of years to centuries that most economists worry about, but with warming over longer, geologic time.
The Vostok Ice Core
To help you “see” some of the material we just discussed, here are some data from an ice core at a place called Vostok in East Antarctica. It is probably not the coldest place on Earth, but it’s close. There is a Russian base there with good measuring equipment, and it observed the lowest reliably documented natural temperature ever at Earth’s surface: −89.2°C or −128.6°F. Snow accumulates very slowly there, and an ice core contains a long, accurate record of the temperature at Vostok, and of the atmospheric composition, because air bubbles trapped in the ice are little samples of the old atmosphere. Several long ice-core records have been collected in Antarctica, with the longest continuous one about 800,000 years, and older ice found in other places but disturbed by ice-flow processes so that a complete, continuous record beyond 800,000 years is not yet available from ice cores. (Other sedimentary records go much further back in time, but don’t trap bubbles of old air, so estimates of older atmospheric concentrations rely on indirect indicators and are slightly less certain.)
The temperature record, from the isotopic composition of the ice, is what happened in the Vostok region, not the whole world. But, if you take records from elsewhere, and smooth them a good bit, they all look similar to Vostok; the whole world cooled and warmed together through the ice-age cycles. And as explained in the next clip, this is primarily because of changes in CO2.
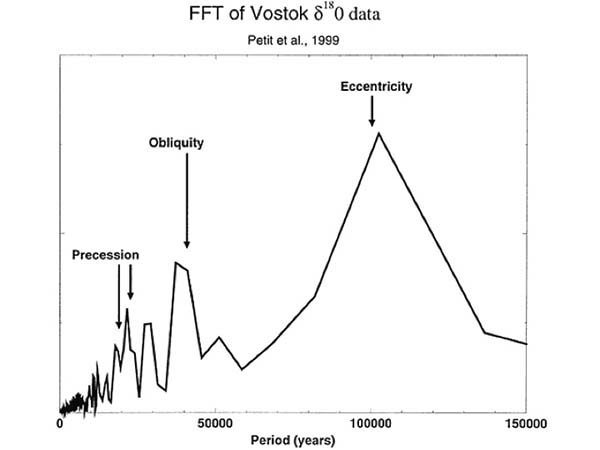
As noted on the previous page, the ice ages were caused by features of Earth’s orbit. The spacing between ice ages actually was predicted decades before it was measured accurately, based on astronomical calculations from the orbits. The prediction and test are explained in the clip just below, and shown in the figure below it. The figure is from a fancy way (called a Fast Fourier Transform, or FFT) to figure out the spacing between wiggles in a curve, such as the climate record—the arrows are the predicted peaks, and you can see that the actual peaks line up beautifully.
The story is wonderfully complicated but can be made fairly simple, again as noted on the previous page. When the summer sun has dropped in the north over thousands of years, ice grew, forming vast ice sheets that have bulldozed across Scandinavia, Boston, New York and Chicago. (Antarctica is already glaciated, and it doesn’t really get cold enough to get ice onto Australia, Africa, or most of South America, so sunshine in the south isn’t so important). The ice sheets were made from water from the ocean, which dropped more than 100 m (about 400 feet). Many other changes occurred as the ice grew, and these shifted some CO2 into the ocean. Then, the whole world cooled, including places getting more sunshine. When sunshine rose in the far north, this reversed. The temperature of the whole world changed together, even though half of the world got less sunshine when the other half got more, and CO2 is the main explanation.
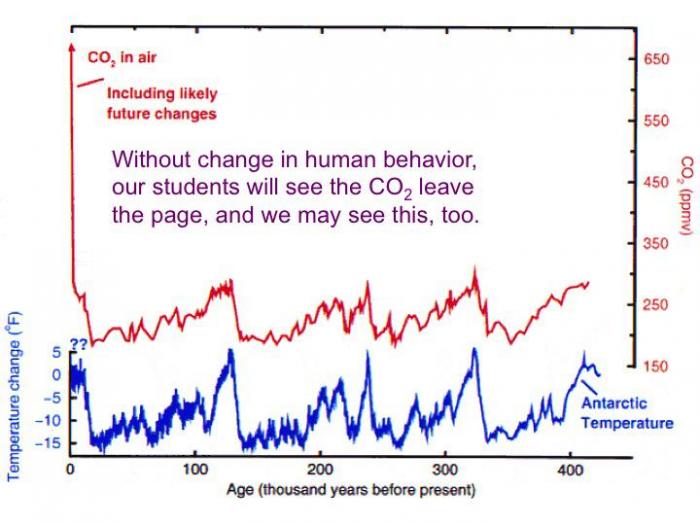
The last figure is then important, showing where CO2 may go this century if we don’t change our energy system.
Video: Data from the Vostok Ice Core (5:45)
PRESENTER: I have to apologize to you for this one. We've done something to you that may be a little bit confusing. Today is over here on your left and this is 400,000 years ago over here on your right. So old is over here on the right and young is over here on the left, and time goes this way.
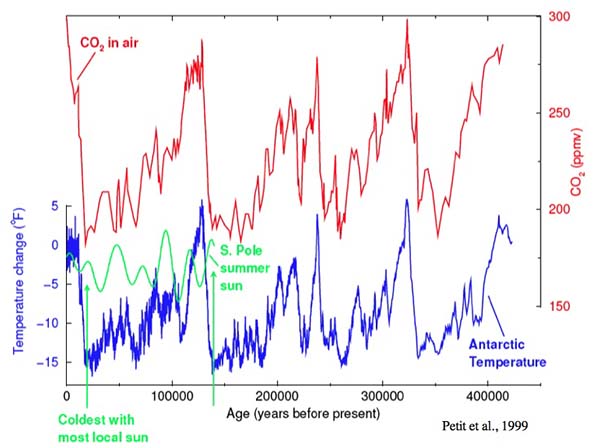
What's shown here, first of all, is the temperature in Antarctica. That's this blue curve down below here. And what you'll notice is it sort of goes down and up and down and up. This is not temperature on the globe. This is temperature in a place in Antarctica, which is called Vostok. But if you blur your eyes, it is sort of temperature on the globe.
And what you'll notice is that this really, really, really does not look like a random curve. It's sort of warm, cold, warm, cold, warm, cold, warm, cold, warm, cold. And you can see this is going tick, tick, tick, tick, tick, tick, tick. And if you look carefully, you'll see some other faster sort of tick, tick, tick, tick, tick running down below here.
There are techniques that people have worked out for an analysis to tell you what are the wiggles that went into making this curve. If you focus on there, this is what you get. There is a big tick, tick, tick, tick, tick, at about 100,000 years spacing. There's one at 41,000 years and there's a couple at 23 and 19,000 years. And this is a remarkable thing, because these are features of Earth's orbit and they were predicted decades before they were discovered.
Milankovitch and other workers before him said, we know that sunshine on the planet is being varied by these things. And when you climate scientist finally get a good enough record. You will find a peak under each of these arrows, and this one actually is an interaction of these two. So they really predicted that one too. And so when it happened, people actually found that there's really no question that we need to worry about that the ice ages are driven by features of Earth's orbit.
They're not driven by CO2 or the brightness of the sun or continental drift. They're driven by wiggles in Earth's orbit. But these Earth's orbit wiggles have very little effect on the total sun that reaches the planet. All they do primarily is move the sun around. So some places will be getting more sun. Other places will be getting less sun. And what's really strange-- I show you here is sort of midsummer sun at the south pole and when you see here, when it was very cold, midsummer sun was actually high at the south pole.
It turns out that temperatures at the south really do depend on sunshine at the south, but they also follow sunshine in the far north. In fact, the whole world follows sunshine in the far north. When ice was growing in Canada the whole world got colder, including places that were getting more sun. When ice was melting in Canada the whole world warmed up, including places that got less sun. Now that's weird.
Some places listen to their sun, some places ignored their sun. How did that happen? Well, you'll notice the second curve up here, this is CO2 in the atmosphere. When the ice grew in Canada, a huge number of things changed on planet-- dust to the ocean, ocean circulation, wind the sea level, a bunch of things. And it shifted some CO2 from the air into the ocean.
When the ice melted on Canada these things changed back and it shifted CO2 out of the ocean and into the air. If you try to explain why the temperature in Antarctica really wasn't following the sun in Antarctica and the temperature at the equator wasn't following the sun at the equator, if you ignore the CO2, no one has ever explained it successfully. If you include the effects of the CO2, it all makes sense. And so the ice ages are caused by features of Earth's orbit but there globalized by CO2 and that helps us to understand that CO2 really does have an effect.
Now suppose we then look at this future, this is the same plot as you saw before except I've squeezed it down to show you the level that we will go to. People taking this course are likely to see us go off of this page. If we don't change our behavior, some of you are likely to live that long. And this was important to this, but we may be going here. Now it is indeed true that as the CO2 gets higher it takes more to make a big difference, but we are making a very big change to the atmosphere in something that we have very, very high confidence will affect the climate.
 Earth: The Operators' Manual
This three-minute clip visits the US National Ice Core Lab to show a little more about the changes in the CO2and the climate that occurred with the ice ages.
Video: CO2 in the Ice Core Record (3:01)
This frozen library, the National Ice Core Lab in Denver, Colorado, has ice from all over... kept at minus 35 degrees. The oldest core here goes back some 400,000 years. Here really ancient ice from Greenland in the north, and Antarctica in the south, reveals Earth's climate history. Let's see what cores like this can tell us.
First are those layers I mentioned in the New Zealand snow. They've turned to ice, and we can count them, summer, winter, summer, winter. Like tree-rings, we can date the core. Other cores tell other stories. Look at this... it's the ash of an Icelandic volcano that blew up to Greenland 50,000 years ago. Cores hold other and even more important secrets... look at these bubbles. They formed as the snow turned to ice and trapped old air that's still in there.
Scientists now are working with cores from Antarctica that go back even further. They tell us, with a very high degree of accuracy, how much carbon dioxide was in the air that far back. Researchers break chunks of ice in vacuum chambers and carefully analyze the gases that come off. They're able to measure very precisely levels of carbon dioxide in that ancient air. Looking at the cores, we see a pattern that repeats... 280 parts per million of CO2, then 180, 280, 180, 280. By analyzing the chemistry of the oxygen atoms in the ice you can also see the pattern of rising and falling temperature over time. Colder during the ice ages, warmer during the interglacial periods. Now put the two lines together... and you can see how closely temperature and carbon dioxide track each other. They're not exactly alike. At times the orbits caused a little temperature change before the feedback effects of CO2 joined in.
But, just as we saw in New Zealand, we can't explain the large size of the changes in temperature without the effects of CO2. This is the signature of natural variation, the cycle of the ice ages driven by changes in Earth's orbit, with no human involvement. But here's where we are today. In just 250 years, since the Industrial Revolution, we've blown past 380 with no sign of slowing down. It's a level not seen in more than 400,000 years, forty times longer than the oldest human civilization.
The History of the World
This is a “minitext” that was originally written by Dr. Richard Alley for Geosciences 320, Geology of Climate Change, at Penn State. It provides a short history of the world’s climate over the last 4.6 billion years. It assumes a little more background knowledge than is expected in the rest of the class, but may be useful.
Deep Time
This is a “minitext” that was originally written by Dr. Richard Alley for Geosciences 320, Geology of Climate Change, at Penn State. It provides a short history of the world’s climate over the last 4.6 billion years. It assumes a little more background knowledge than is expected in the rest of the class but may be useful.
“Deep time” is sometimes difficult to understand. The planet is 4.6 billion years old. If you substitute distance for time, and let the 100-yard length of a US football field (just under 100 m, and roughly the length of a full-sized soccer pitch) be all of the Earth’s history, start at one goal line and drive toward the other, then:
- Trilobites and other shelly critters show up after you have gone 88 yards, just 12 yards from scoring;
- The end-Permian extinction is reached after 95 yards, just 5 yards from the goal;
- The dinosaurs died out less than 1.5 yards from the goal;
- The warming from the coldest part of the last ice age started about 0.02 inches from the goal;
- Humans have been writing down our history for something like 0.005 inches, the thickness of one or two sheets of paper;
- The average college student, approximately 20 years old, has been alive for roughly 1/300th of the thickness of a sheet of paper.
Studying Earth’s history, and the physics, chemistry, biology, geology, and other “ics” and “istries” and “ologies”, provides many insights to the planet. A few of these include:
Earth shows long-term stability. The physics of radiation provide a powerful protector for the planet. Geologists generally can tell with high confidence whether sediments were deposited in liquid water. Such water-laid sediments dominate the geologic record. Furthermore, there are indications of life through most of geologic time. Together, liquid water and life show that the climate of the planet must have one or more stabilizing feedbacks (as noted below, without such feedbacks, bad things would have happened). One of these stabilizing feedbacks is easy-simple radiative balance. Because the radiation emitted by a black body is proportional to the fourth power of the absolute temperature, a 1% rise in temperature of the planet causes a 4% rise in the energy emitted to space by the planet (or a 1% drop in temperature causes a 4% drop in emitted energy — the Earth is not really a black-body, but close enough that you can work with that for now). This means that the hotter something is, the more energy you must supply to increase its temperature another degree. That is a powerful stabilizer.
But black-body physics does not provide enough stabilization alone — the “faint young sun” paradox shows the importance of the greenhouse effect. Solar physicists are confident that the aging of the sun, as it burns hydrogen to helium, has caused the sun’s energy output to increase smoothly over time, starting from about 70% of the modern solar output at the time when the Earth formed. (Hydrogen fuses to helium, packing almost as much mass into a much smaller space in the center of the sun. This increases the sun’s gravitational pull on its outer layers, pulling the surrounding hydrogen more tightly towards the sun’s center. The fusion that powers the sun and converts hydrogen to helium requires that the hydrogen be packed tightly together, so the rising gravity makes fusion run faster, producing more energy.)
This result from solar physics yields the “faint young sun” paradox — assuming modern albedo and greenhouse effect, most of the Earth’s surface water should have been frozen for most of its history, but the available evidence shows that this did not happen. With an active hydrological cycle (as shown by the sedimentary record), hence clouds, there is no known way to lower the albedo enough to solve this problem, so the early Earth must have had a stronger greenhouse effect. (To offset solar output only 70% as large as today with the same greenhouse effect would require a perfectly black planet, not physically possible.) (The distance of the Earth from the Sun has changed a tiny bit over time, but not enough to really matter; collision with a Mars-sized body, such as the one believed to have blasted out material to form the moon, might have moved the planet a couple of percent of its distance from the sun; the meteorite that killed the dinosaurs would have moved the planet less than an inch.)
Rock-weathering stabilizes, too. Many things may have contributed to the stronger early greenhouse. A wide range of evidence indicates that the early atmosphere lacked abundant oxygen. (For example, pieces of minerals that break down rapidly in the presence of oxygen are found, not broken down, in old sedimentary deposits. The huge banded iron formations that we mine in places such as Minnesota have precipitated from ocean water long ago, but getting a whole lot of iron to the ocean in a dissolved form rather than as chunks of rust requires that the water carrying the iron lacks oxygen or rust would have formed. Also, “red beds” — rusty soils and other rusty sedimentary layers deposited above sea level — have formed commonly in “recent” geologic history but are very rare or entirely absent from the early Earth. And, there are still other indications that the early atmosphere lacked abundant free oxygen.) Carbon dioxide is a greenhouse gas, but per molecule and at concentrations vaguely similar to modern, methane is a more potent greenhouse gas than is carbon dioxide. (Raise the methane concentration a lot, and adding still more methane causes the new molecules to partly duplicate the job of existing molecules, just as for CO2 , so the importance per molecule of methane drops as the abundance rises, just as for CO2 and other greenhouse gases.) In the modern atmosphere, oxygen combines with methane over a decade or so to form carbon dioxide; for the early Earth, there may have been more methane and other reduced greenhouse gases because the oxygen wasn’t there to break them down.
The best-understood stabilizer, and the one most likely to have been important, was discovered by Penn State’s Jim Kasting and coworkers. This is the silicate weathering feedback. Volcanoes release carbon dioxide and volcanic rock, which is mostly silicate with a lot of calcium. Chemical processes (many involving biology, and generally lumped together as “rock weathering”) then recombine the carbon dioxide and rock to make dissolved materials that are washed to the ocean, turned into shell by living things (or deposited inorganically if there are no living things around to do the job, with inorganic deposition requiring somewhat higher concentrations in the water than organic deposition), deposited, then (eventually, over time scales of order 100 million years) taken down subduction zones or squeezed in obduction zones, where heating produces carbon dioxide and volcanic rock. (Metamorphic rock also may be formed, releasing carbon dioxide. For this broad-brush approach, metamorphic and volcanic rock are interchangeable.)
The formula is often oversimplified to:
CaSiO3 + CO2 → CaCO3 + SiO2
which shows the volcanic rock and carbon dioxide being changed to shells (calcium carbonate is found in coral reefs, many foraminifera, clams and snails and others; silicon dioxide or silica is found especially in diatom and radiolarian shells and sponge spicules).
The transformation of these shells back to rock and carbon dioxide (draw the arrow the other way) doesn’t much care about the temperature at the surface of the Earth, but the recombination of volcanic rock and carbon dioxide goes faster in a warmer climate (almost all chemistry goes faster when it is warmer, and in this case the chemical kinetics are accelerated further by there being more rainfall on a warmer world, because the reactions typically happen in water). Thus, if the temperature at the Earth’s surface increases, chemistry happens faster, removing carbon dioxide from the atmosphere and lowering the temperature back toward the original value. If the temperature falls, the removal of carbon dioxide from the air slows, the release of carbon dioxide from volcanoes continues unaffected, so the concentration of carbon dioxide in the air rises, increasing the greenhouse effect, and the planet warms back toward the original value. The time scale for this to work is something like 0.5 million years (more or less the residence time of carbon in the combined atmosphere-ocean system). This time scale may have changed over geologic history, but probably by no more than a factor of a few, not orders of magnitude.
Notice that the stabilizer of black-body radiation is almost instantaneous. The stabilizer of rock weathering takes hundreds of thousands of years to matter much. In between, we will see that amplifiers are more important.
Snowball Earth
Probably a few times, especially around 700 million years ago, the Earth seems to have come close to freezing over for a few million years at a time. Deposits of glaciers are found interbedded with marine sediments near the equator. (The Earth’s magnetic field is nearly horizontal near the equator and nearly vertical near the poles. When lava flows cool or sediments settle, the magnetization is aligned with the field and then “frozen in”. Because lava flows and sediment layers tend to be nearly horizontal, the angle between the layering and the magnetization tells the latitude when the rock formed. Near-equatorial sites of deposition for ice-related deposits have been found many times.)
We don’t think that the Earth rolled over on its side, so the planet must have been very cold. One intriguing hypothesis is that the snowball intervals represent rises in oxygen, which oxidized and thus removed chemically-reduced greenhouse gases, thus lowering the greenhouse effect (methane plus oxygen makes carbon dioxide plus water, the water rains out rapidly, and per molecule, the carbon dioxide is less effective as a greenhouse gas than the methane was, so rise of oxygen means fall of greenhouse effect—the greenhouse is still there, but just weaker!). A snowball could develop even with the rock-weathering feedback if the cooling was fast compared to 0.5 million years—a slow stabilizer can’t stop a fast cooling. Indeed, knowing what we do about the faint young sun and the slow rock-weathering feedback, we might even have predicted the occurrence of snowball-Earth events; if we make an analogy to sports, it is likely that the powerful but slow “defense” of the rock-weathering feedback would sometimes “lose” to a “fast-break” offense of climate change.
A snowball planet would have a very high albedo, and a few million years of volcanic carbon dioxide would be required to warm enough over a snowy surface to cause melting. The isotopic composition of carbon deposited during snowball events indicates that the biosphere was greatly reduced during the snowballs. (Today, plants use light carbon preferentially, so shells and the carbonate sedimentary rocks from shells end up with the heavy carbon that is left after the plants get what they want from the in-between carbon coming out of volcanoes. If the biosphere nearly stopped producing more plants, then essentially all of the carbon would be heading for carbonate rocks, probably the inorganic equivalents of shells, and so the rocks would have intermediate carbon isotopes, getting some of the light carbon that normally would go to plants, and this is observed with snowballs.)
Huge layers of odd carbonate deposited on top of the snowball layers seem to be formed from the immense amounts of carbon dioxide released during the snowball intervals. Once the snowball melted from millions of years of volcanic carbon dioxide, the warm temperatures and high carbon dioxide would have caused very rapid, extensive rock weathering, supplying immense quantities of materials to the ocean to make carbonate rocks. Thus, the snowballs show that the rock-weathering feedback works, but slowly. And, the rock-weathering feedback relies on the warming effect of carbon dioxide.
Note also that we don’t see any way that the modern Earth is heading soon for either a snowball or a Venusian runaway greenhouse, although if you look forward hundreds of millions to billions of years, a runaway Venusian greenhouse becomes likely as the sun continues to brighten. (Oddly enough, if you removed all the carbon dioxide from the air today, you probably would get a snowball. Removing the carbon dioxide would cause cooling, which would remove much of the water vapor, causing more cooling. If you removed all the water vapor, the oceans would put more up before the Earth could freeze over. So, while the water vapor contributes more of the greenhouse effect today than does carbon dioxide, the carbon dioxide is arguably the most important greenhouse gas because it controls a lot of the water vapor.) (Note also that the study of snowball-Earth events is very difficult, with only rare records of relatively short-lived but old events. The science is evolving rapidly, and some of what you read just above may be modified fairly quickly.)
Nature Has Changed Carbon Dioxide a Lot
Nature has changed carbon dioxide a lot, but slowly, and climate has responded rapidly. Younger than the snowballs, over the last half-billion years or so, we have had an atmosphere recognizably similar to the modern one in having oxygen. (You need a lot of oxygen to allow big critters, and there is a rich fossil record of big critters over the last 500 million years. Too much oxygen and everything burns rapidly, but there is a rich fossil record of unburned things.) The rate at which geology recycles shells to make carbon dioxide and sends that carbon dioxide out to make volcanic rocks can change — big belches of hot rock from deep in the mantle can occur, for example (there is carbon dioxide down there, and if a hot-spot plume head hits the surface to feed giant flood basalts, a lot of carbon dioxide can come out), and the collisions between continents that make a lot of metamorphic rocks happen only occasionally. (If North America and Asia continue moving towards each other as rapidly as your fingernails grow, another big collision may occur in a couple-hundred million years!) If there are no big mountains, soil builds up and the carbon dioxide in the air may have trouble getting all the way down to attack rocks and cause weathering. If the mountains are high, much of the soil can wash or slide off, exposing rocks to faster weathering. And, the mere accidents of geology might matter — shales at the surface don’t weather very rapidly, carbonates weather to produce carbonate shells in the ocean with no net change, but weathering of many volcanic rocks can be fast and remove carbon dioxide from the air, so the geologic accidents that control what rocks are at the surface may affect the setting of the rock-weathering “thermostat”.
And, evolution can affect how rapidly carbon is stored to make fossil fuels (which naturally release their carbon back to the atmosphere when erosion brings them to the surface and living things “eat” them.) There is a fascinating hypothesis that the great coal beds of Pennsylvania and many other places, which formed during the “Carboniferous” — the Mississippian and Pennsylvanian Periods — record the evolution of successful plants containing really hard-to-eat woody structures, and that coal formation was rapid but then slowed greatly tens of millions of years later as termites and fungi and other things evolved to break down those woody structures. When fossil fuels are being formed, carbon is being transferred from atmospheric carbon dioxide to oil or coal or natural gas in the ground, and when fossil fuels are being burned, the carbon dioxide is going back into the air. The time scale for lots of evolution to occur, or for lots of rearrangement of continents to occur, is sort of 100 million years, so it is not surprising that changes between high-carbon-dioxide and low-carbon-dioxide times have typically taken about 100 million years. There is no evidence for true cycles (no tick-tick-tick of a clock, such as we see with day-night or summer-winter), but lots of evidence that the changes in carbon dioxide occurred over the time scales one would expect given knowledge of the causes — the world does make sense.
Carbon dioxide has been the main driver of climate change on this hundred-million-year time scale. A statement such as this involves pretty much all of climatology and paleoclimatology. The general path is:
Reconstruct the history of past temperatures, which requires reading the temperature history in sediments, and knowing the time when the sediments were deposited. This can be done with considerable confidence; old crocodile-like critters on Ellesmere Island very close to the North Pole are a pretty good indication that it wasn’t too cold there then.
Reconstruct the history of past carbon-dioxide concentration in the atmosphere, again requiring ages as well as indicators of the atmospheric composition. Before ice cores (and the oldest ice core is less than 1 million years), the indicators of carbon dioxide in the atmosphere are not as clear as we’d like, but considerable agreement from several lines of evidence allows us to tell in general when carbon dioxide was high or low, and to make some quantitative estimates. (For example, plants “prefer” the lighter carbon-12, which diffuses and reacts more rapidly, so when carbon dioxide is common, plants are especially enriched in carbon-12; when carbon dioxide is rare, plants have to use more of the carbon-13. Special cell-wall molecules in the ocean, and soil carbonates, and remains of some water plants from lakes, are used to learn the carbon-12:carbon-13 ratio and hence the carbon dioxide level. Leaves grow fewer “breathing holes” — stomata — when there is more carbon dioxide in the environment, because stomata lose water while gaining carbon dioxide, so when carbon dioxide is high, plants can save water. Rising carbon dioxide shifts the ocean toward greater acidity, and this affects whether the little bit of boron in the ocean is as B(OH)3 or B(OH)4-1. The charged form substitutes more easily into carbonates, so the ratio of boron to calcium in a shell increases as the carbon dioxide drops. In addition, the charged ion of boron preferentially holds the light isotope boron-10 in comparison to the heavy boron-11. The residence time of boron in the ocean is many millions of years. Over shorter times, a drop in carbon dioxide will shift most of the boron in the ocean to the charged form, so its isotopic composition must become heavier as it comes to match the whole-ocean value, and the charged form is included in carbonates. There are other ways to get paleo-carbon-dioxide as well.)
Assess the correlation. The simple answer is that the correlation is not perfect, but is pretty darned good. There is a broad and shallow “skeptic” literature that plays with the estimates and dates to get fairly poor correlations, but the reputable sources (e.g., the IPCC Working Group I Fourth Assessment Report, chapter 6, at IPCC [5]) show a rather tight coupling.
Attribute the correlation. Does the correlation match expectation from physical understanding? And, is there any other plausible explanation for the correlation, such that the correlation is a fluke, or the correlation arises because something else is controlling both temperature and carbon dioxide? This is the hardest one, and is never complete, because there always might be a new explanation that we haven’t thought of. But, we have known for more than a century that more carbon dioxide should make it warmer, based on fundamental physics that just won’t go away. The reconstructed warmings of the past actually are just about the size expected from our understanding of the effects of carbon dioxide (if there is a problem, the world changed a bit more than we might have expected). And no plausible hypothesis has been proposed that explains what happened without including the carbon dioxide. Moving continents around on the planet, opening and closing “gateways” to affect oceanic circulation, changing land albedo with plants, and other possibilities appear to be “fine-tuning” knobs on the climate, all mattering, but not mattering enough to explain the history by themselves or combined but ignoring carbon dioxide. Whether calculated on the back of an envelope or in a full Earth-system model, these non-carbon-dioxide effects do not suffice to explain the changes reconstructed from the features of the rock record, nor do other possible causes correlate well in time with the changes that happened in the climate.
Changes in carbon dioxide and other things can matter a lot to life. The early geologists named time intervals in geologic history, and the rocks deposited during those time intervals. Name changes were chosen at key times. The end of the Mesozoic, for example, is now known to have been caused by a huge meteorite impact that killed the dinosaurs. The end of the Paleozoic killed even more living things, and seems to have been linked to carbon dioxide. The last Period of the Paleozoic Era is the Permian, and the end-Permian extinction was the biggest mass extinction. Some uncertainty remains, but the leading hypothesis now is that a “plume head”, the mushroom-shaped top of a new hot spot bringing heat and mass from deep in the mantle, produced the Siberian traps, a vast basaltic lava-flow province, the biggest known. Carbon dioxide released by this volcanism increased the Earth’s temperature. The new rocks were easily weathered, fertilizing the ocean. Sulfur released by this affected chemistry. The warming from the carbon dioxide reduced the oxygen content of the ocean, and the warming caused the surface waters to “float” more strongly, reducing the ocean circulation taking oxygen to the deep ocean. Large areas became anoxic and euxinic, producing hydrogen sulfide, which is poisonous to many, many things. Certain bacteria, called Chlorobiaceae, or green sulfur bacteria, use hydrogen sulfide instead of water in photosynthesis, and make distinctive organic molecules. These molecules are found in sediments from shallow oceans at the end of the Permian, indicating that poisonous hydrogen sulfide was widespread. (No serious science yet suggests that human carbon dioxide could cause such a disaster, but our actions can contribute to spread of “dead zones” in the ocean that are in some ways analogous. And, note that we are releasing carbon dioxide faster than we believe the volcanoes released it at that time.)
Perhaps without going all the way to poisonous hydrogen sulfide, other times have produced low-oxygen marine environments that allowed deposition of organic-rich material that would have been eaten and burned if oxygen had been higher. The sediments are often black shales, and the “fracking” for natural gas now going on is exploiting the carbon in these deposits. Warm temperatures favor such anoxic events, including the oceanic anoxic events (OAEs) of the saurian sauna of the Cretaceous Period. Note that such deposition tends to lower the carbon dioxide in the air, leading to subsequent cooling. Coal formation also will tend to lower carbon dioxide in the air and favor cooling.
Faster changes in carbon dioxide have occurred, again with higher carbon dioxide causing warming. The best-documented of these is the Paleocene-Eocene Thermal Maximum (PETM). Temperature indicators show warming over a few thousand years, with warmth persisting for 200,000 years or so. Carbon dioxide shows the same history. Isotopic indicators suggest that the carbon dioxide came from volcanic and biological sources. The rapid warming and carbon-dioxide increase came with an acidification of the ocean (carbon dioxide and water make a weak acid), and with a major extinction event for bottom-dwelling types; extinction appears to have been in response to the climate change, with no plausible way that the extinction could have somehow caused the climate change. The most-likely source of the carbon was a large amount of volcanic activity, linked to the “unzipping” of the North Atlantic especially between Greenland and Europe, with melted rock squirting into sediments loaded with organic material (oil, coal and gas). And, the warming then seems to have released more carbon that was stored in plants, or soils, or sea-bed methane deposits. (At present, plants hold about as much carbon as does the atmosphere, soils somewhat more, and seabed methane more. Anything that caused a notable transfer of carbon from one of those other reservoirs to the atmosphere is in principle capable of explaining the event, including permafrost in Antarctica at the time. Note that the PETM is the biggest and fastest such event over very long times, so a coincidence may have been involved — if causing the PETM was easy, more PETMs would have happened over the vast span of Earth’s history.) The PETM and other abrupt events of the past point to the importance of carbon dioxide in temperature (they were far too fast for continental drift to have mattered, for example), and provide time scales for possible feedbacks in the carbon cycle (not fast enough to control the atmosphere on the time scales of decades to centuries over which human societies operate, but fast enough to matter on those time scales).
Greenhouse to Icehouse
The planet slid from greenhouse to icehouse over the last hundred million years as carbon dioxide fell. The dinosaurs lived on a high-carbon-dioxide, hot world. We have long known that the poles were ice-free in dinosaur times. Early studies indicated that the equator then was not much hotter than today, but those early studies came with the warning that the main indicator used (isotopic composition of planktonic foraminifera) was subject to alteration after deposition that might have turned an indication of “hot” into an indication of “warm”. Recent studies, using other indicators and using very careful searches for unaltered foraminifera shells, are now indicating “hot” in the tropics during dinosaur times. The work is ongoing and a full consensus is not in, but tropical temperatures so hot that un-air-conditioned humans would have found it uncomfortable or even fatal to live on much of the planet now seem possible or even likely. Carbon dioxide remains the best explanation of the warmth, although current models, when given best-estimate carbon-dioxide loadings then, tend to simulate worlds a bit cooler than data indicate; whether this indicates shortcomings in data or models is unknown.
The planet saw widespread ice appearing at the poles about 35 million years ago, and generally carbon dioxide dropped and ice spread until recently. Details of that correlation remain unclear, with some central-estimate reconstructions indicating that some climate features are difficult to explain based on carbon-dioxide changes alone, but with the error bars including a carbon-dioxide explanation. (And the overall trend from greenhouse to icehouse is quite clearly a carbon-dioxide story. Furthermore, as more data have been collected, and better data, the mismatches between estimated carbon-dioxide level and estimated temperature have gotten smaller.)
Regionally, large and interesting changes occurred for reasons unrelated to carbon dioxide. The modern “conveyor belt” circulation in the Atlantic, for example, with surface flow directed northward from the Southern Ocean to near Norway, sinking, and return deep, does not seem to have existed more than a few million years ago when a seaway connected the Atlantic and Pacific Oceans across what is now Central America. (Now, the atmospheric transport of water vapor in the Trade Winds across Central America is not balanced by a return flow in the ocean beneath, so the Atlantic is saltier than the Pacific, and the “conveyor” circulation re-establishes the oceanic balance. With an open seaway across Panama, a much more direct route was possible. And, without the conveyor circulation, oceanic currents and coastal climates would have been quite different, although without a large globally averaged temperature change from the different currents.) In the ice-house world of the last few million years, Milankovitch cyclicity has driven ice-age cycling. The Earth’s orbit has many interesting features. These come from a few sources. First off, there are lots of planets out there, and some big ones. And all the planets run around the sun at different speeds. If you think of the solar system as a horse race, we keep passing Jupiter on the inside, and every time we pass, its gravity tugs on us a bit. The sum of all the tugs changes the Earth’s orbit a bit, giving the eccentricity changes described below. In addition, the rotation of the Earth causes the equator to bulge a bit. The planets, the sun and the moon (mostly the sun and moon) tug on this bulge, and that gives us the changes in obliquity and precession, just like a spinning top. As you might guess now, the important orbital features for this discussion are:
Obliquity
Think of an air-hockey table. Put the sun in the middle, nailed down, tie the Earth to it with a string, and hit the Earth. The Earth will zing around the sun. Put a little pin in the top of the Earth to be the North Pole. If you put the pin sticking straight up, you’re not there yet. The pin is inclined 21 degrees to 24 degrees from straight up, depending on when you look, going from 24 degrees to 21 and back over about 41,000 years. The larger the angle, the more the sun can shine on the North Pole (and on the South Pole, when the Earth is on the other side of the sun on the orbit!), and the less sun hitting the equator. This 41,000-year obliquity cycle moves some of the sun’s energy from equator to poles and back.
Eccentricity
The air-hockey orbit in the previous section isn’t right; the orbit is eccentric (non-circular elliptical; think of a NASCAR track, although with a little curve even on the “straightaways”). A non-circular ellipse has two foci; think of two towers in the infield, both halfway between the straightaways, one a bit right and one a bit left when viewed from the main grandstand. The sun will sit at one of those tower positions (and the sun does not jump back and forth between the towers; it stays put). But, this is a weird NASCAR track; come back later, and the shape is changed a bit, going from almost circular to more squashed and back to almost circular over 100,000 years. (There actually is a 400,000-year modulation, so almost circular-slightly squashed-almost circular-more squashed-almost circular really squashed-almost circular-some squashed....) This change in eccentricity changes the total amount of sun reaching the planet a tiny bit; if you were in one of the towers, and the track were really squashed, the cars would spend a lot of time at the end far away from you where you had trouble seeing them, and only a little time at the near end, and if the cars are counting on being warmed by the “sun” from you, the extra time they spend far away reduces the total sun they receive. For the tiny changes in the Earth orbit, this is only a tenth of a percent or so in total sun received.
Precession
You may remember from the description of obliquity that the North Pole is inclined a bit. In addition to this angle changing, the North Pole also wobbles. Imagine putting your feet against a metal stake in the ground, grabbing the stake with your hands, leaning out until your arms are straight, and then having a friend push you in circles around the stake. Imagine a North Pole sticking up out of your head, extending your spine. The metal stake is “straight up”. If you bend your elbow and pull yourself toward the metal stake, your North Pole will point more nearly in the same direction as the metal stake, because you have changed your obliquity. But if you hold your obliquity the same (don’t bend your arm any more), and your friend pushes you around the metal stake, you are precessing.
Now, suppose you were doing this (metal stake, friend and all) on top of a NASCAR racer, with the sun in one of the towers in the infield. Your friend would have to push you really slowly the drivers would make about 10,000 laps before you got halfway around the metal stake! But notice that you would slowly switch from being on the infield-side of the metal stake when the car was at the end of the track closest to the sun tower (summertime for your North Pole, and wintertime for your South Pole), to being on the outside of the metal stake at that closest approach and on the near side of the metal stake at the farthest distance from the sun tower. This is precession. Notice that if you are close in northern summer, you are far in northern winter, giving a big difference between seasons in the north, but that close in northern summer is close in southern winter, and far in northern winter is close in southern summer, so when the winter-summer difference is large in the north, the winter-summer difference is small in the south, and when the winter-summer difference is small in the north, it is large in the south. Also, your friend is not pushing you with perfect consistency (and, bizarrely enough, the whole track is actually turning slowly, so that the straightaways switch slowly from being mostly north- south to being mostly east-west and on around to north-south again), so that rather than making a full circle of your metal stake every 20,000 laps or so, you typically make a full circle after either 19,000 laps or 23,000 laps. Also notice that, if the orbit/NASCAR track were a perfect circle, the two towers would be exactly in the center, the distance of the car from the tower sun would never change, so that this precession would not matter at all. Thus, precession matters a lot when the orbit is very eccentric, and precession matters little when the orbit is nearly round.
As scientists came to understand the Earth’s orbit and spin, calculation of the effects of these orbital features on the distribution of sunshine on the planet became possible. The most complete pre-computer treatment came from Milutin Milankovitch, so these are usually called Milankovitch cycles. Milankovitch predicted that, when ice-age cycles were understood, it would be found that the climate had varied with periods of 19,000 years, 23,000 years, 41,000 years and 100,000 years. Several decades later, when isotopic records of oceanic foraminifera were developed, these very periodicities were discovered — Milankovitch was right! And, because the different cycles affect north and south, and poles and equator, differently, it is possible to tell where the main controls reside.
The leading interpretation now is that poles are more important than equator, and north more important than south. When Canada and Eurasia received little summer sun, ice grew and the world cooled globally; when the sun increased in the high latitudes of the north, the world warmed and the ice shrank. The changes have been large — roughly 5 C to 6 C globally averaged — and switching from the modern level of about 10% of the land under ice (Greenland and Antarctica, primarily) to about 30% of the modern land area under ice (with glaciers over Erie and the Poconos in Pennsylvania, among many other places — note that when the ice spread, sea level fell, revealing land that is now under ocean, such that the total non-ice-covered land area was about the same then as now).
Oddly enough, northern sun has been more important than southern sun, with cooling in the south during some times when sunshine was increasing there. Many people have tried to explain this odd behavior in many ways, but so far the only successful explanations involve carbon dioxide. (The high albedo of the expanded ice contributed to the cooling, as did the sun-blocking effect of extra dust, plus shifts from trees to grasslands or tundra with higher albedo, but these together don’t explain the whole signal; the carbon dioxide, and a bit of methane and nitrous oxide change, were important.) Whenever the ice sheets have grown in the north in response to reduced sunshine there, carbon dioxide has dropped, and the carbon dioxide provides a successful explanation of the changes in the south. The path is: changing sunshine to changing things in the Earth system (temperature, ice volume, sea level, dust, etc.) to changing carbon dioxide to more changes in temperature in response, so the carbon dioxide is a positive feedback, not a cause.
The processes by which changing ice volume affects carbon dioxide are rather complex, involve many different pieces of the Earth system, and are a bit beyond our course. One, for example, is that ice-sheet growth in the north increases dust supply to the ocean (the glaciers grind up rocks, change winds, etc., increasing dust delivery especially in the north where there is a lot of land to make dust), which fertilizes plankton that turn carbon dioxide into plant, the plankton are eaten, the eaters poop, the poop sinks, and so carbon dioxide is moved into the deep ocean and away from the atmosphere, lowering atmospheric carbon dioxide. There exist many other mechanisms — covering 20% of the land with two-mile-thick ice sheets, lowering the sea level by several hundred feet, changing winds and currents, spreading sea ice in the cold, and other things constitute large perturbations to the Earth system, and it responded in a way that amplified those changes. The most important changes probably relate to shifts in southern winds — now, the winds howl around Antarctica, moving water to their left, hence north because of the Coriolis effect on our eastward-rotating Earth, and driving upwelling that brings CO2 back from the deep ocean, but during ice-age times the winds shifted up on South America and so left more CO2 in the deep ocean, lowering the atmospheric level.
The “skeptics” of climate change are fond of pointing out that temperature change probably started slightly before carbon dioxide change, and then concluding that carbon dioxide cannot be responsible for any of the warming. This is faulty logic, but of the sort that seems sensible to people who know nothing about the subject. (Suppose you run up a big debt on your credit card, and then you end up paying lots of interest on the debt until you go bankrupt. By the skeptic logic, you went into debt before you started paying interest, so the interest cannot have contributed further to your debt because the interest payments lag the debt in time. Wrong.)
A lot of very interesting questions are not fully answered with regard to the ice ages. But, the big picture is clear. The ultimate cause is tied to Milankovitch orbital features, which change the total amount of sunshine reaching a place during a season by 10-20% or even more (although with tiny globally-averaged effect). Many things happen in response to this cause, and carbon-dioxide response is especially important in the global signal. (Growing ice on Canada doesn’t directly make it much colder in Antarctica, but changing carbon dioxide does.) The changes have been large but slow. The 5 C to 6 C warming (10 F warming) from the last ice age, globally averaged, took over 10,000 years, or less than 0.1 F/century; the warming of the last century, tied especially to human activities, has been ten times faster, and the warming in the next century if we don't change our energy system is expected to be faster yet. Similarly, the carbon-dioxide changes of the ice ages were much, much slower than what humans are now doing. The ice ages provide further evidence of the warming effect of carbon dioxide, they allow us to test our models (which work pretty well), but they don’t provide any alternate explanation of recent temperature changes.
Abrupt Changes Have Punctuated Climate History
Abrupt changes have punctuated climate history. An abrupt climate change is one that occurs faster than its cause, or comes so rapidly that ecosystems or economies have trouble adapting. Abrupt climate changes can involve sudden onset of droughts, collapse of ice sheets, or other features of the climate. Studies have especially focused on the north Atlantic events that punctuated the last ice-age cycle (and, probably, earlier cycles).
In the modern world, the relatively salty Atlantic waters become dense enough in the winter to sink in the far northern Atlantic, and then flow south, while warmer surface waters flow north in replacement. Because of this, the North Atlantic Ocean does not freeze in the wintertime even at high latitudes, so the surroundings remain relatively warm all winter. While the “frozen tundra” of Lambeau Field in Green Bay becomes almost too cold for even American football at 45 N latitude in a Wisconsin winter, the Manchester United football/soccer team runs around in shorts at 53 N latitude in England through the winter. The differences in climate between England and Wisconsin arise from several processes, but it is a safe bet that if the North Atlantic Ocean froze in the winter, Manchester United would not be playing a wintertime season.
There is widespread agreement across a range of climate models, from the simplest to the most complex, that a sufficiently large freshening of the north Atlantic under modern or lower carbon-dioxide concentrations would allow wintertime freezing, changing the oceanic and atmospheric circulation. Furthermore, many models find that the climate undergoes jumps — a gradual freshening can lead to a sudden onset of freezing, which will persist through many winters and then terminate suddenly (in as little as a single year, to a few decades). (In many models, the onset of wintertime freezing occurs with loss of the conveyor-belt circulation, but the continuing Trade Winds across Panama increase saltiness in the Atlantic until the conveyor-belt turns on again.)
The data agree with the models. In the past, large floods from ice-dammed lakes, or surges of the ice sheet in Canada, or slower melting of Canadian ice, have delivered extra fresh water to the north Atlantic and led to loss of the conveyor-belt circulation, allowing wintertime freezing in the north Atlantic, and bringing widespread climate changes. These include very strong cooling in wintertime around the north Atlantic, slight cooling around most of the northern hemisphere, slight warming in the southern hemisphere (the conveyor-belt takes sun-warmed water from the south Atlantic to cool in the north- Atlantic winter, so shutting down the flow gives cooling in the north but warming in the south), a southward shift of the tropical circulation pattern, hence strong drying in the places left behind by the intertropical convergence zone (the ITCZ) and strong wetting in the places to which it moves, and general loss of rain in the monsoonal regions of Africa and Asia. Small northern glacier readvance was observed in such events during the termination of the last ice age, but with no ability to return to the ice age (glaciers mostly care about summertime temperatures, but loss of the conveyor primarily cools northern wintertime). Global-average effects of a conveyor shutdown were small-a bit more cooling in north than warming in south, with ice-albedo feedbacks important.
There has been much discussion of whether such an event could occur in the future. A shutdown would affect ocean currents, fisheries, etc., no matter when it occurred. If a shutdown waited too long into the future, the carbon-dioxide warming would largely block wintertime freezing, and with it the big amplifier of climate change. Model results generally show that a shutdown is more likely in a colder climate, and is more likely when a big ice sheet sits on Canada, steering winds towards Spain rather than Norway. Most models of the future agree that melting of Greenland’s ice and other processes will weaken but not shut down the conveyor-belt circulation, and the Intergovernmental Panel on Climate Change (IPCC) in 2007 assessed a <10% chance (but not zero) of an abrupt change over the next century. The movie The Day after Tomorrow surely was not accurate. (But, if your heroes are larger than life, maybe your problems must be larger than life to make an entertaining movie.)
The Holocene shows stability when carbon dioxide was not changing. After the last ice age ended (with the warming beginning about 24,000 years ago and most of the warming completed by 11,500 years ago), we entered what is called the Holocene. Temperature- wise, fluctuations have been small, except for one brief blip about 8200 years ago corresponding to the last of the outburst floods from a lake dammed by the dying ice sheet in Canada.
Not much happened to greenhouse-gas concentrations during most of the Holocene. The Holocene temperature record is well-explained through the influence of changing orbits (more midsummer sunshine in the north a few thousand years ago than more recently), volcanic eruptions (a degree or so cooling for a couple of years from a big eruption that loads the stratosphere with sun-blocking particles; a few eruptions close together can make enough cooling to matter) and solar fluctuations (reconstructed from sunspot observations, using the recent correlation between satellite-measured solar output and sunspot numbers, or reconstructed from beryllium-10 or carbon-14 using the relation between sunspots, the solar wind, and the penetration of cosmic rays that form those isotopes). Some evidence points to a role for changes in the conveyor-belt circulation, which may act to amplify the other causes by slowing slightly in colder times. Searches for influences from changes in the Earth’s magnetic field, from cosmic dust or cosmic rays, or other causes have come up empty; the paleoclimatic record continues to point to a sensible, understandable climate system. (Farther back, about 40,000 years ago, the magnetic field dropped to near zero for a millennium or so, cosmic rays streamed in to create a large spike in beryllium-10, but the climate ignored it, which argues against any serious role for cosmic rays or the magnetic field.)
The Last Century - Humanity Takes Over
Since 2007, every report from the UN IPCC has concluded that warming of the climate system is “unequivocal”. Thermometers show warming, including thermometers far from cities (so it is not just an urban-heat-island effect), thermometers in the ground, in oceans, on balloons, and looking down from satellites. Most of the world’s ice is shrinking, including in places getting more snowfall. Most of the changes in where different things live, and when they do things during a year, are moving in the direction expected with warming. Models forced with the known natural causes match changes in the late 1800s and early 1900s, but not since. Adding human forcings gives a very good match to what happened all the way along. This match includes not merely global-mean surface temperature, but also many aspects of the “fingerprint” — regional temperature changes, vertical temperature changes, oceanic temperature changes, etc. Note that the whole forcing must be included; particles from smokestacks do the volcano job of blocking the sun, but don’t stay up very long, whereas greenhouse gases warm the climate and stay up longer. (The cooling after World War II was forced by human-produced aerosols, based on available information. And the idea that scientists were warning about global cooling in the 1970s, so beloved of the “skeptics”, is a misrepresentation. Newsweek ran an article on this, and some interesting science was being done on ice-age cycling, and on cooling by particulates, and the possibility of a “nuclear winter”, but the scientific community was already primarily focused on warming at that time, and never released any consensus documents pointing to cooling. And while Newsweek may be a respected general-information source, it is NOT a respected scientific source.)
Suppose, for a moment, that you believe the sun has caused the recent warming. There is no support for this in the data; almost 30 years worth of satellite data show no trend in solar output, or a very slight drop, while temperatures on Earth were going up. But suppose you believe that the satellite data are wrong, that the sun has been getting brighter, and that the temperature changes on the planet are solar-caused. A clear prediction of this solar model is warming in the stratosphere as well as in the troposphere, as more energy is added to both. But a greenhouse-gas hypothesis points to tropospheric warming coupled to stratospheric cooling, as the greenhouse gases hold the energy closer to the surface and radiate from high elevation. So, what do the data show? Tropospheric warming-and stratospheric cooling. The “fingerprint” is human, not solar.
The future looks warmer, unless we change our behavior. Everywhere and everywhen we look, more carbon dioxide makes it warmer. This is a fundamental result of physics — there is no serious suggestion that this could be wrong, and extraordinarily strong evidence that it is right. The data agree; warmth and high carbon dioxide have gone together, the warmth is explainable through the known effects of carbon dioxide, and the warmth is not explainable if the effects of carbon dioxide are omitted. When carbon dioxide has been fairly constant, small effects from sun, volcanoes, and perhaps other things have been evident, but these have acted more as fine-tuning knobs than as coarse adjustments.
The planet’s climate is stabilized strongly by the black-body radiative feedback over very short times, and by the feedbacks involving rock weathering and carbon dioxide over very long times. Between, the feedbacks are largely amplifying.
The biggest amplifier is linked to water vapor. At higher temperature, the saturation vapor pressure is higher, and the “kinetics” (evaporation if dry air is over water) are faster. Over the ocean (which is most of the planet), relative humidity is more-or-less constant (the wind mixes dry air down from above into the wet air below, so the air holds most but not all of the water for saturation), and warmer places thus have more water vapor. Warming is increasing water vapor. And water vapor is a powerful greenhouse gas. Humans cannot change water vapor very much directly — the residence time is barely over a week, so the water vapor we put up comes down quickly — but by changing the temperature through other greenhouse gases, we can change atmospheric water vapor because there is an immense ocean out there to respond to the warming by putting more water in the air.
The ice-albedo feedback is straightforward. With warming, snow and ice melt, and that increases absorption of sunlight in the Earth system, warming the planet. Vegetative feedbacks also can matter — we may have cooled the planet a bit by replacing dark forests by more-reflective croplands — but vegetative feedbacks can’t be really huge (they are limited to land, and that particular trees-to-crops switch is limited to croplands). Clouds bring the biggest uncertainties, but the main circulation pattern of the Earth is highly stable, hence the upward and downward motions of air fairly well fixed, hence one cannot make immense changes in cloud easily.
Comparing various models indicates that, if we start from a stable climate similar to that of the Holocene, and then double carbon dioxide with no other forcings, and let water vapor, snow, cloud, etc. respond, the planet will average about 3 C warmer. The direct effect of the carbon dioxide is just over 1 C with the rest from feedbacks. The uncertainty is usually given as 1.5 C, although increasingly it appears that the lower end of that (warming from doubled carbon dioxide being less than 2 C) is more likely to be wishful thinking than science. Efforts to match the history of the last century, of the ice-age cycling, and of longer times, generally agree with the models, strongly reject lower values, but typically include a small possibility of a larger or much larger sensitivity (so things could be a little better than the central estimate, a little worse, or much worse). With enough fossil fuels still in the ground that we could quadruple atmospheric carbon dioxide, and perhaps octuple, and with each doubling of atmospheric carbon dioxide having a roughly equivalent effect on temperature, a central estimate of warming in a burn-it-all future may approach 10 C or more than 15 F; if we burn it all, and the climate is really insensitive, we may get only half of that warming, or we may get twice that much. (And, remember that the difference between the ice-age world and the recent one was about 10 F. Note that we won’t get the full equilibrium warming, because the ocean takes a while to warm up, but carbon dioxide stays up long enough that we are likely to get most of the equilibrium warming.)
The “so what” part of this takes a lot more discussion, which won’t all fit here. In general, warmer temperatures are likely to bring less winter, more summer, sea-level rise, more droughts and more floods (fewer precipitation events with more water in them), drying in grain belts in summer, potential spread of tropical diseases, loss of ecosystems and species. Initially, there is not likely to be too much economic impact in the cold places where vigorous economies are driving the change, but negative impacts in the warm places where great numbers of people live. Eventually, harm is expected to spread to almost everyone almost everywhere.
Economic analysis of these issues is much cruder than physical-scientific analysis (in part because the uncertainties in the physical science are magnified in the economics). Typically, analyses show that an optimal response (considering only the economy, and not ethical issues) involves at least some investment to reduce greenhouse-gas emissions now. A complete fix is often priced at around 1% of the world economy, after a few decades of serious effort.
Of course, this is science, not revealed truth, and is subject to errors. The distribution of possible outcomes is “interesting” — things could be a little better than sketched here, or a little worse, or a lot worse. North Atlantic shutdowns, hundred-year droughts, ice-sheet collapses, and climate sensitivity of 4 or 5 C rather than 3 C for doubled carbon dioxide are clearly within the range of outcomes consistent with current knowledge, whereas no- change or tiny-change worlds are not.
A Parting Thought
A parting thought (remember that this History-of-the-World Enrichment is from Dr. Alley’s more-advanced class, and some of the policies and other issues are covered later in our class): Humans have almost always succeeded in solving problems by being smart. We have a problem with energy-supply and global-warming issues. Our understanding of the problem is very good — much better than the basis underlying many laws and budgets that are passed by our elected officials. Humans have occasionally failed spectacularly by not solving problems, by not being smart enough. These observations may have implications for wise paths forward.
A few sources:
Broecker, W.S. 2002. The Glacial World According to Wally, Third Revised Edition, Eldigio Press, Lamont-Doherty Earth Observatory of Columbia University, Palisades, NY.
Intergovernmental Panel on Climate Change Reports, IPCC [5].
National Research Council, US National Academy of Sciences Reports. In particular, see Abrupt Climate Change: Inevitable Surprises, 2002; and Climate Change Science: An Analysis of Some Key Questions, 2001, available online at The National Academies of Science, Engineering, Medicine [6].
Royer, D.L., R.A. Berner, I.P. Montanez, N.J. Tabor and D.J. Beerling. 2004. CO2 as a primary driver of Phanerozoic climate change. GSA Today, 14(3), 4-10.
Alley, R.B. The Two-Mile Time Machine. Princeton University Press. 2000.
Alley, R.B. The Biggest Control Knob [7]. 2009 Lecture, American Geophysical Union.