Module 4: Global Warming - Physics
Module 4 Overview
Video: Physics, Not Politics (2:06)
I was down in Washington, not that long ago, talking to the staff of an important congressional committee. Which committee? Which party? Doesn’t matter. The bright young lawyer looked at me and said, “I didn’t take science in college. I don’t know science. I don’t like science, but I know that you’re wrong about your science, because Global Warming is based on a hockey stick and it’s broken." The hockey stick she referred to is a history of climate change showing recent rapid warming that’s been confirmed multiple times, and really isn’t broken, nor is it the basis of global warming.
And so my answer to her was, “No, actually global warming is based on physics.” It’s physics that’s been known for more than a century. It’s physics that’s confirmed everyday. And, it’s physics that was really worked out by the Air Force right after World War 2, not for climate, but for things such as sensors on heat seeking missiles. And in some real sense, if you deny the warming influence of the CO2 from our fossil fuels, you’re claiming that the Air Force doesn’t know what kind sensor to put on a heat seeking missile. The discussion we had after that was absolutely fascinating.
Now it’s certainly true that no all aspects of the global warming story are as solid as those physics of radiation in the atmosphere. So let’s go look at the parts that are solid, and see where they start to get speculative or where they start to get arguable.
The science of global warming involves a lot of physics, plus chemistry, biology, climatology, geology, glaciology, ... The science is not that difficult, but the whole story is fairly long. We look at some of this story in Modules 4 and 5.
Not too many years ago, a staff member of an important government committee told Dr. Alley, in approximately these words, “I didn’t study science in college. I don’t know science. I don’t like science. But, I know you’re wrong about your science, because global warming is based on a broken hockey stick.” To which Dr. Alley replied, more or less in these words “No, global warming is based on physics known for over a century, and really refined by the US Air Force after World War II when they were working on issues such as sensors for heat-seeking missiles. If you deny global warming, in some sense you’re denying that the Air Force knows what type of sensor to put on a missile.” The conversation that followed was fascinating.“ (The “hockey stick” that the staff member referred to is the history of temperature over the most recent centuries, based on tree-ring and other records as well as thermometer measurements, and actually has proven to be surprisingly accurate as more data have been collected.)
Public discussion of climate and energy in much of the world, including the US, often involves the question of whether someone or some group “believes in global warming”. Usually, “global warming” is understood to mean that humans are primarily responsible for an ongoing increase in the average temperature of the atmosphere near the Earth’s surface. But, to a scientist working in the field, asking whether they “believe” in global warming from the CO2 from fossil-fuel burning, is a little like asking whether they “believe” that gravity will pull a dropped pencil downward; both are unavoidable consequences of well-understood physics.
You might note that if you dropped your pencil just at the moment a tornado blew the roof off the building, the pencil might go upward; it also might go upward if you dropped it just at the moment that someone turned on a giant and properly aligned electromagnet and the pencil contained enough metal, or if an earthquake suddenly accelerated you just as you were dropping the pencil. We can never be absolutely positive what the future holds.
But, most people accept the tendency for a dropped pencil to fall downward, without asking whether you “believe” in gravity. If they could see in the infrared, they would probably hold similar beliefs about global warming. Within this module, we will explore the Physics of Global Warming.
Goals and Objectives
Goals
- Recognize the natural and human-driven systems and processes that produce energy and affect the climate
- Explain scientific concepts in language non-scientists can understand
- Use numerical tools and publicly available scientific data to demonstrate important concepts about the Earth, its climate, and resources
Learning Objectives
The global-warming story is huge. In this module, we will look at the physics, and the next module covers the history and the impacts. Don't let it get you down; the basics are not nearly as hard as they might seem at first.
After completing this module, students will be able to:
- Recall that carbon dioxide has a well-understood and physically unavoidable warming influence on Earth’s climate
- Recognize that positive feedbacks amplify changes, and negative feedbacks reduce them
- Recall that multiple independent records from different places using different methods all show that both CO2 and temperature are rising
- Explain that patterns of global warming in the past century can only be reproduced by considering both natural and human influences on climate
- Use a model to show that global climate always finds a steady state, but certain factors may influence how long it takes to get there
- Demonstrate that greenhouse gases are the most significant factor controlling surface temperature
Roadmap
| To Read | Materials on the course website (Module 4) | |
|---|---|---|
| To Do | Complete Summative Assessment [1] Quiz 4 |
Due Following Tuesday Due Sunday |
Questions?
If you prefer to use email:
If you have any questions, please email your faculty member through your campus CMS (Canvas/Moodle/myShip). We will check daily to respond. If your question is one that is relevant to the entire class, we may respond to the entire class rather than individually.
If you prefer to use the discussion forums:
If you have any questions, please post them to the Help Discussion. We will check that discussion forum daily to respond. While you are there, feel free to post your own responses if you, too, are able to help out a classmate.
The Unavoidable Warmness of Burning
The Unavoidable Warmness of Burning
Short version: The Earth adjusts its temperature to send back to space as much energy as is received from the Sun. But, the Sun’s shortwave energy passes easily through the air while some of the Earth’s longwave energy is intercepted by carbon dioxide and other “greenhouse” gases, making the Earth warmer than it otherwise would be, with more warming when more greenhouse gas is added to the air. This warmer air picks up water vapor and melts reflective snow and ice, making the total warming even larger.
Friendlier, but longer version: Think about a factory making cars. Many small parts go in, and a few big cars come out. But, the total amount of stuff going in is very nearly the same as the total amount coming out. If they were very different for very long, the factory would either fill up with parts or run out of them. The factory may need to adjust its rate of making cars to match the rate at which parts arrive, speeding up by hiring more workers when the parts arrive rapidly, and slowing down by sending workers home or out for coffee when parts arrive slowly. Keep reading for the longer version!
Tuning the Temperature
You can think of energy in the Earth’s climate in a way that is similar to the materials entering and leaving the car factory. Almost all the energy for the Earth system comes from the Sun. About 30% of this is reflected from clouds and the land surface and the other 70% is absorbed and heats the Earth. (The reflected fraction is called the “albedo”, so we say that the Earth’s albedo is about 30%. We don’t worry much about the heat coming up from the deep Earth because it is almost 4000 times smaller than the absorbed heat from the sun.)energy
You know that when the sun rises in the morning, the temperature in the air can go up a lot, quickly. If all of the Sun’s energy stayed on Earth, everyone would be dead from overheating in much less than a year.
But, warmer things lose energy to colder things. Suppose you turn on an electric stove. As the temperature of the heating element (the “burner”) rises, it begins to heat the pot of water on top to boil the water for your spaghetti. If there isn’t a pot of water on top, you can see the burner begin to glow, radiating energy.
The burner is “glowing” even before you can see the glow, as you could prove to yourself if you watched it while wearing special glasses that can “see” in the infrared, which is a longer wavelength of energy than visible light. As the burner gets hotter, it radiates more energy. And, while it continues to radiate long wavelengths such as the infrared you can’t see, a hotter burner shifts more of its energy to shorter wavelengths you can see, going to red and then orange and yellow as it warms up.
If you keep giving the burner the same amount of energy, its temperature will increase until the outgoing and incoming energy are equal, and then the temperature will stabilize. If you then supply energy more rapidly, the burner will warm to a new level that radiates the extra energy. Always, the burner tends to that temperature at which incoming and outgoing energy are equal, a balance like the stuff going into and out of the factory. But, electricity comes in and electromagnetic radiation goes out, much the way car parts go in and cars come out of the factory.
For the Earth, energy from the very hot Sun comes in, mostly in the short wavelengths of light we can see, and we send back infrared radiation at longer wavelengths. But on average, the total amount of energy going out is just about the same as the total coming in. At the present time, this incoming and outgoing energy is not exactly equal — a bit less is leaving, which means that the Earth is warming.
Potholes
Potholes?
When a car drives out of the factory, there may be tiny cracks in the pavement that the tires roll over easily. And, the road may go down into a small valley and up the other side, again causing no trouble for the car tires. But, if there is a pothole of the wrong size in the way, the tire may drop in, bending the rim, blowing the tire and getting the car stuck. Going really slowly might allow the car to ease through the pothole without damage, and going really fast might jump the pothole, but a car at the wrong speed in the wrong place can fall into the pothole and get into trouble.
We are all familiar with such situations, in which interactions happen when the size or energy is “right”, but otherwise there is almost no interaction. This is very common in the air. The shortwave radiation from the sun does interact with clouds, and the very shortwave (ultraviolet) interacts with ozone (which helps protect us from skin cancer caused by the high-energy radiation), but otherwise most of the light from the sun passes easily through the air. However, the infrared radiation going back up from the Earth does interact with certain gases in the air, which are often called greenhouse gases. Radiation tends to be absorbed if it is at or near those wavelengths with the right energy to make a particular molecule wiggle or spin in a particular way.
A molecule that is wiggling or spinning because it absorbed radiation has extra energy—it is hotter than it was. It usually will quit wiggling or spinning by colliding with a neighboring molecule and passing the extra energy along; occasionally, the extra energy will be sent out as radiation instead. Most of the energy absorbed by molecules in the air was going up from the surface, and if they “re-radiate” the energy it goes in a random direction, which has the effect of reducing the radiation going to space and sending some back to Earth. In the more common case of collisions, even a rare greenhouse gas can heat the atmosphere by repeatedly absorbing energy and then colliding with non-greenhouse molecules.
Without greenhouse gases, the Earth's average surface temperature would be well below freezing —about 18°C or -0.4°F.
Want to learn more?
Read over Enrichment titled The Simplest Climate Model to learn more about this.
Greenhouse Gases
Greenhouse Gases
The greenhouse gases now in the air do keep the Earth’s surface warmer than it otherwise would be, and adding more greenhouse gases will cause more warming. There is nothing new, surprising, or honestly controversial in any of this. With a calculation something like the one in The Simplest Climate Model (read more about it in the enrichments), the French scientist Jean Fourier discovered in 1824 that something was keeping the Earth’s surface anomalously warm, and among the hypotheses he considered was that the atmosphere is acting something like glass holding heat in a container (perhaps the origin of the comparison to a greenhouse; see The Discovery of Global Warming [2]). The British physicist John Tyndall showed in 1859 that gases in the air, including water vapor and carbon dioxide, were contributing to the greenhouse effect. And, in 1896, the Swedish physical chemist and Nobel Prize winner Svante Arrhenius did a fairly good job of calculating the global warming from the carbon dioxide released by the human burning of fossil fuels. (Through history, scientists have actually been better at calculating the effects of greenhouse gases than at realizing just how incredibly skillful fossil-fuel companies would become at supplying large quantities.)
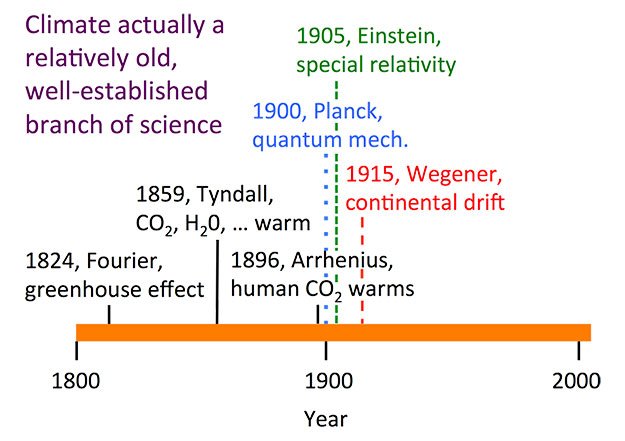
The science of the greenhouse effect thus is not some new discovery but has a long history compared to such “recent” science as relativity (Albert Einstein, 1905) or quantum mechanics (Max Planck, 1900). The pioneers who explored radiation in climate science were giants of physics, chemistry, and mathematics, who saw the strong interactions between laboratory studies and application to the atmosphere.
Much of the work on the details of the interaction between radiation and gases in the air was done by the US Air Force just after World War II and applied to topics such as sensors on heat-seeking missiles, as told in the introduction to this chapter. A missile uses a sensor to “see” the infrared radiation from a hot engine, but greenhouse gases such as carbon dioxide and water vapor block the view in some wavelengths by absorbing that radiation. Because the gases interact with radiation traveling in any direction, and there is much more energy in those wavelengths going up from the sun-warmed Earth than coming down from military bombers, the warming influence of the greenhouse gases is unavoidable.

 Earth: The Operators' Manual
Video: CO2 and the Atmosphere (9:03)
This 9-minute clip will appear three times within modules 4 and 5 this week. To see a short clip on the Air Force's role in understanding the physics of the atmosphere and the warming effect of CO2, watch the first 1 minute and 20 seconds. The material that follows this 1 minute and 20 seconds will be covered later in this module as well as in Module 5.
What CO2 does was confirmed by basic research that had absolutely nothing to do with climate change. (newsreel announcer) A continuance of the upper air program will provide scientific data concerning the physics of the upper atmosphere. (Richard Alley) World War II was over, but the Cold War had begun. The U.S. Air Force needed to understand the atmosphere for communications and to design heat-seeking missiles.
At certain wavelengths carbon dioxide and water vapor block radiation. So the new missiles couldn't see very far if they used a wavelength that CO2 absorbs. Research at the Air Force Geophysics Laboratory in Hanscom, Massachusetts produced an immense database with careful measurements of atmospheric gases. Further research by others applied and extended those discoveries, clearly showing the heat-trapping influence of CO2. The Air Force hadn't set out to study global warming, they just wanted their missiles to work. But physics is physics. The atmosphere doesn't care if you're studying it for warring or warming. Adding CO2 turns up the planet's thermostat. It works the other way as well. Remove CO2, and things cool down. These are the Southern Alps of New Zealand, and their climate history shows that the physicists really got it right. These deep, thick piles of frozen water are glaciers, slow-moving rivers of ice, sitting on land... But once, when temperatures were warmer, they were liquid water, stored in the sea. We're going to follow this one, the Franz Josef, from summit to ocean to see the real-world impact of changing levels of CO2.
It's beautiful up here on the highest snowfield, but dangers lurk beneath the surface. I've spent a lot of time on the ice. It's standard practice up here to travel in pairs, roped up for safety. The glacier is fed by something like six meters of water a year... maybe 20 meters, 60 feet of snowfall... it's a really seriously high snowfall. The snow and ice spread under their own weight and is headed downhill at something like a kilometer a year. When ice is speeding up a lot as it flows towards the coast it can crack and open great crevasses that give you a view into the guts of the glacier. Man, this is a big one... Ten... Twenty... Thirty meters more... a hundred feet or more heading down in here, and we can see a whole lot of the structure of the glacier right here.
(man) So, what we're going to do is just gonna sit on the edge and then walk backward, and I'll lower you. Tell me when. Okay, rolling around, and down we go. Snowfall arrives in layers, each storm putting one down... Summer sun heats the snow and makes it look a little bit different than the winter snow, and so you build up a history. In these layers, there are indications of climate, how much it snowed, what the temperature was. And all of this is being buried by more snow and the weight of that snow squeezes what's beneath it, and turns it to ice. And in doing that, it can trap bubbles. And in those bubbles are samples of old air, a record of the composition of the Earth's atmosphere, including how much CO2 was in it, a record of the temperature on the ice sheets, and how much it snowed. As we'll see, we can open those icy bottles of ancient air, and study the history of Earth's atmosphere.
This landscape also tells the story of the Ice Ages. And the forces that have shaped Earth's climate. Over the last millions of years, the brightness of the sun doesn't seem to have changed much, but the Earth's orbit and the tilt of its axis have shifted in regular patterns over tens and hundreds of thousands of years. The orbit changes shape... varying how close and far the Earth gets as it orbits the sun each year.
Over 41,000 years, the tilt of Earth's axis gets larger and smaller, shifting some of the sunshine from the equator to the poles and back. And our planet has a slight wobble, like a child's top, altering which hemisphere is most directly pointed toward the sun when Earth is closest to it. Over tens of thousands of years, these natural variations shift sunlight around on the planet, and that influences climate. More than 20,000 years ago, decreasing amounts of sunshine in the Arctic allowed great ice sheets to grow across North America and Eurasia, reaching the modern sites of New York and Chicago. Sea level fell as water was locked up on land. Changing currents let the oceans absorb CO2 from the air. That cooled the southern hemisphere and unleashed the immense power of glaciers such as the Franz Josef, which advanced down this wide valley, filling it with deep, thick ice. Now we're flying over today's coastline, where giant boulders are leftovers from that last ice age.
A glacier is a great earthmoving machine. It's a dump truck that carries rocks that fall on top of it. It's a bulldozer that pushes rocks in front of it. And it outlines itself with those rocks making a deposit that we call a moraine that tells us where the glacier has been. We're 20 kilometers, 12 miles, from the front of the Franz Josef glacier today, but about 20,000 years ago, the ice was depositing these rocks as it flowed past us and out to sea. The rocks we can still see today confirm where the glacier once was. Now, in a computer-generated time-lapse, condensing thousands of years of Earth's history, we're seeing what happened. Lower CO2, colder temperatures, more snow and ice, and the Franz Josef advanced.
Twenty thousand years ago, 30% of today's land area was covered by great ice sheets, which locked up so much water that the global sea level was almost 400 feet lower than today. Then, as Earth's orbit changed, temperatures and CO2 rose, and the glacier melted back. The orbits set the stage, but by themselves, they weren't enough. We need the warming and cooling effects of rising and falling CO2 to explain the changes we know happened.
Today, atmospheric CO2 is increasing still more, temperatures are rising, and glaciers and ice sheets are melting. You can see this clearly on the lake formed by the shrinking Tasman Glacier, across the range from the Franz Josef. This is what the end of an ice age looks like. Glaciers falling apart, new lakes, new land, icebergs coming off the front of the ice. In the early 1980s, we would have been inside New Zealand's Tasman Glacier right here. Now we're passing icebergs in a new lake from a glacier that has mostly fallen apart and ends over six kilometers, four miles away.
One glacier doesn't tell us what the world is doing, but while the Tasman has been retreating, the great majority of glaciers on the planet have gotten smaller. This is the Columbia Glacier in Alaska. It's a type of glacier that makes the effects of warming easy to see. It's been retreating so fast that the Extreme Ice Survey had to reposition their time-lapse cameras to follow its motion. In Iceland, warming air temperatures have made this glacier simply melt away, leaving streams and small lakes behind. Thermometers in the air show warming, thermometers in the air far from cities, show warming.
Put your thermometer in the ground, in the ocean, look down from satellites, they show warming. The evidence is clear. The earth's climate is warming.
Credit: Earth: The Operators' Manual
Adding More Greenhouse Gases Increases Temperature
More Greenhouse Gases Increases Temperature
Adding more greenhouse gases does increase the temperature more. Put on more blankets on a cold night, and heat leaves you more slowly, making you feel warmer. But, if you put a really good stopper in the drain of your sink to keep the water in, adding more plugs doesn’t slow down the drainage still more. We thus know situations in which the job is only partly done so that adding more workers or blankets or plugs will do more, but we know other situations in which the job is completely or almost completely done and adding more help doesn’t make a difference.
For carbon dioxide and other greenhouse gases, the job is not done, and adding more does turn up the temperature. This is mostly because the greenhouse gases are very good at absorbing energy of certain wavelengths, but only somewhat good at absorbing slightly different wavelengths. So, while the outgoing radiation in the lower part of the atmosphere is completely blocked for the just-right wavelengths, that outgoing radiation is only partially blocked for the almost-right wavelengths; adding more greenhouse gas increases blockage of the almost-right radiation.
Furthermore, if you go up in the atmosphere, the air gets thinner, and at some height there is so little greenhouse gas that the just-right wavelengths are only partially blocked. Adding more of greenhouse gases such as carbon dioxide increases this height. The temperature at this height adjusts to radiate to space as much energy as is received from the Sun, and, the physics of the atmosphere cause the temperature to increase downward (squeezing air under higher pressure does work on the air that increases its temperature), so raising the height from which radiation escapes warms the surface.
Activate Your Learning
A molecule of a greenhouse gas has more of a warming influence when the gas is rarer; very roughly, each doubling of atmospheric carbon dioxide has the same effect on surface temperature. Going from the level of carbon dioxide in the air before the industrial revolution, 280 parts per million by volume (280 ppm) to twice that, 560 ppm, and letting the climate come into balance will warm the surface by about 3 C. How much more carbon dioxide must be added to the atmosphere to warm the surface by another 3 C?
Click for answer.
Amplifiers
Amplifiers
Because warmer things begin to radiate more energy very quickly, the Earth’s climate is very strongly stabilized, as noted in The Simplest Climate Model. Other processes may stabilize the Earth system by reducing changes or destabilize by amplifying changes.
Some stabilizers can be very important but tend to be very slow. We saw in the last chapter that warming reduces oxygen in the ocean, which makes the burial of organic matter easier. And, because the organic matter grew from carbon dioxide in the air, burying rather than burning the dead bugs lowers atmospheric carbon dioxide. Thus, if something such as a brighter Sun causes warming, fossil-fuel formation reduces the size of the warming. However, we also saw that fossil-fuel formation is a slow process because most plants are still “burned” by bacteria or living things; fossil-fuel formation can be very important over a few hundred thousand years or longer, but not over a few thousand years.
Some carbon dioxide is also picked up from the air by rain, forming a weak acid that breaks down rocks in a process called “weathering”, because the weather is involved. The chemicals released from the rocks are used to make shells, some of which contain carbon dioxide. (A coral reef or a clamshell is calcium carbonate, usually written as CaCO3, but sometimes written as CaO•CO2, showing more clearly that it contains carbon dioxide.) Chemists use Bunsen burners in their labs for good reasons; warming almost always makes chemical reactions go faster. So, if the temperature goes up, chemistry removes carbon dioxide from the atmosphere more rapidly. If something such as a brighter sun raises the Earth’s temperature, this “rock weathering feedback” can remove enough carbon dioxide to cool the climate back close to the starting temperature in approximately ½ million years.
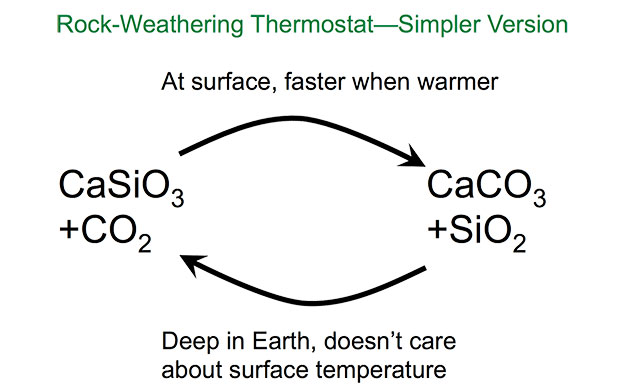
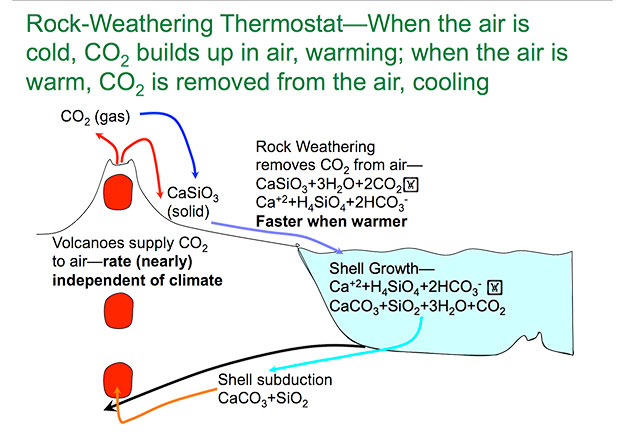
Rock-weathering Thermostat-When the air is cold, CO2 builds up in the air, warming; when the air is warm, CO2 is removed from the air, cooling. Volcanoes supply CO2 to air—rate is (nearly) independent of climate, and solid CaSiO3. Rock weathering remove CO2 from air— CaSiO3 + 3H2O+ 2 CO2 becomes Ca2+ +H4SiO4 +2HCO3- . This process works faster when it’s warmer. The products from the previous reaction fall into a body of water where shell growth occurs. The equation for this is Ca2+ +H4SiO4 + 2HCO3- becomes CaCO3 + SiO2 + 3H2O + CO2 . CaCO3 and SiO2 undergo shell subduction, which feeds back into the volcano. Other products are released into the ground
The Earth's climate is a complex system, and like most other complex systems, it is, partially controlled by many feedbacks. Feedbacks can affect many things. If we think about temperature, if a warming or cooling affects other processes that in turn change the temperature, those other processes are called feedbacks. A feedback that works against the initial temperature change to reduce its size is said to be stabilizing or negative; a feedback that increases the size of the initial change is amplifying or positive. The most important stabilizing feedbacks for Earth’s temperature are the almost instantaneous increase in radiation leaving the planet when the temperature rises, and the faster removal of carbon dioxide from warmer air to form shells and fossil fuels over hundreds of thousands of years.
At the in-between times, however, the most important feedbacks are positive. As a result, climate changes over years to millennia can be almost as large as changes over much longer times.
The most important of these positive feedbacks is warmer air picking up more water vapor from the ocean and plants, and carrying that vapor along, thus strengthening the greenhouse effect (or, colder air picking up less water vapor…).
Want to learn more?
Read the Enrichment titled Carbon Dioxide is more Important than Water Vapor as a Greenhouse Gas.
The air doesn’t know why it is warm, so anything that warms the air—brighter sun, or more greenhouse gas, or alien ray guns—will increase evaporation from the ocean, amplifying the warming.
Note that this does NOT mean that the warming “runs away” and the Earth burns up, but just that the total warming is made larger by the feedback. Suppose the sun becomes enough brighter to warm the planet by 1 degree, based on the simplest climate model in the Enrichment, which doesn’t include the water-vapor feedback. Including the effects of the extra water vapor would increase warming to almost 2 degrees.
Another important feedback is linked to snow and ice. Most surfaces (forests, grasslands, cities, oceans, even deserts) absorb most of the sunshine that reaches them, but snow and ice reflect most of the sunshine reaching them. Warming melts snow and ice, causing the Earth to absorb more sunshine, which causes more warming. This ice-albedo feedback is not nearly as strong as the water vapor feedback under modern Earth conditions, because most of the snow and ice occur in places and at times without a lot of sunshine (mostly in the winter, near the poles, and often under clouds that already are reflecting the sunshine; note that this feedback would be much more important if the temperature were cold enough for the ice to extend near the equator).
But, the water-vapor and ice-albedo feedbacks interact with each other. If the sun becomes brighter or carbon dioxide is increased by fossil-fuel burning, the resulting warming melts snow and ice and picks up more water vapor. Each of these causes more warming. But, the warming from the extra water vapor also melts some snow and ice, and the warming from loss of snow causes more water vapor to be picked up. Under modern Earth conditions, this still doesn’t “run away”, but it amplifies the warming still more. (The warming did “run away” on Venus, evaporating the oceans and causing the surface today to be hot enough to melt the metal lead; and such a fate awaits Earth most of a billion years in the future as the sun slowly brightens, although if we hang around and keep learning, we could “geoengineer” our way out of the problem, perhaps using techniques that will be discussed later in the course.)
The best current estimate is that, including changes in vegetation and clouds as well as snow and water vapor, doubling the concentration of carbon dioxide in the air and letting the climate come into balance will cause a warming of roughly 3°C, with fairly high confidence that the number is not less than 1.5°C or more than 4.5°C (or, a most-likely warming of 5.4°F, with the range of possibilities primarily between 2.7°F to 8.1°F). This number is usually called climate sensitivity and is widely discussed in climate science. Of the roughly 3°C warming from doubled CO2, the direct effect of the carbon dioxide on Earth’s radiation is just over 1°C (roughly 2°F), with the rest coming from the positive feedbacks. The stabilizing effect of warmer bodies radiating more energy is included here. Some additional amplifiers are omitted (melting of seasonal snow and sea ice are included, but not melting of the Greenland and Antarctic ice sheets, for example), so over many centuries or millennia, the warming may be somewhat larger than 3°C. The very slow stabilizers are also omitted, but they do not become important until even further into the future. Despite hopes that the climate sensitivity might be low, the most recent studies have made it less and less likely that sensitivity is as low as 1.5-2oC (2.7-3.6oF), with a value close to 3oC (5.4oF) looking fairly likely.
The Warming from the So-Far-Unavoidable Burning
The Warming from the So-Far-Unavoidable Burning
Short version: The Earth is warming, as shown by an interconnected web of evidence. The pattern of this warming, in space and time, matches that expected from the human-caused rise of greenhouse gases together with the other, less-important causes of climate change.
Friendlier, but longer version: We will follow the presentation of the United Nations Intergovernmental Panel on Climate Change (IPCC) here. The IPCC is the world’s effort to assess the available science. Researchers act for the public good, in the public eye, without being paid to do so, to tell policymakers and other people what is scientifically solid, speculative, or just silly by summarizing and assessing the relevant science.
If for some reason you don’t like the IPCC, you could check out other authoritative assessments, such as those done by the US National Academy of Sciences or the US Climate Change Science Program, or resources from the British Royal Society and others. But, for the world, the IPCC is an outstanding starting point. Dr. Alley did almost nothing for the Fifth Assessment Report or the IPCC released in 2013, but worked extensively on the Fourth Assessment Report in 2007, and contributed to the Third (2001) and Second (1995) Assessment Reports. The IPCC shared the Nobel Peace Prize after the Fourth Assessment Report.
Video: IPCC SPM1 (1:45)
History of the Most Important Greenhouse Gases (launch image in a new window) [3]
PRESENTER: This fascinating figure comes from the IPCC. It shows 10,000 years of history-- 10,000 years ago on your left, up to today in the big panels and then just since 1750 in the little panels in each case. And it shows it for carbon dioxide on the top, for methane in the middle, and for nitrous oxide on the bottom. These are the main greenhouse gases.
They're shown on the left in concentrations. This would be parts per million for CO2 and parts per billion for the methane and the nitrous oxide. And over on the other side, it shows radiative forcing. So this is a measure of how much the sun would have to get brighter to have as much warming affect as the greenhouse gases having. And you'll find that the radiative forcing is biggest for the CO2. That's a one up there-- one watt per square meter versus 240 from the sun-- smaller values for the other two.
These plots show ice core data from many different ice cores measured in different places by different labs and drilled in different places and so on, and then overlapping with the measurements that had been made in the atmosphere by modern instruments. You'll see, because there's so much agreement among the different cores and different labs and so much agreement with the instrumental record these are highly reliable. And what they show with very, very high confidence is that the greenhouse gas forcing, the greenhouse gases are rising. Other information shows that that rises very clearly from us.&
Official IPCC Caption: IPCC Figure SPM.1 Atmospheric concentrations of carbon dioxide, methane and nitrous oxide over the last 10,000 years (large panels) and since 1750 (inset panels). Measurements are shown from ice cores (symbols with different colours for different studies) and atmospheric samples (red lines). The corresponding radiative forcings are shown on the right hand axes of the large panels.
History of Carbon Dioxide
History of Carbon Dioxide
First, let’s start with Figure SPM-1 from the Fourth Assessment of the IPCC, showing the history of carbon dioxide and some other greenhouse gases over the last 10,000 years. Ice-core data from multiple cores and labs cover most of the history shown, and overlap with the recent instrumental record, all with very close agreement. The recent rise is unprecedented in the 10,000 years shown. Based on additional ice-core records not shown, the greenhouse-gas levels are now above anything seen in the last 800,000 years. And, data from other sources indicate that carbon dioxide has not been this high for millions of years. (Note that much further back in history, nature did cause higher CO2 levels, a topic to which we will return later.)
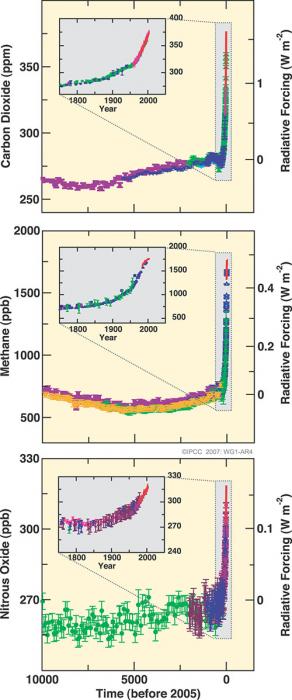
The figure shows “radiative forcing” as well as atmospheric concentration. The Earth absorbs 240 W/m2 from the sun. The extra warming from rising CO2 is somewhat similar, although not identical, to the warming from a brighter sun, so the effect of the CO2 can be discussed in W/m2. CBy January of 2017, atmospheric CO2 was at a concentration of 405 ppm, up from 280 ppm before the industrial revolution, with the extra CO2 giving a radiative forcing of roughly 2 W/m2, equivalent to the sun getting almost 1% brighter. The contributions from methane (from rice paddies, cow guts, and other sources) and nitrous oxide (especially produced by processes in soil stimulated by nitrogen fertilizers and animal waste) are significant but smaller.
The amount of extra CO2 now in the air, and moving into the ocean to make it more acidic, closely matches the CO2 we know has been produced from fossil-fuel burning. The human source is roughly 100 times as large as the natural volcanic source, and volcanoes have not done anything bizarre recently, so cannot be blamed for the recent rise. CO2 is moving into the ocean rather than coming out, so oceans cannot be responsible for the rise.
Furthermore, the atmosphere confirms that humans are responsible, as discussed in the ETOM film clip below and the Enrichment linked below.
Want to learn more?
Read the Enrichment titles Humans are Primarily Responsible for the Rise in CO2..
Earth: The Operators' Manual
Watch the short video below on how we know that the rise in CO2 is primarily from our fossil-fuel burning, filmed at the Rotorua Thermal area of New Zealand.
Video: It's Us (2:41)
So physics and chemistry tell us that adding carbon dioxide to the atmosphere warms things up. And Earth's climate history shows us there will be impacts, from melting ice sheets, to rising sea level. But how do we know, with equal certainty, that it's not just more natural variation, that humans are the source of the increasing CO2? When we look at a landscape like this one we know immediately that volcanoes put out all sorts of interesting things. And that includes CO2.
So how do we know that the rise of CO2 in the atmosphere that we see, comes from our burning of fossil fuels, and not from something that the volcanoes have done? Well, the first step in the problem is just bookkeeping. We measure how much CO2 comes out of the volcanoes. We measure how much CO2 comes out of our smokestacks and tail-pipes. The natural source is small. Humans are putting out 50 to a 100 times more CO2 than the natural volcanic source. We can then ask the air whether our bookkeeping is right, and the air says that it is. Volcanoes make CO2 by melting rocks to release the CO2. They don't burn and they don't use oxygen. But burning fossil fuels does use oxygen when it makes CO2. We see that the rise in CO2 goes with a fall of oxygen, which says that the rising CO2 comes from burning something.
We can then ask the carbon in the rising CO2 where it came from. Carbon comes in 3 flavors: the lightweight carbon 12, which is especially common in plants. The medium-weight carbon 13, which is a little more common in the gases coming out of volcanoes. And the heavyweight carbon 14. It's radioactive and decays almost entirely after about 50,000 years, which is why you won't find it in very old things like dinosaur bones or fossil fuels. We see a rise in carbon 12, which comes from plants. We don't see a rise of carbon 13, so the CO2 isn't coming from the volcanoes. And we don't see a rise in carbon 14, so the CO2 can't be coming from recently-living plants. And so the atmosphere says that the rising CO2 comes from burning of plants that have been dead a long time... That is fossil fuels. The CO2 is coming from our fossil fuels. It's us.
So, yes, humans are increasing the greenhouse effect, primarily by producing CO2 by burning fossil fuels, with very little uncertainty.
Natural and Anthropogenic Warming
Natural and Anthropogenic Warming
VIdeo: SPM2 (2:20)
Natural and Anthropogenic Warming (launch image in a new window [4])
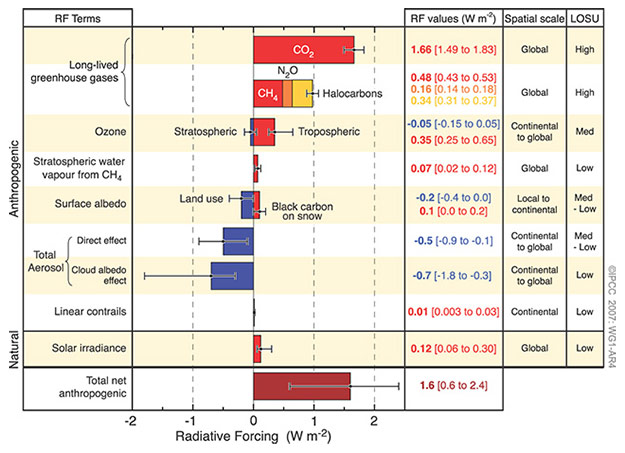
PRESENTER: This fascinating figure is from the IPCC. There's a lot of information on here. It includes the things that are changing-- radiative forcing-- or changing the climate, how much they're doing so, including the uncertainties, whether they expect the whole globe or just part of it, and the level of scientific understanding.
If we do a lot more research-- the low it probably will reduce the size of the uncertainties-- because we can learn more. But how much we understand is included in the uncertainty already. And it includes both the things that humans have done and the things the nature has done. And this goes from the year 1750 up to the year 2005.
The Biggie is our C02, together, with the other greenhouse gases that we put up, as well as the ozone that comes from human activities from pollution. So these all have a warming influence and they are pushing very strongly towards warming. Clearly, there's a couple of other little warming influences, especially us putting soot on top of snow. But there's also these cooling influences.
We've put up a lot of particles, aerosols that block the sun, and they make clouds last longer and make clouds more reflective. And together, those have a lot of cooling. And we've cut dark forests and replaced them by more reflective grasslands.
In addition, since 1750 the sun has brightened a little bit. Over the last 30 years or so, it's actually dimmed, but there's a little bit of that. Add all of these together and there's very clearly a warming influence. And the total warming influences is very similar in size to the CO2 that we've put up.
Taken together, we are pushing the world in a lot of different ways. But because of these cooling influences, if you ask how much of the warming has been caused by our greenhouse gases, the answer is more than all of it. Because it is warm despite these cooling influences.
Official IPCC Caption: IPCC Figure SPM.2 Global average radiative forcing (RF) estimates and ranges in 2005 for anthropogenic carbon dioxide (CO2 ), methane (CH4 ), nitrous oxide (N2O) and other important agents and mechanisms, together with the typical geographical extent (spatial scale) of the forcing and the assessed level of scientific understanding (LOSU). The net anthropogenic radiative forcing and its range are also shown. These require summing asymmetric uncertainty estimates from the component terms, and cannot be obtained by simple addition. Additional forcing factors not included here are considered to have a very low LOSU. Volcanic aerosols contribute an additional natural forcing but are not included in this figure due to their episodic nature. The range for linear contrails does not include other possible effects of aviation on cloudiness.
Greenhouse gases are not the only things that affect climate. But, climate changes have causes; there are no magical “cycles” that somehow change the climate without letting us know why. (There are cycles that affect climate, but they have causes, such as features of Earth’s orbit, that we understand; they are NOT magical!) So, we can assess what things are affecting the climate.
More than a century ago, the Earth was a little on the cold side in what is sometimes called the “Little Ice Age”, because the sun was a bit dim and volcanic eruptions were putting up dust that blocked the sun. The sun brightened early in the 20th century, contributing to warming, as shown by the little red bar extending to the right for natural solar irradiance down near the bottom of the figure. But, over the last 30 years when satellites have given us the best data, the sun seems to have dimmed just a bit. We humans have cut dark forests and replaced them with more-reflective grasslands, cooling the Earth a little, and we have put up a lot of particles to block the sun, with notable cooling influence (you can find blue bars for these, extending to the left, in the figure).
You may meet someone who agrees that the Earth is warming, but argues that much of the change is natural. This is wrong; over the last few decades, warming has occurred despite nature pushing a little toward cooling, and human particles and land-use changes pushing more strongly toward cooling. The most likely answer for how much of the warming has been caused by our greenhouse gases is “More than all of it”, because of warming despite these other cooling influences.
Video: SPM 3 (1:07)
Temperatures, Sea Level and Snow Cover (launch image in a new window [5])
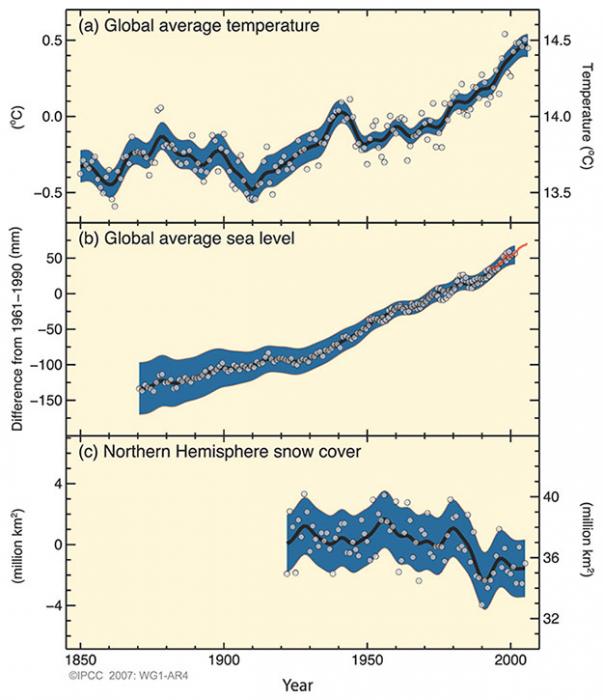
PRESENTER: This figure from the IPCC starts back in 1850 and then runs up to just pass 2000 up here on the right. And it shows indications of warming happening in the climate system. You can see on top here the thermometer record of global average temperature showing not much happening and then recent warming, very clearly.
Sea level, which is given here, rises because ocean water expands as it warms and because warming tends to melt glaciers that are holding water out of the ocean. And so we see a warming influence that shows up in the rising global sea level.
And we also look, if you go to bring time snow cover, you can see that not much was happening. And then you can see it dropping, and that's happening because of warming and the spring is melting the snow. And so these are among many indicators that are showing that yes, the climate system is warming.
Official IPCC Caption: IPCC Figure SPM.3 Observed changes in (a) global average surface temperature, (b) global average sea level from tide gauge (blue) and satellite (red) data and (c) Northern Hemisphere snow cover for March-April. All changes are relative to corresponding averages for the period 1961–1990. Smoothed curves represent decadal average values, while circles show yearly values. The shaded areas are the uncertainty intervals estimated from a comprehensive analysis of known uncertainties (a and b) and from the time series (c).
The temperature is going up. The figure shows a few of the indicators, but many more are known. Consider the next figure, for example.
Video: Surface Temperatures (1:38)
Decadal Land-Surface Average Temperature (launch image in a new window [6])
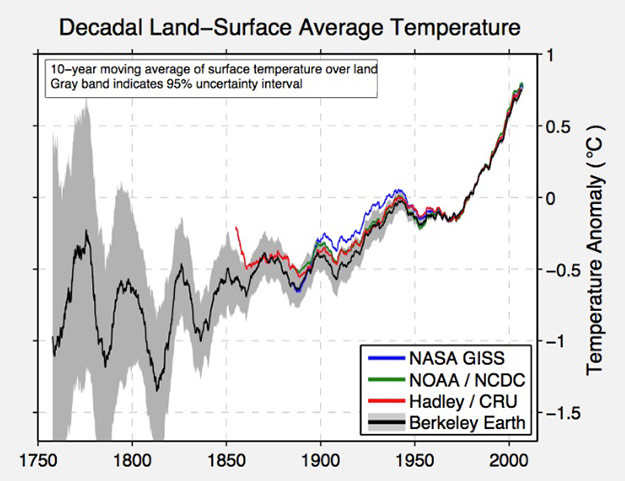
PRESENTER: This figure is from the Berkeley Earth Project. It was run primarily by physicists who did not start out as climate scientists-- with an interesting mix of funding from public sources. But also some of it came from private sources, including those with ties to the fossil fuel industry.
It's looking at the thermometer record of temperature, and just looking at the land. Now if you go back to 1750 up through about 1850, you could see that the uncertainties are really huge. So we're mostly going to focus since 1850.
Many groups have been estimating the temperature, including NASA-- the Goddard Institute for Space Studies, NOAA-- the National Climate Data Center, the British Group, the Hadley Centre, and the Climate Research Unit. And what you can see is those, plus the Berkeley Earth estimates up here on top. And what you'll notice is that the uncertainties in the Berkeley Earth are similar to the differences between the others, which also have their own uncertainties. But you'll see very clearly that there is a strong warming going on.
The different groups have used different techniques. Although, ultimately, they're all using thermometers. Whether they use them all or not this is different for the different ones. But when you have different groups with different funding, different motivations, perhaps, and some working in different places, they all give the same answer. Which is, it's getting warmer. We have very high confidence that it is warming.
The Berkeley Earth project is an interesting attempt by a group involving a lot of physicists who were not primarily climate scientists through much of their careers, to use private as well as public funding to re-calculate the temperature record from thermometers. The Berkeley work follows efforts by NOAA and by NASA in the US, and by a British group at the Hadley Center and the University of East Anglia, and other efforts by others, to calculate global temperature changes from thermometer records. You can see clearly in the figure that over recent decades when the data are best, the different groups get the same answer despite having different funding sources and different techniques. The temperature is going up.
Furthermore, if you throw away the records from thermometers in and near the cities and just look in the country, you see warming. Thermometers in boreholes in the ground show warming. Thermometers taken aloft by balloons (radiosondes), and thermometers looking down from satellites and analyzed in different ways, show warming. So do thermometers in the ocean.
The temperature-sensitive snow and ice also show warming. You would not go searching for this effect in the coldest places; if you start off at -40 and warm by a couple of degrees, the snow and ice won’t melt yet. But, the effects of warming are seen in loss around the edges, in space and time, of seasonal snow cover, river, and lake ice, seasonally and perennially frozen ground, mountain glaciers and more. The melting of land ice and the expansion of ocean water as it warms are driving the rise in global sea level. And, the great majority of significant changes in where plants and animals live, and when they do things during the year, are in the direction of warming. So, warming is occurring, despite natural and human pushes toward cooling over recent decades.
Want to learn more?
Read the Enrichment titled Global Warming Did Not Stop Recently.
We are once again taking a look at the CO2 and the Atmosphere clip. To see a little on the melting of ice, watch 7:22 - 9:04.
Earth: The Operator's Manual
Video: CO2 and the Atmosphere (9:04)
What CO2 does was confirmed by basic research that had absolutely nothing to do with climate change. (newsreel announcer) A continuance of the upper air program will provide scientific data concerning the physics of the upper atmosphere. (Richard Alley) World War II was over, but the Cold War had begun. The U.S. Air Force needed to understand the atmosphere for communications and to design heat-seeking missiles.
At certain wavelengths carbon dioxide and water vapor block radiation. So the new missiles couldn't see very far if they used a wavelength that CO2 absorbs. Research at the Air Force Geophysics Laboratory in Hanscom, Massachusetts produced an immense database with careful measurements of atmospheric gases. Further research by others applied and extended those discoveries, clearly showing the heat-trapping influence of CO2. The Air Force hadn't set out to study global warming, they just wanted their missiles to work. But physics is physics. The atmosphere doesn't care if you're studying it for warring or warming. Adding CO2 turns up the planet's thermostat. It works the other way as well. Remove CO2 and things cool down. These are the Southern Alps of New Zealand, and their climate history shows that the physicists really got it right. These deep, thick piles of frozen water are glaciers, slow-moving rivers of ice, sitting on land... But once, when temperatures were warmer, they were liquid water, stored in the sea. We're going to follow this one, the Franz Josef, from the summit to the ocean to see the real-world impact of changing levels of CO2.
It's beautiful up here on the highest snowfield, but dangers lurk beneath the surface. I've spent a lot of time on the ice. It's standard practice up here to travel in pairs, roped up for safety. The glacier is fed by something like six meters of water a year... maybe 20 meters, 60 feet of snowfall... it's a really seriously high snowfall. The snow and ice spread under their own weight and is headed downhill at something like a kilometer a year. When ice is speeding up a lot as it flows towards the coast it can crack and open great crevasses that give you a view into the guts of the glacier. Man, this is a big one... Ten... Twenty... Thirty meters more... a hundred feet or more heading down in here, and we can see a whole lot of the structure of the glacier right here.
(man) So, what we're going to do is just gonna sit on the edge and then walk backwards, and I'll lower you. Tell me when. Okay, rolling around, and down we go. Snowfall arrives in layers, each storm putting one down... Summer sun heats the snow, and makes it look a little bit different than the winter snow, and so you build up a history. In these layers there's indications of climate, how much it snowed, what the temperature was. And all of this is being buried by more snow and the weight of that snow squeezes what's beneath it, and turns it to ice. And in doing that, it can trap bubbles. And in those bubbles are samples of old air, a record of the composition of the Earth's atmosphere, including how much CO2 was in it, a record of the temperature on the ice sheets, and how much it snowed. As we'll see, we can open those icy bottles of ancient air, and study the history of Earth's atmosphere.
This landscape also tells the story of the Ice Ages. And the forces that have shaped Earth's climate. Over the last millions of years the brightness of the sun doesn't seem to have changed much, but the Earth's orbit and the tilt of its axis have shifted in regular patterns over tens and hundreds of thousands of years. The orbit changes shape... varying how close and far the Earth gets as it orbits the sun each year.
Over 41,000 years, the tilt of Earth's axis gets larger and smaller, shifting some of the sunshine from the equator to the poles and back. And our planet has a slight wobble, like a child's top, altering which hemisphere is most directly pointed toward the sun when Earth is closest to it. Over tens of thousands of years, these natural variations shift sunlight around on the planet, and that influences climate. More than 20,000 years ago, decreasing amounts of sunshine in the Arctic allowed great ice sheets to grow across North America and Eurasia, reaching the modern sites of New York and Chicago. Sea level fell as water was locked up on land. Changing currents let the oceans absorb CO2 from the air. That cooled the southern hemisphere, and unleashed the immense power of glaciers such as the Franz Josef, which advanced down this wide valley, filling it with deep, thick ice. Now we're flying over today's coastline, where giant boulders are leftovers from that last ice age.
A glacier is a great earthmoving machine. It's a dump truck that carries rocks that fall on top of it. It's a bulldozer that pushes rocks in front of it. And it outlines itself with those rocks making a deposit that we call a moraine, that tells us where the glacier has been. We're 20 kilometers, 12 miles, from the front of the Franz Josef glacier today, but about 20,000 years ago, the ice was depositing these rocks as it flowed past us and out to sea. The rocks we can still see today confirm where the glacier once was. Now, in a computer-generated time-lapse condensing thousands of years of Earth's history... we're seeing what happened. Lower CO2, colder temperatures, more snow and ice, and the Franz Josef advanced.
Twenty thousand years ago, 30% of today's land area was covered by great ice sheets, which locked up so much water that the global sea level was almost 400 feet lower than today. Then, as Earth's orbit changed, temperatures and CO2 rose, and the glacier melted back. The orbits set the stage, but by themselves they weren't enough. We need the warming and cooling effects of rising and falling CO2 to explain the changes we know happened.
Today, atmospheric CO2 is increasing still more, temperatures are rising, and glaciers and ice sheets are melting. You can see this clearly on the lake formed by the shrinking Tasman Glacier, across the range from the Franz Josef. This is what the end of an ice age looks like. Glaciers falling apart, new lakes, new land, icebergs coming off the front of the ice. In the early 1980s, we would have been inside New Zealand's Tasman Glacier right here. Now we're passing icebergs in a new lake from a glacier that has mostly fallen apart and ends over six kilometers, four miles away.
One glacier doesn't tell us what the world is doing, but while the Tasman has been retreating, the great majority of glaciers on the planet have gotten smaller. This is the Columbia Glacier in Alaska. It's a type of glacier that makes the effects of warming easy to see. It's been retreating so fast that the Extreme Ice Survey had to reposition their time-lapse cameras to follow its motion. In Iceland, warming air temperatures have made this glacier simply melt away, leaving streams and small lakes behind. Thermometers in the air show warming, thermometers in the air far from cities, show warming.
Put your thermometer in the ground, in the ocean, look down from satellites, they show warming. The evidence is clear. The earth's climate is warming.
For recent updates on temperature, see NASA’s Goddard Institute for Space Studies (GISTEMP). [10]
Models Using Natural and Anthropogenic Forcings
Models Using Natural and Anthropogenic Forcings
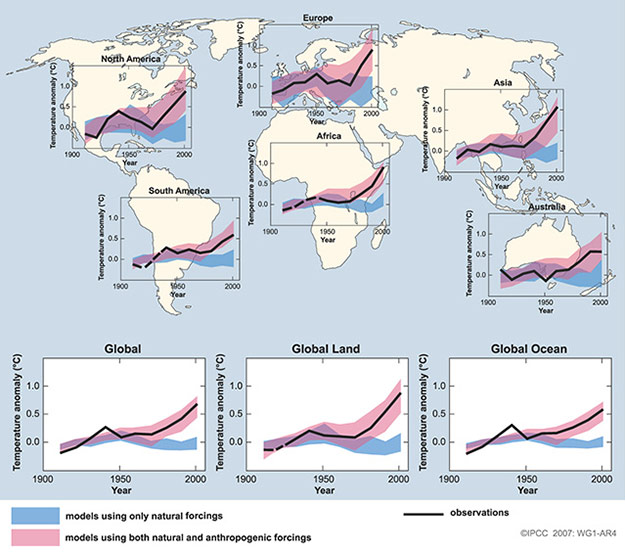
Nature surely has changed the climate in the past, is contributing to climate change now, and will contribute to climate change in the future. In the figure below, models have been used to see what nature has done, compared to what humans have done. In each case, the black line shows the actual history of temperature. The blue bands, which end up below the black line recently on each plot, show the influence of changing sun and volcanoes; a band is plotted, rather than a line, to show the uncertainties in estimating the sun's and volcanic influences and turning them into temperature changes using models. The pink bands, which so nicely match the black lines showing what really happened, were calculated including the effects of natural changes plus the human causes, including both warming and cooling influences.
Video: SPM 4 (2:09)
Models Using Natural and Anthropogenic Forcings (launch image in a new window [11])
PRESENTER: This wonderful figure from the IPCC is looking at the fingerprint of climate change. All of the different plots go from just more recently than 1900 up to 2000. That was the time that they could do best for this.
And in each plot, the black line is the history of temperature. This is for the globe, this would the globe's land, the globe's ocean, and then continent by continent up here, like Asia and Europe, and so on. So in each case, the black is what happened.
The blue models have been taken, and they've been told what nature did. What the sun was doing, what the volcanoes were doing. And the models then said this is the climate change that nature has caused.
In the pink, in each case, the model has been told what nature did, and what humans did. And what you will see, if you start down here, for example, with the global land, is that the warming back here is possibly caused by nature. The sun got a little bit brighter, and coincidentally, the volcanoes quit blocking the sun quite as much as they had done earlier. But recently, the dimming of the sun and some big volcanoes have tried to cool it off. Yet the temperature went up.
And so what you can see in every one of these panels is that you can explain the climate changes that were happening early in the 20th century by natural causes because the human causes were not terribly large. But by the time you get to the later 20th century, if anything, nature tried to cool it off a little bit, yet the temperature went up. And so what we see across the globe, from Australia to North America, is that the fingerprint of climate change is now that of humans, not that of nature. Other fingerprinting exercises give the same answer, which is that we have taken over from nature in controlling climate change.
Official IPCC Caption: IPCC Figure SPM.4 Comparison of observed continental- and global-scale changes in surface temperature with results simulated by climate models using natural and anthropogenic forcings. Decadal averages of observations are shown for the period 1906 to 2005 (black line) plotted against the center of the decade and relative to the corresponding average for 1901–1950. Lines are dashed where spatial coverage is less than 50%. Blue shaded bands show the 5–95% range for 19 simulations from five climate models using only the natural forcings due to solar activity and volcanoes. Red shaded bands show the 5–95% range for 58 simulations from 14 climate models using both natural and anthropogenic forcings.
Activate Your Learning
According to the model data shown in the IPCC figure above (SPM-4), can recent warming trends be explained by natural variability in factors beyond our control, such as solar activity and volcanoes? Imagine you are talking to a friend or relative who is not familiar with these models or is unclear on how to interpret them. Try your best to explain what the models show about recent climate change in your own words.
Click for answer.
Note that there are other lines of evidence confirming the relative significance of human influence suggested in the figure above. Suppose for a moment that you decide the satellite data are wrong, and the sun is really getting brighter. (This is not a sensible thing to do, but just suppose…) If this were correct, we know that more energy from the sun will warm the air near the Earth’s surface, but also will warm the air high in the stratosphere. Rising CO2 also warms the air near the surface, but rising CO2 cools the upper stratosphere. (Ultraviolet radiation heats the ozone there, which transfers energy to CO2 in collisions, and the CO2 then radiates the energy to space, so in the presence of much ozone high in the atmosphere where infrared radiation to space is easy, extra CO2 acts as a radiator and causes cooling of the adjacent air.) The observed pattern of changes—warming near the surface but cooling in the upper stratosphere—has the fingerprints of CO2, not the sun or other possible causes of climate change. Other fingerprinting exercises reach the same conclusion.
Taking all of this together, we now have very high scientific confidence that we humans are changing the composition of the atmosphere, primarily through the burning of fossil fuels, and that the rising concentration of important gases is causing warming. Feedbacks in the Earth system modify the initial warming and are acting to amplify the direct effects of our CO2 and increase the warming. The Earth is warming, based on a great range of independent data sets. This warming is occurring despite natural and human-caused cooling influences, and this warming has the pattern in space and time expected from our greenhouse gases plus the other influences on climate. The close agreement between what is happening, and what we expect to happen from our understanding of the climate system, confirms the science. And, because we are fairly confident that much more fossil fuel remains to be burned than we have burned already, the well-confirmed scientific understanding says that coming climate changes will be much bigger than those we have caused so far if we continue on the path we are now following. What that means is coming in the next module.
Summative Assessment
Reminder!
After completing your Summative Assessment, don't forget to take the Module 4 Quiz. If you didn't answer the Learning Checkpoint questions, take a few minutes to complete them now. They will help your study for the quiz and you may even see a few of those question on the quiz!Climate Modeling Activity
In this activity, we’ll explore some relatively simple aspects of Earth’s climate system, through the use of several STELLA models — you’ve seen some of these in the Module 3 activity. STELLA models are simple computer models that are ideal for learning about the dynamics of systems — how systems change over time. The question of how Earth’s climate system changes over time is of huge importance to all of us, and we’ll make progress towards understanding the dynamics of this system through experimentation with these models. In a sense you could say that we are playing with these models, and watching how they react to changes; these observations will form the basis of a growing understanding of system dynamics that will then help us understand the dynamics of Earth’s real climate system.
If you pause for just a moment and think about what we are doing in these activities, it is really just an application of the scientific method. We start with a question, develop a hypothesis, devise and carry out an experiment to test the hypothesis or answer the question, and then study the results to see if they provide an answer to our original question. So, we are learning through experimentation. In this Summative Assessment, we will work through a series of four experiments designed to test the influence of various forcings on climate.
Instructions
This assessment is broken into four experiments with questions related to each one. Separate web pages have been provided for each experiment to reduce scrolling. We have also provided the activity as a worksheet that you can download and even print if you prefer. You may find downloading or printing the complete worksheet easier to work with as you prepare your answers to submit them. As before, there is a practice version, and then a graded version — each version has its own set of model values that are provided in the worksheet.
Files to Download
Download the worksheet [12]. Completing the 'Practice' and 'Graded' versions of the exercise, in the following pages or on the attached worksheet, is required before submitting your assignment.
Submitting Your Assessment
Work through the practice version first, then write down your answers for the graded version on the worksheet. Once you have answered all of the questions on the worksheet, go to Module 4 Summative Assessment: Graded. The questions listed in the worksheet will be repeated as an Canvas Assessment. So all you will have to do is read the question and select the answer that you have on your worksheet. You should not need much time to submit your answers since all of the work should be done prior to launching the assessment quiz.
Grading and Rubric
This assignment is worth a total of 17 points. The grading of the questions and problems is below:
| Item | Possible Points |
|---|---|
| Questions 1-14 | 1 point each |
| Question 15 | 3 points |
Introduction to a Simple Planetary Climate Model
Introduction to a Simple Planetary Climate Model
Our first climate model calculates how much energy is received and emitted (given off) by our planet, and how the average temperature relates to the amount of thermal energy stored. The complete model is shown below, with three different sectors of the model highlighted in color:

First, let’s define a few terms that you might not be familiar with.
Insolation —stands for Incoming Solar Radiation, which is a fancy way of saying sunlight or solar energy.
Albedo — the fraction of light reflected from some material; 0 would be a perfectly black object (no reflected light) and 1 would be a perfectly white object (no light absorbed).
Heat capacity — this is the amount of energy (units are Joules) needed to raise 1 kilogram of some material 1°C.
Ocean Depth — this is the depth of the part of the ocean that is involved in climate over short time scales of decades, the part of the ocean exchanges energy with the atmosphere. While the whole ocean has an average depth of ~4000 m, the part we worry about here has a depth of less than 500 m.
LW Int and LW slope — these are parameters used to describe the relationship between the average planetary temperature and the amount of long-wavelength (infrared, or thermal) energy emitted by the planet; more details are provided below.
The Energy In Sector
The Energy In Sector
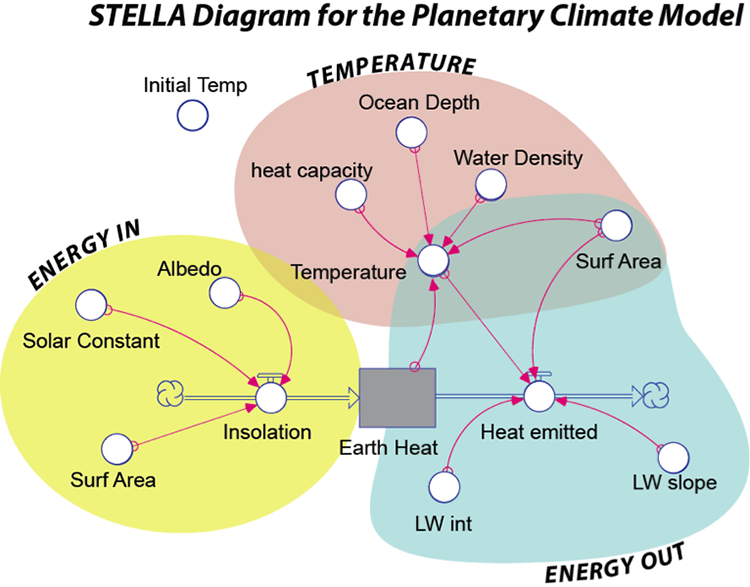
The Energy In sector (yellow in Fig. 1 above) controls the amount of insolation absorbed by the planet. The Solar Constant is not really a constant, but it does tend to stay close to a value of 343 Watts/m2 (think of about six 60 Watt light bulbs shining down on a patch of ground 1 meter on a side — this is what we get from the Sun). This is then multiplied by (1 – albedo) and then the surface area of the Earth giving a result in Watts (which is a measure of energy flow and is equal to Joules per second). In the form of an equation, this is:
S is the Solar Constant (343 W/m2), A is surface area, and α is the albedo (0.3 for Earth as a whole).
This is the equation Ein=S×A×(1-α)
The Energy Out Sector
The Energy Out Sector
The Energy Out sector (blue above) of the model controls the amount of energy emitted by the Earth in the form of infrared (thermal) radiation, which is a form of electromagnetic radiation with a wavelength longer than visible light, but shorter than microwaves. You saw earlier that this is often described using the Stefan-Boltzmann Law which says that the energy emitted is equal to the surface area times the emissivity times the Stefan-Boltzmann constant times the temperature raised to the fourth power:
A is the whole surface area of the Earth (units are m2), ε is the emissivity (a number between 0 and 1 with no units), σ is the Stefan-Boltzmann constant (units are W/m2 per °K4), and T is the temperature of the Earth (in °K). The problem with this approach is that it ignores the greenhouse effect, which is a very important part of our climate system. We could represent the greenhouse effect by choosing the right value for the emissivity in the Stefan-Boltzman law, but here, we will use a different approach, one in which Eout is based on actual observations. With a satellite above the atmosphere, we can measure the amount of energy emitted in different places on Earth and figure out how it relates to the surface temperature. As it turns out, this is a pretty simple relationship, described by a line:
Eout=(〖LW〗_int+〖LW〗_s×T)×A
The part inside the parentheses is just the equation for a line, with an intercept (LWint with units of W/m2) and a slope (LWs with units of W/m2 per °C). This new way of describing Eout is shown as the red line in the figure below:
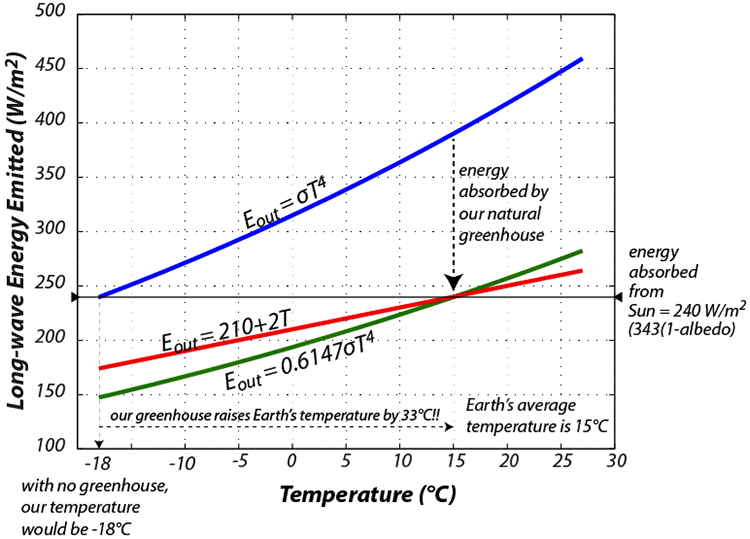
The key thing here is that the hotter something is, the more energy it gives off, which tends to cool it and it will continue to cool until the energy it gives off is equal to the energy it receives — this represents a negative feedback mechanism that tends to lead to a steady temperature, where Ein = Eout.
The Temperature Sector
The Temperature Sector
The Temperature sector (brown in Fig. 1) of the model establishes the temperature of the Earth’s surface based on the amount of thermal energy stored in the Earth’s surface. In order to figure out the temperature of something given the amount of thermal energy contained in that object, we have to divide that thermal energy by the product of the mass of the object times the heat capacity of the object. Here is how it looks in the form of an equation: (see directions for how view images in a larger format [13])
Let’s look at it with just the units, to make sure that things cancel out:
This can be simplified by combining, rearranging, and canceling to give:
Here, E is the thermal energy stored in Earth’s surface [Joules], A is the surface area of the Earth [m2], d is the depth of the oceans involved in short-term climate change [m], ρ is the density of seawater [kg/m3] and Cp is the heat capacity of water [Joules/kg°K]. We assume water to be the main material absorbing, storing, and giving off energy in the climate system since most of Earth’s surface is covered by the oceans. The terms in the denominator of the above fraction will all remain constant during the model’s run through time — they are set at the beginning of the model and can be altered from one run to the next. This means that the only reason the temperature changes is because the energy stored changes.
Other parts of the model
Other Parts of the Model
The model has a few other parts to it, including the initial temperature of the Earth, which determines how much thermal energy is stored in the earth at the beginning of the model run. It also includes some other features that allow you to change the solar input and the part of the greenhouse effect due to CO2. We use the standard assumption (which is itself based on some physics calculations) that for each doubling of the CO2 concentration, there is an increase of 4 W/m2 in the greenhouse effect. This is often called the greenhouse forcing due to CO2. In terms of our Eout curve shown in Figure 2 above, this shifts the red curve downwards — so less energy is emitted, and thus more is retained by the Earth. Let’s consider how this works — if we start with 200 ppm of CO2 and increase it to 800 ppm, that represents 2 doublings (from 200 to 400 and then from 400 to 800), so we would get 8 W/m2 of greenhouse forcing.
One unit of time in this model is equal to a year, but the program will actually calculate the energy flows and the temperature every 0.1 years.
Now that you have seen how the model is constructed, let’s explore it by doing some experiments. Here is the link to the model [14].
Experiment 1: Steady State
Experiment 1: Steady State
One of the most important components of this climate system is the relationship between temperature and the energy emitted by the planet (Fig. 2), which constitutes a negative feedback mechanism. Negative feedback mechanisms are like thermostats that act to control the temperature and maintain a steady state. In this experiment, we see if that expectation is met by our model.
What happens if we start out with an Earth that is not in a steady state so that Ein≠Eout? Use the slider controls at the top to set the initial conditions specified in the assessment.
| Practice | Graded | |
|---|---|---|
| Albedo | 0.3 | 0.31 |
| CO2 Mult | 1.0 | 1.0 |
| Solar Mult | 1.0 | 1.0 |
| Initial T | 20°C for #1,2, (10°C for #3) | 5°C for #1,2, (25°C for #3) |
Questions
1. What will happen? How will the temperature change over time? Think about how the Ein and Eout will compare at the beginning.
- Eout > Ein — this will cause warming
- Eout > Ein — this will cause cooling
- Eout < Ein — this will cause warming
- Eout < Ein — this will cause cooling
- Eout = Ein — temperature will remain constant
2. Now, run the model and see what happens. What is the temperature at the end of the model run (to the nearest 0.1 °C)?
Ending Temperature =
3. Now change the initial temperature to second value as prescribed above, run the model and see what happens. Compared to the answer to #2, is the ending temperature the same (within 0.1 °C) or different (varies by more than 0.1°C)?
- Same
- Warmer
- Cooler
4. Steady state for a system is the condition in which the system components are not changing in value over time even though time is running and things are moving through the system. What is the steady state temperature of your system?
Steady State Temperature =
Be sure to reset everything in the model before going to the next problem.
Hit the refresh button on your browser or the rest button on the model.
Experiment 2: A Fluctuating Sun
Experiment 2: A Fluctuating Sun
The Solar Constant is not really constant over any length of time. For instance, it was only 70% as bright early in Earth’s history, and it undergoes much more rapid fluctuations (and much smaller) in association with the 11-year sunspot cycle. During a sunspot cycle, the solar constant may vary by as much as 0.3 W/m2. Let’s see what this would do to the temperature of the planet. The model has a small switch called the Solar Cycle Switch that we can use to turn on or off the effects of the solar cycle. Set the model up with the following parameters:
| Practice | Graded | |
|---|---|---|
| Albedo | 0.30 | 0.30 |
| CO2 Mult | 1.0 | 1.0 |
| Solar Mult | 1.0 | 1.0 |
| Initial T | +15 | +15 |
| Ocean depth | 100 for #5,6, (200 for #7) | 150 for #5,6, (50 for #7) |
Questions
5. Run the model and see what happens. How much does the planetary temperature change over the solar cycle (the difference between peak and trough — measure this after the third peak)?
Change in temperature in one cycle =
6. Notice that the temperature peaks after the Solar Input peaks. This time delay is called lag time. What is the lag time here in years?
Lag Time =
7. Predict how the model will change if you increase the ocean depth to the second specified depth (table above). How do you think the lag time and the magnitude of temperature will change relative to the first solar cycle model (#5,6)? In other words, make a prediction. It might help to think about what heats up faster — a pot with a little water in it, or the same pot with a lot of water in it?
- Lag time shorter, magnitude smaller
- Lag time shorter, magnitude greater
- Lag time longer, magnitude smaller
- Lag time longer, magnitude greater
Be sure to reset everything in the model before going to the next problem.
Experiment 3: Changing CO2
Experiment 3: Changing CO2
Let’s see what happens when we change the concentration of CO2 in the atmosphere.
| Practice | Graded | |
|---|---|---|
| Albedo | 0.3 | 0.30 |
| CO2 Mult | 0.5 | 2.0 |
| Solar Mult | 1.0 | 1.0 |
| Initial T | 15°C | 15°C |
| Ocean Depth | 100 | 50 |
First, try to predict what will happen. How much warming or cooling will occur? Will the temperature level off, or rise/fall forever? Then run the model.
Questions
8. You’ve changed the atmospheric CO2 concentration from its original value of 380 ppm by multiplying it by a specified value (table above). What is the resulting atmospheric CO2 concentration in your model?
New CO2 concentration =
9. What is the resulting temperature change at the end (50 yrs)? (±0.1 °C)
Change in temperature =
11. Notice that the temperature levels off at the end — it finds a new steady state. How long does it take to level off? Let’s find the response time, which is defined as the time required to accomplish 2/3 of the total temperature change. For example, if the temperature change was 1°C and it started at 15°, then we would find the time when the temperature reached 15.67°C — this would be the response time.
Find the response time for this case. (±.5 yrs)
Response Time =
Experiment 4. Causes of Climate Change
Experiment 4 - Causes of Climate Change
Things that can cause the climate to change are sometimes called climate forcings, and we’ve just tinkered with two of these — the Sun, and CO2. It is generally agreed upon that on relatively short timescales like the last 1000 years, there are 4 main forcings — solar variability, volcanic eruptions (whose erupted particles and gases block sunlight), aerosols (tiny particles suspended in the air) from pollution, and greenhouse gases (CO2 is the main one). Solar variability and volcanic eruptions are obviously natural climate forcings, while aerosols and greenhouse gases are anthropogenic, meaning they are related to human activities. The history of these forcings is shown in the figure below.
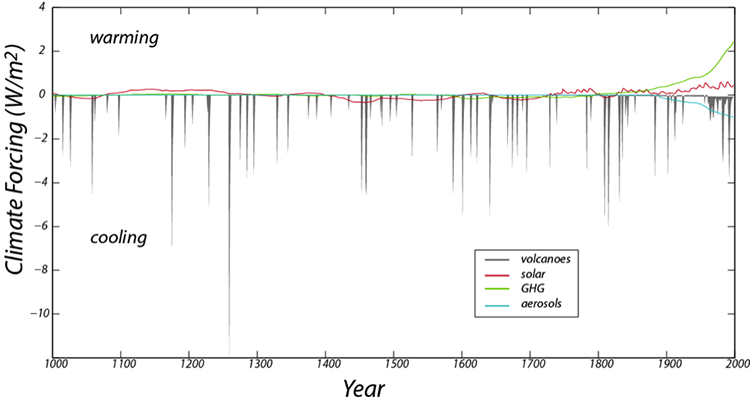
Volcanoes, by spewing ash and sulfate particles into the atmosphere block sunlight and thus have a cooling effect. This history is based on the human records of eruptions in recent times and ash deposits preserved in ice cores and sediment cores for older times; it is best during the historical period. Note that although the volcanoes have a strong cooling effect, the history consists of very brief events. The solar variability comes from actual measurements in recent times and further back in time, on the abundance of an isotope of Beryllium, whose production in the atmosphere is a function of solar intensity. The greenhouse gas forcing record is based on actual measurements in recent times and ice core records further in the past (the ice contains tiny bubbles that trap samples of the atmosphere from the time the snow fell). The aerosol record is based entirely on historical observations and is 0 earlier in time, before we began to burn wood and coal on a large scale.
In this experiment, we will add the history of these forcings over the last 1000 years and see how our climate system responds, comparing the model temperature with the best estimates for what the temperature actually was over that time period. Solar variability, volcanic eruptions, and aerosols all change the Ein or Insolation part of the model, while the greenhouse gas forcing change the Eout part of the model. We can turn the forcings on and off by flicking some switches, and thus get a clear sense of what each of them does and which of them is the most important at various points in time.
We can compare the model temperature history with the reconstructed temperature history for this time period, which comes from a combination of thermometer measurements in recent times and temperature proxy data for the earlier part of the history (these are data from tree rings, corals, stalactites, and ice cores, all of which provide an indirect measure of temperature).
First, open the model [15] with the forcings built in, and study the Model Diagram to get a sense of how the forcings are applied to the model. If you run the model with all of the switches in the off position, you will see our familiar steady state model temperature of 15°C over the whole length of time. The model time goes from 0 to 998 years, but in reality, this is meant to be the year 1000 to 1998 (it ends in 1998, because the forcings are from a paper published in 2000).
| Practice | Graded | |
|---|---|---|
| Ocean Depth | 100 | 300 |
Questions
11. Use the switches to examine the effect of each of the 4 forcings separately (only 1 switch on at a time), and observe how well the model temperature matches the reconstructed (observed) temperature by looking at graph #1 only. Of the 4 forcings, which gives a better fit to the general (smoothed) shape of the observed temperature? (In other words, don’t pay attention to the detailed, squiggly part of the graph).
Best fit from:
- Solar
- Volcanoes
- Aerosols
- GHG (greenhouse gases) [correct answer for the practice version]
12. Now, find the forcing that does the best job of matching the detailed ups and downs (ignoring the longer term trends).
Best fit from:
- Solar
- Volcanoes [correct answer for the practice version]
- Aerosols
- GHG (greenhouse gases)
13. Now try the combinations of the forcings listed below and choose the one that gives the best fit in a numerical sense over the whole length of the model period (years 1000 to 1998).
- All forcings on
- Volcanoes + GHG
- Solar + volcanoes
- Solar + volcanoes + GHG
- GHG + aerosols + volcanoes [correct answer for the practice version]
- GHG + solar
- Volcanoes + aerosols
14. Of all the forcings, which does the best job in terms of matching the strong increase in temperature over the last 100 years? This is the upward-pointing blade of the “hockey stick” pattern. Base your answer on a visual inspection of graph #1.
- Solar
- Aerosols
- Volcanoes
- GHG (greenhouse gases) [correct answer for the practice version]
15. Look back at what was said about the scientific method as a way of learning at the beginning of this activity, and then give an example of something new you’ve learned in this activity, and how experimentation played a role in your learning process.
Summary
Assessment Summary
As before, let’s try to recap some of the main points from this activity.
- Earth’s climate system is an energy balance system in which the energy absorbed from the Sun is equal to the energy emitted (in the form of infrared radiation) by the Earth.
- The simple fact that the energy emitted is directly related to the temperature provides a powerful negative feedback mechanism that drives the system to a steady state (where the energy in is equal to the energy out).
- Although the system has a tendency to find a steady state, changes in the solar input, the albedo, and the greenhouse effect can change the steady state and the system takes a while to adjust and get into the new steady state.
- The influence of CO2 on Earth’s climate is a logarithmic one, meaning that for each doubling, the amount of extra heat retained in our system increases by 4 W/m2 — so changing the concentration from 200 ppm to 400 ppm has more of an effect than changing it from 400 ppm to 600 ppm.
- We hypothesize that over the past 1000 years, there are four main forcings that cause our climate to change — solar variability, volcanic eruptions, aerosols (or pollutants), and greenhouse gases. By applying these forcings to our simple climate model, we can see that combined, they provide a fairly good match with the observed temperature record (supporting our hypothesis). Of these forcings, the greenhouse gases are by far the most important in terms of matching the observed temperatures over the past 100 years. Thus, we conclude that the increase in CO2 over this time period is the primary cause of the warming. None of the other forcings are capable of explaining this warming.
Summary and Final Tasks
Summary
Science does not claim perfect knowledge, but a huge body of successful climate science gives us high scientific confidence that:
- Our fossil-fuel burning, aided by deforestation and cement-making, are raising the CO2 concentration of the atmosphere.
- This has a warming influence.
- This warming influence causes feedbacks in the Earth system, some of which reduce the warming, others that amplify the warming, but over human lifetimes, the amplifiers are more important, causing the warming to be larger than that caused by the effects of the CO2 alone.
- This successful science projects that if we continue burning fossil fuels rapidly, future warming and other changes will be large compared to those experienced so far.
Reminder - Complete all of the Module 4 tasks!
You have reached the end of Module 4! Double-check the Module Roadmap table to make sure you have completed all of the activities listed there before you begin Module 5.
Enrichments
The Simplest Climate Model
The Simplest Climate Model, Better Climate Models, and Weather Forecasts End, but Climate Forecasts Continue
The energy from the sun that reaches the top of Earth’s atmosphere is sometimes labeled S, in units such as Watts per square meter (W/m2), and is approximately S=1370 W/m2. Most of the energy leaving the sun misses the Earth and goes streaming off into space, but we intercept a little of it. This total energy reaching the whole Earth is just the Earth’s cross-sectional area multiplied by S, or πr2S, where r is the radius of the Earth.
But, because the Earth is a sphere rotating under the Sun, this energy must be spread around the whole surface area of the planet, including the side facing away from the Sun, with a total area of 4πr2. Hence, the energy available per square meter of Earth’s surface is πr2S/4πr2=S/4.
However, recall that some of this energy is reflected back to space without warming the planet. We call the reflected part the albedo, and for the whole Earth it is roughly 30%, or A=0.3. The absorbed energy is 1-A=0.7. The average energy going to warm the planet is then S(1-A)/4.
The Earth radiates energy back to space, and this can be approximated by “black-body” physics. In this approximation, the outgoing radiation increases with the fourth power of the absolute temperature T (which is how many degrees you are above absolute zero), so outgoing radiation is σT4, where the constant σ, which is often called the Stefan-Boltzmann constant, has a particular numerical value = 5.67* 10-8 W/ m2 /K4 (that is, 5.67 times 10 to the negative eighth power), with temperature in Kelvins (K).(Some people like to write “degrees Kelvin” or “oK”, and the same for “degrees Fahrenheit or oF” or “degrees Celsius or oC”, but it is OK to just use K, F or C.)
Incoming and outgoing energy come into balance, so we have the equation S(1-A)/4=σT4. You can substitute the numbers given just above for S, A, and σ, and then calculate T, the average surface temperature of the Earth. This will give you about 255 K, or -18 C or 0 F, which is well below freezing; the actual average surface temperature is close to 288 K, or 15 C, or 59 F. Our very simple model omitted the greenhouse effect, which keeps the Earth’s average surface temperature above freezing.
Because radiation increases as the fourth power of absolute temperature, the climate is very strongly stabilized. A 1% increase in average temperature causes approximately a 4% increase in radiated power, which means that even a relatively large change in the brightness of the sun, or in other factors affecting the climate, will have a moderately small effect on the temperature. Without this strongly stabilizing effect giving us the climate we have, we might not even be here!
Better Climate Models
Climate models may be the part of the science that most people know the least about. Be very clear-scientists do not tell their computers to produce global warming, and then get excited when global warming comes out of the computer!
The simplest climate model we just discussed shows you a tiny bit of what goes into a real climate model. The starting point is physics. This includes the rules that mass and energy are not created or destroyed but just changed around. The physics also includes interactions between mass and energy-how much energy is needed to evaporate an inch of water per week, for example, or to warm the atmosphere by a degree. Interactions of radiation and greenhouse gases are specified from the fundamental physics worked out by the US Air Force after World War II, and other such studies.
The model also must “know” about the Earth-how much sunshine we get, how big the planet is and how fast it rotates, where the land and oceans are, how much air we have and what it is made of. (Climate models are applied to other planets, and very clearly give different answers because of the differences between the planets.)
All of this information is written down in equations, translated into computer language, and then the computer is turned on. What happens next is remarkable-the computer simulates a climate that looks like the real one. Air rises and rains in the tropics, then sinks and dries over the Sahara and Kalahari. Storms scream out of the west riding the jet stream, and snow grows and shrinks with the seasons across the high-latitude lands.
The model will not be perfect, of course. Suppose you are interested in wind speed. You know from personal experience that you can hide behind a windbreak for relief on a windy day. A forest can serve as a windbreak, giving weaker winds than on a prairie. So, the model must be “told” about the distribution of forests and grasslands (or else must calculate where they grow), and about the “roughness” of the forest and the grass. Scientists have conducted studies on the effects of forests and grasslands on winds, but all studies include some uncertainty. So, the modelers know that the surface roughness in this region must be about this much, but could be a little less or a little more within the range allowed by the data.
The modeler (or more typically, the modeling team) can now “tune” the model. If the winds in the model are a little stronger in some places than in the real world, the modeler may increase the roughness a little, although without going outside the uncertainties. To avoid any biases, different groups in different countries with different funding sources build different models, and tune them in different ways; when all of them agree closely, it is evident that the tuning hasn’t controlled the answer.
Some of the models are used for weather forecasting and for climate studies, and work fine for both. There are differences between weather and climate (see Weather Forecasts End, But Climate Forecasts Continue) - many climate models are simulating changes in vegetation, for example, but if you’re worried about the weather for next week, you don’t really care whether global warming endangers the Amazonian rainforest over the coming decades.
As a general rule, in talking to the public or policymakers, climate modelers rely especially on those results that:
- are exhibited by a range of models from simple to complex run by different scientific groups;
- are understood based on the physics;
- are observed in the history of climate; and
- are confirmed by recent instrumental observations.
Weather Forecasts End, But Climate Forecasts Continue
Weather Forecasts End, But Climate Forecasts Continue
No one has succeeded in forecasting the weather more than a week or two into the future, and we’re confident that such forecasts are impossible because of “chaos”. But, this difficulty does not interfere with the ability to project climate changes much, much further into the future.
For weather forecasting, you need to start with the current state of the atmosphere. If there is a cold front sweeping eastward across North Dakota in the US, areas just to the east in Minnesota are likely to experience the effects of that cold front soon. However, if the cold front has already passed across Minnesota, a different forecast will be more accurate.
This difficulty arises from the fact that no one can ever perfectly know the current state of the atmosphere everywhere (nor can we calculate perfectly, but let’s focus on the data here). If you give a good forecasting model the best available data, the model will produce a forecast that is demonstrably skillful for the next week or two, but the further you look into the future, the lower the skill, until the model is not able to predict the details of the weather. The model still produces “reasonable” forecasts—for summer in North Dakota, it will produce summertime conditions, not wintertime ones—but there is no skill for forecasting whether a cold front is coming in 26 days, or 27.
Suppose you now take your best data, and “tweak” them within the known uncertainties in the original measurements and the interpolations between the measurement stations. If the temperature in Fargo at noon on June 23, 2012 was 87.1 F, you don’t really know whether that was 87.100 or 87.102 or 87.009, nor do you know the exact temperature in all of the suburbs of Fargo that lack thermometers. So, take the 87.1 and try replacing it with the possible value 87.102, fully consistent with the available data. Make similar tweaks to other stations. Then, run the model again. What happens?
For the first few days, the forecast is almost unaffected. But, as you look further into the future, the forecast becomes more and more different from the original one. If you do this again, with different tweaks to the data (say, 87.009 rather than 87.100), you again will get almost the same forecast for a few days, but further out the forecast will differ from both of the prior ones. Do this a lot of times, and the odds are good that one of the runs will end up being close to what happens in the future, and that the average of the runs will be similar to the average behavior of the weather over a few decades (unless climate is changing rapidly!). But, you won’t know which individual run is the right one. This “sensitivity to initial conditions” is often called “chaos” in public discussions, and it means that weather forecasts can’t be accurate too far into the future. In the same way, you cannot predict the outcome of the roll of dice in a game until the dice have almost stopped moving.
Note that you can predict the average outcome of many rolls of dice, and you can predict the average behavior of weather over many years, which is climate. You may have met someone who argued that failure of a weather forecast casts doubt on climate-change projections, but that is like using one roll of dice to argue that if you keep gambling you’ll beat the casino. People who make that mistake at casinos are usually known as “poor” or “broke”.
Video: Chaos and Phil the Groundhog (PSUrockvideo) (3:50)
PRESENTER: (SINGING) As the Wheel-of-Fortune is spinning, slowing down, you can predict that just before it stops, where it's going to end. Whether a smile or frown, but for more than a few seconds, tops.
But you know before the spin, the million dollar pie, is skinnier than all the rest. You can predict it will be rare as a few weeks go by, confident you'll pass the test.
The game is chaotic, so you cannot know too far in the future just how it will go. But the wheels deterministic, as the averages show through the years.
The weather follows rules that we now know quite well. The physics cannot go away. But too far in the future and you cannot tell what will happen on a single day.
Because no data can be perfect, we can never know everything exactly, everywhere. Tomorrow's forecast is quite good, but the uncertainties grows 'til we can't tell what will occur then, there
But this chaos doesn't mean anything goes. Brazil's hot rainforest won't get Antarctic snows. The climatic averages show how the wind blows, in your ear.
If they widened the million wedge, the chances would rise, that any spin would hit it square. You still could not predict one, but no surprise, more millions would be spun up there.
If the sun brightens up, or less reflects back out, or there's an increase in greenhouse gas, that turns up the thermostat, there is no doubt. And climate change will come to pass.
And history, physics, data, models show our CO2 warms the surface here below. So, we're eating the climate as our emissions grow through the years.
But climate averages the weather, you still have to spin, and see just where the pointer stops. Sometimes you lose and other times you win. Some lovely days, and yes, some flops.
On February 2nd of another year, the faithful sun will surely rise. But will it bring shadows on a morning clear, or diffuse light under cloudy skies?
Phil, please tell us, what will March 1st bring? Sleet, snow, tornadoes, a warm day in spring? You're just as good for that as the computer thing, and you're cuter.
Phil, please tell us, what will my March 1st bring? Sleep, snow, tornadoes, a warm day in spring? You're just as good for that as the computer thing, and you're cuter.
Carbon Dioxide is more Important than Water Vapor as a Greenhouse Gas
Carbon Dioxide is more Important than Water Vapor as a Greenhouse Gas
This may seem strange. If you track what happens to the radiation leaving the Earth's surface, some is absorbed on the way, and some goes straight out to space. Water vapor, carbon dioxide, and clouds dominate the absorption, with all the others (methane, ozone, chlorofluorocarbons, nitrous oxide, etc.) also enough to be important if taken together. (Clouds also have a slightly more important role in blocking the sun, with the net effect of clouds being slight cooling under modern conditions.) Because some radiation is blocked almost entirely by only one gas type, but other wavelengths may interact with both water vapor and carbon dioxide, there is a bit of uncertainty in the bookkeeping of the exact importance of a single type of greenhouse gas. Overall, though, it is fairly accurate to say that water vapor supplies close to half of the total greenhouse effect, clouds and carbon dioxide each a little under a quarter, and all others just under a tenth.
But, the amount of water vapor in the air is equal to the amount of rain that falls on the Earth in just over a week. As water vapor rains out very rapidly, it is replaced by evaporation of more water. Any extra water vapor we put in the air from burning of fossil fuels or irrigating crops just doesn't stay up there very long. And, because the natural source of water vapor is so huge (evaporation from a giant ocean and a lot of plants that together cover almost the entire Earth), the human source is actually tiny in comparison. The only practical way we know of to greatly change water vapor in the air is to change the temperature. A hair dryer has a heater for good reasons, and warming the air will allow it to pick up and carry along more water vapor, whether the warming is caused by carbon dioxide, or a brighter sun, or some sort of heat ray from space aliens, or anything else.
Some research has looked at what would happen if carbon dioxide were removed from the atmosphere. Loss of the carbon dioxide cools the planet, but that condenses some of the water vapor, which cools the planet more, and the Earth turns into an ice-covered snowball. If water vapor is removed, a lot more evaporates quickly before the Earth can freeze.
So, yes, water vapor is blocking more energy than carbon dioxide today. But, carbon dioxide is much more important for changing the climate than is water vapor. Carbon dioxide can be a forcing—add it to the air, and you force the climate to change. Carbon dioxide also can be a feedback—change something else (such as reducing oxygen in the ocean to allow more fossil-fuel formation), and that changes carbon dioxide in the air, which in turn changes the temperature. But, water vapor is almost entirely a feedback, because there aren't any natural or human processes other than changing the temperature that can put water vapor up fast enough to make a big difference to climate.
Humans are Primarily Responsible for the Rise in CO2
Humans are primarily responsible for the rise in CO2
Bookkeeping by itself shows that humans are responsible. We produce roughly 100 times more CO2 than volcanoes do (maybe only 50 times, maybe closer to 200 times, if you include the uncertainties, but something like 100). Nature was producing its CO2 for a long time, but humans have increased from being a very small source to being much more important than volcanoes.
Furthermore, several tracers in the atmosphere confirm the bookkeeping. These include:
- Dropping oxygen. The level of oxygen in the air is dropping as CO2 rises. You'll still be able to breathe with no trouble, but this shows that the rise in CO2 is caused by fire, which uses oxygen, and not by melting beneath a volcano or CO2 coming out of the ocean, which don't use oxygen.
- Falling carbon-13. Plants preferentially use CO2 containing the lighter and faster-diffusing carbon-12 rather than the heavier carbon-13, so CO2 formed by burning living plants or fossil fuels is more enriched in carbon-12 than is CO2 emitted by volcanoes or coming from chemicals dissolved in the ocean. The CO2 in the air is becoming more enriched in carbon-12 and less enriched in carbon-13, which shows that the extra CO2 comes from living or dead plants.
- Falling carbon-14. Carbon-14 is made in the atmosphere by cosmic rays, then taken quickly into living plants, but decays radioactively over about 50,000 years. (Half of the carbon-14 decays in just about 5730 years, half of the remainder in the next 5730 years, and by 50,000 years or so almost none remains.) Thus, living plants contain carbon-14 but fossil fuels don't. Carbon-14 is becoming less common in the atmospheric CO2, much more rapidly than can be explained by radioactive decay, showing that the extra CO2 in the air is coming from plants that have been dead a long time.
Taken together, bookkeeping says that the rise in atmospheric CO2 is coming from human burning of fossil fuels. And, the atmosphere says that the rise in CO2 is coming from burning of plants that have been dead a long time. The agreement is beautiful, confirming that we are responsible for what is occurring.
There is a bit more complexity to this, linked to our burning of forests, but also letting some forests grow back and fertilizing others, and linked to us releasing some CO2 while making cement. But overall, the biggest source of CO2 is our fossil fuels, and this will become more and more important in the future if we continue on our present path.
Global Warming Did Not Stop Recently
Global Warming Did Not Stop Recently
The main text presented some of the evidence that temperature is rising. But, the climate is influenced by the 11-year sunspot cycle, the occasional sun-blocking influence of particles from big volcanic eruptions, and also by the sloshing of water in the tropical Pacific Ocean associated with El Nino and La Nina-when the hot waters spread along the equator in an El Nino event, some heat moves from the ocean to the air, and when the cold waters of La Nina follow, heat flows back into the ocean. An extra El Nino, or an extra-strong one, in a decade can make global warming look very fast, whereas an extra La Nina can temporarily slow the upward march of temperature from the rising CO2. This sort of sloshing cannot ultimately change the warming of the planet, but can make it appear more variable, and control whether the air warms fast and the ocean much slower, or whether faster warming of the ocean slows the atmospheric warming a bit.
Think for a minute about a neighbor taking a very active dog for a walk. Watch the person, and you can see steady progress down the street. Watch the dog, and you may have to study carefully for a while to even know which way they are going. You may find it useful to think of the year-to-year temperature changes as the dog, and the average behavior as the person.
Next, take a look at the figures, which highlight events from Dr. Alley’s career. In each case, the jagged red line connects the temperatures from year to year, using data from NASA’s Goddard Institute for Space Studies, and the smoother black line is the best fit to the data over the interval selected. You will see that in each case, Dr. Alley has carefully picked the end points so that the best-fit line slopes downward, indicating a cooling trend. For the last 20 years, Dr. Alley has met important people in Washington, DC who declared that global warming stopped. It is very easy to do so; be quiet during a year with strong warming, and then the next year go back to claiming that global warming stopped.
Over a century ago, the Guinness brewery in Ireland hired an Oxford mathematician, W.S. Gosset, to develop ways to separate actual trends from short-term variability. The techniques were published with a pseudonym (A. Student), presumably to help people without telling competitors how valuable it was for a business to avoid self-delusion. If you apply techniques derived from that research, global warming has not stopped; all time intervals long enough to show a statistically significant trend do show warming.
By 2016, the temperature had risen enough that it barely fit in the chart above, aided by the ongoing human warming and by a strong El Nino event. This strong El Nino was warmer than the previous one, which was warmer than earlier ones, mostly because of human CO2. But, temperature was dropping a bit in late 2016 as the El Nino faded. And, some inaccurate voices were already, again, declaring that global warming had stopped.
Better Climate Models
Some Better Climate Models
Climate models may be the part of the science that most people know the least about. Be very clear — scientists do not tell their computers to produce global warming, and then get excited when global warming comes out of the computer!
The simplest climate model we just discussed shows you a tiny bit of what goes into a real climate model. The starting point is physics. This includes the rules that mass and energy are not created or destroyed but just changed around. The physics also includes interactions between mass and energy — how much energy is needed to evaporate an inch of water per week, for example, or to warm the atmosphere by a degree. Interactions of radiation and greenhouse gases are specified from the fundamental physics worked out by the US Air Force after World War II, and other such studies.
The model also must “know” about the Earth-how much sunshine we get, how big the planet is and how fast it rotates, where the land and oceans are, how much air we have and what it is made of. (Climate models are applied to other planets, and very clearly give different answers because of the differences between the planets.)
All of this information is written down in equations, translated into computer language, and then the computer is turned on. What happens next is remarkable — the computer simulates a climate that looks like the real one. Air rises and rains in the tropics, then sinks and dries over the Sahara and Kalahari. Storms scream out of the west riding the jet stream, and snow grows and shrinks with the seasons across the high-latitude lands.
The model will not be perfect, of course. Suppose you are interested in wind speed. You know from personal experience that you can hide behind a windbreak for relief on a windy day. A forest can serve as a windbreak, giving weaker winds than on a prairie. So, the model must be “told” about the distribution of forests and grasslands (or else must calculate where they grow), and about the “roughness” of the forest and the grass. Scientists have conducted studies on the effects of forests and grasslands on winds, but all studies include some uncertainty. So, the modelers know that the surface roughness in this region must be about this much, but could be a little less or a little more within the range allowed by the data.
The modeler (or more typically, the modeling team) can now “tune” the model. If the winds in the model are a little stronger in some places than in the real world, the modeler may increase the roughness a little, although without going outside the uncertainties. To avoid any biases, different groups in different countries with different funding sources build different models, and tune them in different ways; when all of them agree closely, it is evident that the tuning hasn’t controlled the answer.
Some of the models are used for weather forecasting and for climate studies, and work fine for both. There are differences between weather and climate (see Weather Forecasts End, But Climate Forecasts Continue) - many climate models are simulating changes in vegetation, for example, but if you’re worried about the weather for next week, you don’t really care whether global warming endangers the Amazonian rainforest over the coming decades.
As a general rule, in talking to the public or policymakers, climate modelers rely especially on those results that:
- are exhibited by a range of models from simple to complex run by different scientific groups;
- are understood based on the physics;
- are observed in the history of climate; and
- are confirmed by recent instrumental observations.