Module 6: Solar and Wind Power
Overview
We are burning fossil fuels about a million times faster than nature saved them for us. We might continue on this path for another century or more, or we might face an “energy crisis” within a few decades as we begin to run out of fossil fuels. But, we cannot choose to rely on fossil fuels for the long-term, because they simply will not be there.
Fortunately, there are vast resources of renewable energy available. If we could collect just 0.01% of the sun’s energy reaching the top of our atmosphere, we would have more energy than is now used by all humans together. With modern technologies, a solar farm in a sunny region near the equator only a few hundred kilometers (or miles) on a side would supply more energy than we are now using. Building such a solar farm would be a huge task, but we have completed huge tasks before.
Roughly 1% of the sun’s energy goes to power the wind, so we could energize all of humanity using the wind, too. Building a wind farm on just the windy parts of the plains and deserts of the world would provide much more energy than we now use. Again, there are huge challenges in actually building that many wind turbines, getting the energy where we want it, and smoothing out the effects of night and day, storm and still weather. But, no “breakthroughs” are needed, just building and improving what we already know how to do.
Using renewable energy is not a new idea. Abraham Lincoln advocated wind power, for example, and Thomas Alva Edison promoted the use of solar energy. So, let’s go see what they were thinking of, and how modern scientists and engineers have risen to their challenge.
Goals and Objectives
Goals
- Recognize the great diversity of energy options currently available to us
- Explain scientific concepts in language non-scientists can understand
Objectives
By the end of this module, you should be able to:
- Recognize the advantages and limitations of solar and wind energy
- Recall the basic science behind solar and wind power generation
- Evaluate who is responsible for maintaining "the grid" as home generation grows in popularity
Roadmap
| To Read | Materials on the course website (Module 6) | |
|---|---|---|
| To Do | Discussion Post [1] Discussion Comments [1] Quiz 6 |
Due Wednesday Due Sunday Due Sunday |
Questions?
If you prefer to use email:
If you have any questions, please email your faculty member through your campus CMS (Canvas/Moodle/myShip). We will check daily to respond. If your question is one that is relevant to the entire class, we may respond to the entire class rather than individually.
If you prefer to use the discussion forums:
If you have any questions, please post them to Help Discussion. We will check that discussion forum daily to respond. While you are there, feel free to post your own responses if you, too, are able to help out a classmate.
Solar Energy
Solar Energy
The sun is far and away the largest potential source of energy to power things on our planet. Humans have been using the sun as an energy source for thousands of years – just think about agriculture and how that would work without sunlight – but the industry of using solar energy to create electricity is in its relative infancy. Growth is fast – in percentage terms, solar is the fastest-growing energy source on the planet. And the cost of solar power, one of its most formidable barriers, is coming down quickly as well. In this module, we’ll take a look at some of the most common technologies used to convert solar energy to electricity.

Solar Photovoltaics
Solar Photovoltaics
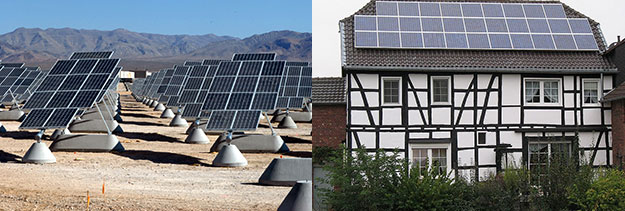
When most people think of “solar power,” they think about one of two things – vast arrays of solar collectors laid out in hot deserts (the left-hand panel below) or smaller arrays on rooftops or highways (the right-hand panel below). This is perhaps the most ubiquitous method of converting solar energy into electricity, but it is not the only method. These arrays of solar collectors are known as “solar photovoltaic” installations or Solar PV for short.
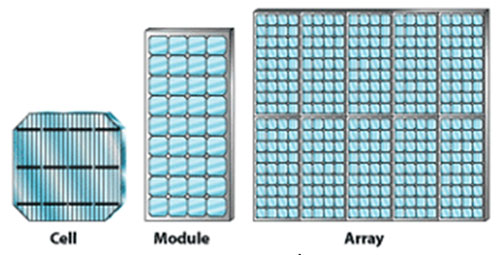
Solar PV installations consist of individual collectors called cells, which are packaged together in bundled modules. An individual cell does not generate enough electricity to power much of anything, which is why they must be bundled together. A single module might be enough to provide electricity for a single parking meter or roadside telephone. A number of modules can be further bundled together to form an array (see below). Multiple arrays might be needed to provide electricity for a building or a house.
There are many different kinds of solar PV cells in existence (and even more being developed in research laboratories), but they all work in more or less the same way. Unlike virtually any other type of power plant (be it coal, natural gas or wind), there is no turbine in a Solar PV cell. In fact, there are basically no moving parts at all. .
Solar PV cells harvest solar energy through a phenomenon called the photovoltaic effect, discovered in 1839 by the French physicist Bequerel. Photons of solar energy interact with electrons to “excite” them, causing them to move through conductors, thus producing an electric current. The first solar PV module was made at Bell Labs in the 1950s, but was too expensive to be more than a curiosity; in the 1960’s NASA started to use PV modules in spacecraft and by the 1970s, people started to explore their use in a wider range of terrestrial applications.
This following video explains a bit more about how Solar PV cells work and describes the different Solar PV technologies in use today. One of the potentially most important evolutions in Solar PV technology is the use of semiconducting materials other than silicon in Solar PV cells. These materials are of interest because they could, in concept, allow more of the sun’s energy to be captured on a single array. But they face barriers in the form of high costs and, in some cases, questions about the availability of raw materials.
Video: Photovoltics, a Diverse Technology (4:26)
PRESENTER: 30 years ago, the first solar cells were made of silicon. And today, silicon makes up more than 3/4 of the rapidly growing worldwide photovoltaic market. But photovoltaic, or PV cells, are also made with other semiconductor materials. Why so many types of solar cells? This diversity is due to innovation. PV materials are improving. Manufacturing costs are dropping. And PV applications are expanding. Balancing these three factors can meet demands for clean, green power, while creating more American jobs.
Innovation means improving photovoltaic materials. Every PV material absorbs sunlight differently, depending on bandgap, which is a unique electronic property of the material. Some cells absorb sunlight within the first micron of material. Others need 100 times more material to absorb the same amount of energy from the sun.
The sun's energy arrives as a combined spectrum of different wavelengths. Each color carries a different amount of energy. This make solar cell design more complex.
If the energy of the absorbed photon matches the PV materials bandgap, then an electron-hole pair is created. If the photon has more energy, it still creates only one electron-hole pair, but the additional energy is lost as heat. If the photon has less energy than the bandgap, it is not absorbed.
Low bandgap materials absorb most of the solar spectrum, creating many electron-hole pairs, producing a high current. However, PV cells with low bandgap materials have a low voltage. High bandgap materials absorb only higher energy photons, creating fewer electron-hole pairs, producing a lower current with a higher voltage.
A solar cell's efficiency is the percentage of the solar energy shining on the cell, that is converted into electrical energy. One way to increase efficiency is to use multiple layers, to capture power from multiple wavelengths of light. Understanding the properties of each PV material, allows scientists to improve designs that maximize the power of the cell.
Innovation in PV also means lowering the cost of manufacturing. Crystalline silicon cells have high efficiency, because they used very pure single-crystalline silicon, which is expensive to manufacture. Multi-crystalline silicon cells have lower efficiency, but they can be cheaper to manufacture, because they use lower quality silicon, less energy, and simpler manufacturing equipment.
Thin-film solar cells can be made for material such as-- cadmium telluride, copper indium diselenide, or amorphous silicon. These materials absorb light more readily than crystalline silicon, so they can be used in very thin layers that are less expensive to produce. Thin-film solar cells are generally less efficient than crystalline silicon cells, but they can be cheaper to manufacture because they use less semiconductor materials, which are grown on glass or flexible foil.
Finally, innovation means meeting different applications best suited by different types of solar cells. Today, PV devices produce power to meet the needs of utilities, businesses, homes, and consumer products.
Large-scale installations can use a range of highly reliable PV technologies. Solar powered satellites are more sensitive to power per pound. These high-efficiency solar devices can accept higher material and manufacturing costs to get more electricity from less material. Flexible thin-film devices are being installed in innovative ways, including incorporation into structures with complex shapes.
Photovoltaics are here now. And the diversity of PV devices is advancing as scientists improve PV materials and develop new manufacturing methods. More solar applications are emerging, as these innovations make PV more affordable.
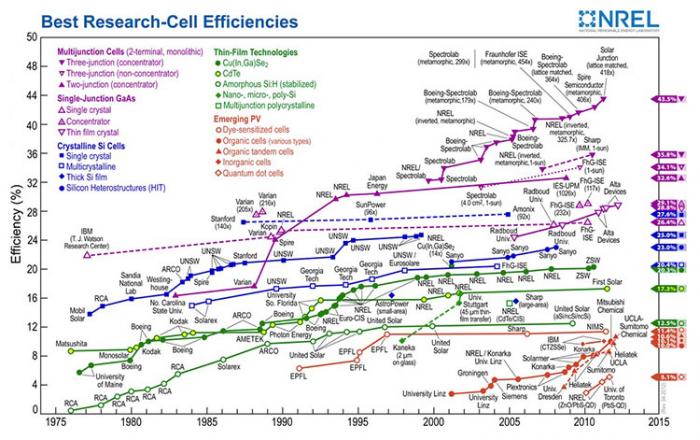
Most modern Solar PV technologies are relatively inefficient compared to other forms of electricity generation. Remember here that “efficiency” refers to how much of the fuel that is injected into an electricity generation system is actually converted into useful electricity, versus being rejected as waste heat or otherwise escaping from the generation system. While modern coal-fired and gas-fired power plants can have efficiencies as high as 60% (or sometimes even higher), most Solar PV cells convert sunlight to electricity with an efficiency of 20% or less (see below), though this number has been rising over time.
Whether the efficiency of Solar PV cells is all that important is a matter of some debate. On the one hand, higher-efficiency cells would require less land or space to produce a given amount of electricity. Land use (or the number of rooftops) can be a significant limiting factor in the deployment of Solar PV. On the other hand, fuel from the sun is free and there is no scarcity of sunlight, so whether Solar PV cells can achieve 30% efficiency versus 20% efficiency may not be such a big deal, and may not be worth the extra economic cost to produce such high-efficiency cells.
Concentrating Solar Power
Concentrated Solar Power
If you have ever left a cold drink out in the sun during the summertime (or if you have children, if you have ever left water in the kiddie pool out in the sun for a long time), you would notice that the formerly cold water gets warm – maybe even hot. If it happens to be summertime where you are living right now, try it! Whether you realize it or not, this little science experiment is the basis for a second way of harnessing the sun’s energy to produce electricity, called “concentrated solar power” or CSP. (This technology is also sometimes called “solar thermal.”)
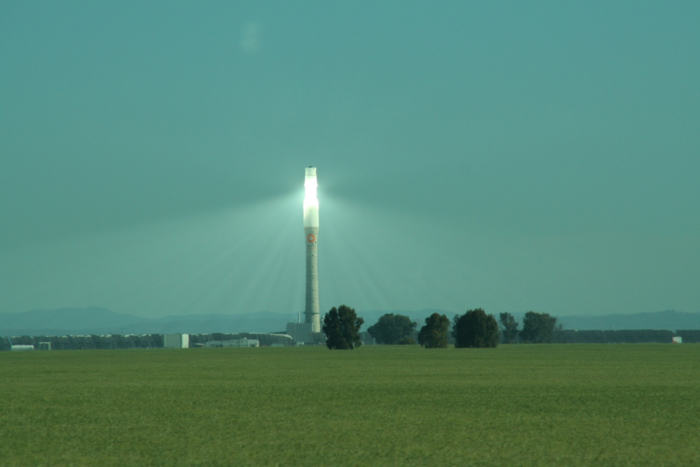
The following video explains how CSP works. The basic idea is that a collection of mirrors reflects the sun’s light (and heat) onto a large vessel of water or some other fluid in a metal container. With enough mirrors reflecting all of that sunlight, the fluid in the metal container will get hot enough to turn water into steam. The steam is then used to power a turbine just like in almost any other power plant technology
 Earth: The Operators' Manual
To get started, please watch the video below. This particular video will discuss the history of the idea of concentrated solar power.
Video: Lightbulbs in the Desert (Powering the Planet) (5:55)
Narrator: Planet Earth is awash in renewable energy. The oceans store heat and offer wave and tidal power. Plants harvest sunlight and store its energy. The Sun warms the atmosphere and sets air in motion, and we're getting better at tapping wind power. But the biggest and most promising energy source is the nearby star that lights our days and warms our world. Sunlight reaching the Earth's surface offers about 120,000 terawatts. If the Sun's energy were spread around the world, it would average around 240 watts per square meter. Richard Alley brings that huge number down to earth.
Alley: If I walk out into this little patch of this great desert, and I hold out my arms about like this-- And then another of me does the same thing-- And each of me is holding two 60 watt incandescent light bulbs, or 10 compact fluorescents, that's 240 watts per square meter that I'm marking out here. That's a lot of energy. And averaged across the globe, day and night, summer and winter, that's how much sunlight is available to power the planet. Let's see what it takes to turn that vast potential into energy we can use. It doesn't take a genius to know that a mirror reflects the Sun, but it does take an inventor and engineer to make the next step. Use the mirror to focus the Sun's rays on a tank filled with liquid to make steam, to drive a turbine, to make electricity, and you have concentrated solar power. That's not a new idea, but one that a little-known American inventor, Frank Shuman, pursued around 1910.
Narrator: In his Philadelphia workshop, Shuman invented safety glass for skylights and automobiles. He also came up with designs that could concentrate sunlight on metal tubes, heat liquid, and drive a steam turbine. But in Pennsylvania, back then, it was all about coal. Shuman had difficulty finding local backers. So in 1912, he set off for Egypt. His prototype solar farm used parabolic troughs to concentrate sunlight and boil water. The steam ran a 75 horsepower engine that pumped water from the Nile to irrigate cotton fields. The idea was right, but ahead of its time. Hobbled by both a lack of government support and adequate private capital, the experiment ended with the outbreak of World War One. These parabolic troughs look very similar to Shumans' designs, though they didn't come online until a century later.
This is Solnova 3, at one of the world's first commercial solar power plants. Just as in Shuman's experimental station, the troughs concentrate solar radiation on a pipe that contains a heat-bearing fluid. When completed there'll be three almost identical plants, each with an output of 50 megawatts, large enough to support about 26,000 households. While the Sun powers the Solucar platform, it was the Spanish government that helped develop solar power. The central government set a specific target of 500 megawatts of concentrated solar power and committed to price supports for 25 years. That, in turn, unleashed inventors and industry to prototype plants like this one. The technology works, though changing government policies and the budget crisis have impacted the industry. But, Abengoa, the company building Solucar, is a part of a consortium planning the world's largest solar power project. Formed by a group of European and North African companies and the DESERTEC Foundation, this consortium has energy ambitions that are revolutionary for both Europe and the Middle East.
Unlike some of its neighbors, Morocco has little oil or other fossil fuels. But it does have sun, sand, and empty spaces. The Moroccan government has encouraged the use of distributed solar power by small businesses and individuals. Already, out on the edge of the Sahara, you can see photovoltaic panels on top of tents. But the Desertec vision goes beyond this by including concentrated solar power plants, photovoltaic installations, and wind turbines, linked with low-loss, high-efficiency transmission cables back to Europe. The Desertec project estimates that solar power from the Sahara could provide more than 80% of North Africa's needs, and 15% of Europe's electricity, by 2050. In a single generation, Morocco's young and growing population could go from energy poverty to energy independence. The energy created by this proven technology could generate both electricity and income for some of the world's poorest nations. And updated versions of Shuman's century-old designs and a smart grid could go a very long way toward meeting our species' need for energy. Collecting just 10% of the Sun's energy from a 600-mile-square of low-latitude desert would supply roughly twice today's human consumption of energy.
Recently, more advanced CSP systems have begun to replace the water or synthetic oil with molten salt as the fluid that is heated molten salt can remain as a liquid from 290 to 550°C. Once it is heated in the tower at the center of the array of mirrors, the hot liquid salt is stored in a highly insulated tank and when there is a demand for electricity, it is sent to a heat exchanger where it turns water into steam, driving the turbine to generate electricity. When the molten salt passes through the heat exchanger, it gives up heat, so it cools off. It is then recirculated to the tower at the center of the mirrors, where the concentrated sunlight heats it back up. These systems have enough liquid salt so that it can act as a thermal battery, storing the solar energy for more than a week before it cools off to the point where it cannot make steam. These kinds of power plants are expensive at the moment, but the technology is still quite new and so we expect prices to drop quickly, as they have for other renewable energy technologies. In fact, a CSP system in Spain using molten salt is now capable of producing energy on demand, 24 hrs a day rather than being limited to times of peak sunlight. The ability to schedule power production versus having to take the electricity when it comes is of great value to the folks that operate electricity systems. Nevertheless, there are still a few obstacles for CSP:
- CSP is difficult to make work on a small scale. A lot of land, usually in sunny deserts, is typically needed. So CSP does not scale up and down to large and small installations like Solar PV can.
- CSP is currently quite expensive — roughly twice as much per unit of energy as Solar PV. However, this is a very new technology and prices are expected to go down in the future.
Solar Energy Potential and Utilization
Solar Energy Potential and Utilization
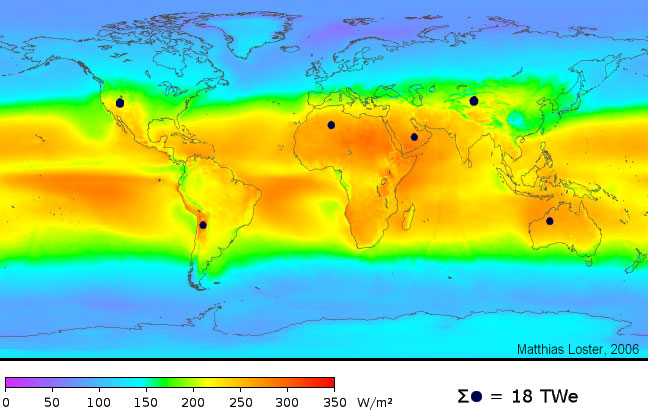
In addition to being free as a source of energy (it does cost money to harness it and turn it into electricity), energy from the sun is practically limitless. The surface of the Earth receives solar energy at an average of 343 W/m2. If we multiply this times the surface area of the Earth, about 5x10¹⁴ m2, we get 1715x1014 W. But, 30% of this is reflected, and only 30% of the Earth is above sea level, so the usable solar energy we receive on the land surface is about 360x1014 W. We need to reduce this further because not all of the land surface is suited to installation of solar PV panels — we don't want to cut down forests, and ice-covered areas are not suitable, so we reduce the area by about one half. Over the course of a year, this amount of solar energy adds up to 66x1022 Joules. In 2018, we used about 600x1018 Joules of energy, which is just a shade less than 0.1% of the harvestable solar energy we receive on the land. This means that even if we got all of our energy from the Sun, we would not make a dent in the total! The potential is vast — 10,000 times what we need!
Let’s consider what it would mean for us to get all of our energy from Solar PV — how much of the Earth’s surface would we need to cover with panels? The black dots (radii of 100 km) in the figure below represent areas that could generate enough energy from sunlight to completely power the planet for an entire year. Practically, there are barriers to running the planet entirely on sunlight (everything would need to be electrified, we would need very large quantities of battery energy storage, and so forth), but the dots are useful as a demonstration of just how vast the energy production potential from solar is.
Optional: If you are interested in a more detailed view of solar energy resources in your area, a company called Vaisala 3Tier [10] produces maps that you can download for your own personal (non-commercial) use.
ADD TRANSCRIPT
One of the important differences between Solar PV and CSP is that CSP requires more intense sunlight, and as such, it is not a viable option in many places. In contrast, Solar PV works just about everywhere — it is more versatile. Another important difference is in scale — CSP is really suited to utility-scale power plants, whereas Solar PV works at both the utility-scale and the very small scale.
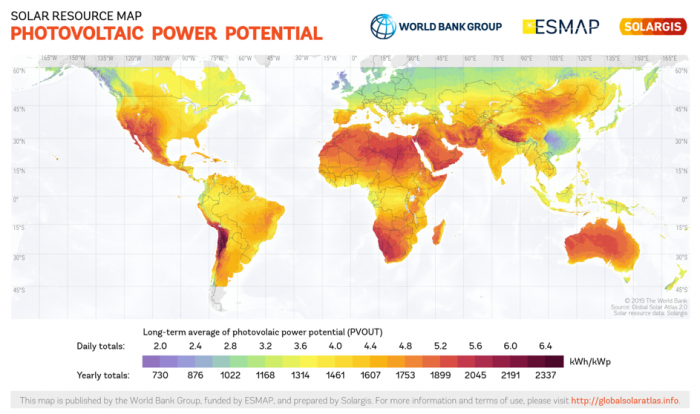
The map below shows the PV potential for the world. The variability in the map is mainly a function of cloudiness and latitude. Many of the big, utility-scale solar PV plants are located in the red areas, but there is a surprising amount of Solar PV energy being harvested in places like Germany and Japan, both of which are fairly cloudy. But, even in a fairly cloudy place like Pennsylvania, you can see from the map that we could expect about 1460 kWh per year from a 1 kW PV array. From this, you can calculate how many square meters of PV panels you’d need to provide the electricity for a house that uses the typical 10,800 kWh per year. If you divide 10,800 kWh by 1460, you see that you’d need about 7kW of solar panels, which would fit on a typical house roof. The main point here is that Solar PV is a viable energy source in most parts of the world where people are living. In contrast to Solar PV, energy from CSP is only viable in places where the daily totals in the map above are higher than 6 kWh/day. Nevertheless, there are many regions where CSP viability and human population coincide, so it too can be an important energy resource in the future.
Activate Your Learning
For students living in the United States: According to the map above, do you live in an area that can support PV generation? What about CSP? Do you know anyone who generates solar power at home?
Click for the answer.
The Changing Economics of Solar Energy
The Changing Economics of Solar Energy
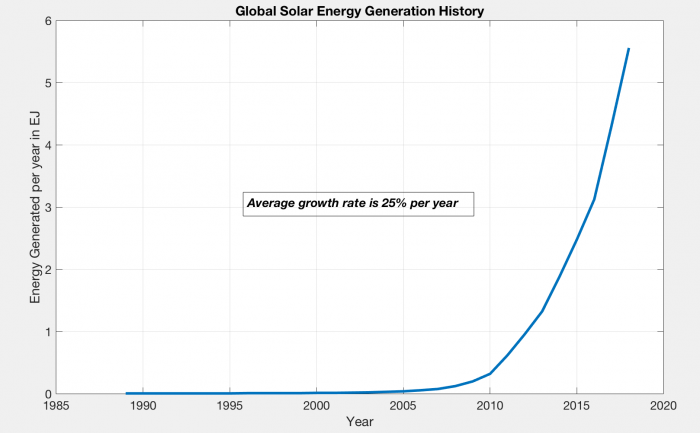
The generation of solar energy – primarily through Solar PV – is a story of exponential growth. Since 2000, the global Solar PV industry has grown by around 25% per year on average, so installed capacity has been doubling every 2.7 years (see below). Even so, solar represents a very small sliver of total global power generation — for now.
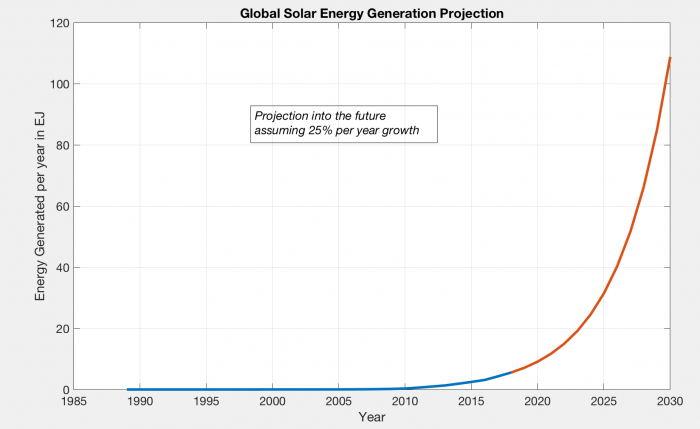
The nice thing about exponential growth is that it is easy to project it into the future. Over the time period shown in the graph above, solar energy generation has grown by 25% per year; if we continue that into the future, we find that before long, we would have enough solar energy to make up a substantial portion of the global energy needs by 2030 (see figure below). By the year 2040, this growth would rise to 1360 EJ, more than twice the global energy consumption of the present. Of course, that makes no sense — we would not produce more energy than we need, and this reminds us of an important fact, which is that exponential growth cannot continue forever.
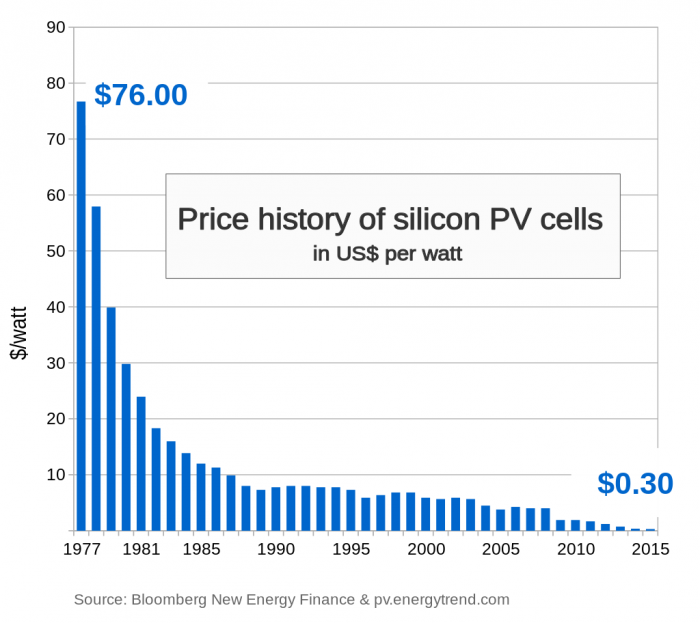
One reason to trust this projected future growth is that the price of solar energy has fallen dramatically over time as can be seen in the graph below. In fact, if the generation of solar PV energy has been growing exponentially, the price has been dropping exponentially.
The price decrease is following a pattern that has been given a name: Swanson’s Law, which states that the price drops by about 20% for each doubling in the number of PV cells produced. This law suggests that the prices of solar PV energy will continue to decline in the future.
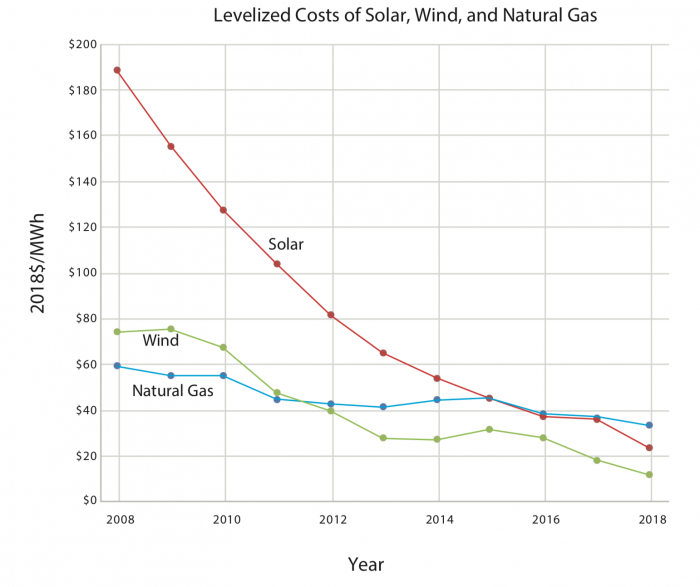
This brings us to an important question — how does the cost of solar energy compare to other sources of energy? Energy economists have come up with a good way of comparing these costs by adding up all of the costs related to producing energy at some utility-scale power plant (a big wind farm, a big solar PV array, a CSP plant, a nuclear plant, a gas or coal-burning power plant). This is called the levelized cost of energy and you get it by taking the sum of construction costs, operation and maintenance costs, and fuel costs over the lifetime of a plant and then dividing that by the sum of all the energy produced by the plant over its lifetime. This cost provides us with a way of comparing the energy from different sources. Since the boom in natural gas production due to fracking, natural gas has been the lowest cost form of energy (which is why coal is being used less and less), but energy from solar and wind have been decreasing rapidly, as can be seen in the following graph. When a renewable electrical energy resource such as solar or wind becomes equal in cost to the cheapest fossil fuel source of electricity, we say that the renewable resource has reached "grid parity". Once grid parity is achieved, the renewable resource makes sense from a purely economic standpoint, and as it drops below the grid parity point, it is the smartest electrical energy resource.
Part of the reason that solar and wind have expanded in recent years has to do with government policies — a number of countries have instituted subsidy and incentive programs that offset a large portion of the construction/installation costs of solar and wind technologies or devise rules that otherwise give advantages to electricity generation from renewables. Subsidies enacted in various countries have included feed-in tariffs (which guarantee an above-market sales price for solar power); rebates (which directly offset capital and installation costs); and favorable tax treatment (which is like an indirect feed-in tariff). Germany has one of the world’s largest Solar PV markets not because it has the best solar resource on earth but because it has been willing to support a generous feed-in tariff on solar power. (For many years the tariff was over 30 cents per kilowatt-hour, or more than five times the average power price in the United States; in recent years the tariff has been reduced.) These government policies have effectively stimulated the growth of these renewable energy resources, which has, in turn, resulted in lower prices.
Wind Energy
Wind Energy
By this point in the course, you have been told repeatedly that our energy and electric power systems are dominated by fossil fuels. And this is true. But you may be surprised to know that in the United States and many other countries, wind is among the fastest-growing sources of new power plant investment, as measured by megawatts of new capacity. In several areas, including Texas and the Mid-Atlantic (where a boom in fossil fuel production is currently underway), wind power is the largest source of new electrical generation capacity, making up a majority of new plants. That’s right – in oily Texas, more than 50% of new electrical generation in recent years has been from wind. In fact, Texas is the US leader in wind energy generation – much more than even California, which has somewhat greener political leanings.
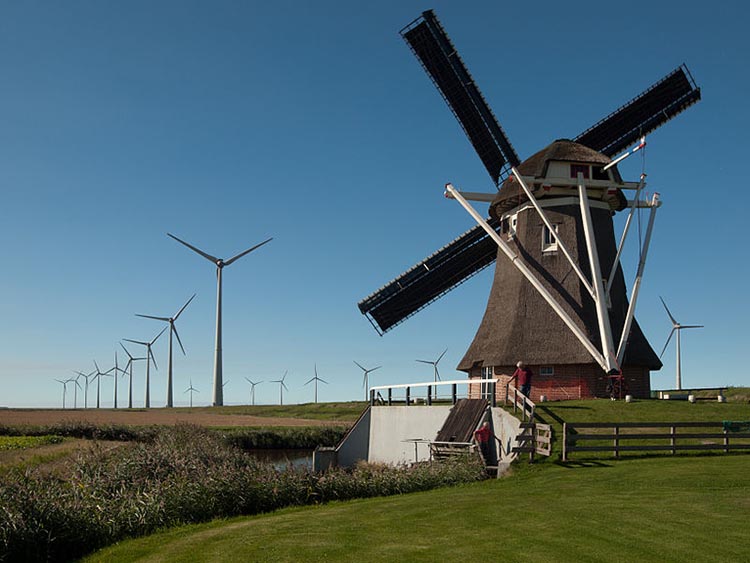
In this section of the course we’ll take a look at what’s going on in all those tall towers sprouting up along ridgetops and plains – and out in the middle of the ocean, in some places. Humans have been harnessing the wind to do useful work in one fashion or another for many thousands of years – the first “wind energy” systems were actually sailboats. Humans have also been smart enough to realize that wind is a very useful cooling mechanism on hot days. So in some sense, the windows in our houses are a form of wind energy. Windmills (the precursor to today’s wind turbines) appear to have first been used in Greece around two thousand years ago.
How Wind Turbines Work
 How Wind Turbines Work
In a conventional power plant (fueled by coal or natural gas), combustion heats water to steam and the steam pressure is used to spin the blades of a turbine. The turbine is then connected to a generator, which is a giant coil of wire turning in a magnetic field. This action induces electric current to flow in the wire. The workings of a wind turbine are much different, except that instead of using a fossil fuel heat to boil water and generate steam, the wind is used to directly spin the turbine blades to get the generator turning and to get electricity produced.
The inner workings of a wind turbine consist of three basic parts, seen in the figure below. The tower is the tall pole on which the wind turbine sits. The nacelle is the box at the top of the tower that contains the important mechanical pieces – the gearbox and generator. The blades are what actually capture the power of the wind and get the gears turning, delivering power to the generator. The direction that the blades are facing can be rotated so that the turbine always faces into the wind, and the pitch of the blades (the angle at which the blades face into the wind) can also be adjusted. Pitch control is important especially in very windy conditions, to keep the gearbox from getting overloaded.
The amount of power (in Watts) collected by a wind turbine is explained in the following equations:
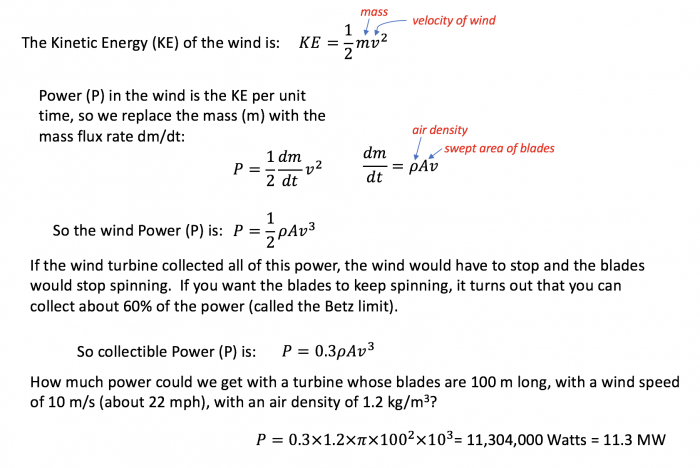
This figure explains the physics of wind power. So we begin with this notion of the moving wind having some kinetic energy which is 1/2 m v2 . So that is kinetic energy. Power is related to energy in the following way: It is energy per unit of time. So if we want the power that we can get from that moving wind, we have to take the kinetic energy, and then the mass flux rate instead of just the mass. Mass flux rate is how much mass is moving per unit of time. That is dm over dt, change in mass over change in time. And that is equal to the air density times the area swept out by the windmill blades times the velocity, so that velocity and area multiplied together gives you something with the units of measure are cubic meters per second, and then you multiply that by the density and that gives you kilograms per second and that’s the mass flux rate. If you put all that together you see the wind power is equal to one half times the air density times the area swept by the blade times the velocity cubed. So you see the velocity is super important in this. Now then it turns out that there is an efficiency limit, something called the “ Betts Limit” that means that the power you can actually collect is 0.3 times the air density times the velocity cubed.
This is clearly a lot of power! But, mechanical inefficiencies related to the gears and the generator mean that we might only get 30% of this figure, but that is still a lot of power from one turbine.
All wind turbines have a minimum wind speed that differs depending on the size but is typically about 4-5 m/s (10 mph) and maximum wind speed above which they shut down to avoid damage, usually around 20-25 m/s (about 50 mph). Most wind turbines have a maximum spinning rate, reached a bit above the minimum velocity, and when the wind speeds up, the pitch of the blades is adjusted so that the rate of spinning remains more or less constant. The figure below shows a typical "power curve" for a small wind turbine.
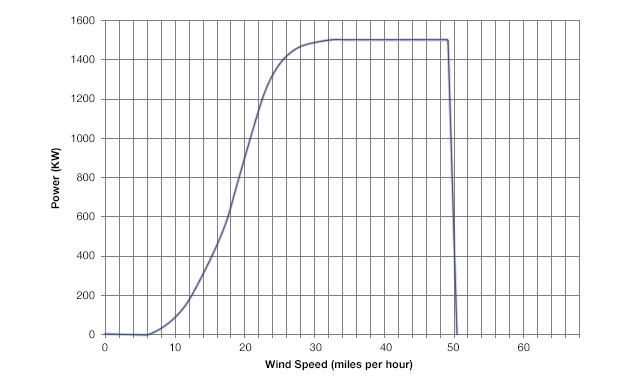
This figure shows the power curve for a 1.5 megawatt wind turbine. So on the Y-axis is the power and the X-axis is the wind speed in miles per hour. And what you can see is that there is sort of a threshold speed that is something like 6 miles per hour wind speed you start to get some power. And as the wind speed increases, the power output rises rapidly until you get to about 30 miles per hour. At that point the power sort of saturates and flattens out and with more wind you don’t get any more power. So it reaches its capacity at 1.5 megawatts and it generates that up until 50 miles per hour and above that the power drops off rapidly because the wind turbine has a shut off mechanism will turn off if the wind gets going to fast because of the turbulence that can cause damage to the wind turbine. So they just shut down if the winds get to great.
The wind, as you may have noticed, is highly variable in any given place, but as a general rule, it is stronger and steadier as you rise up above the ground. This is because friction between the wind and the land surface slows the wind. But there is also a lot of regional variation in the wind velocity. Both of these factors (elevation above the ground and location) can be seen in the maps below, showing the average wind speed in the US at two different heights.
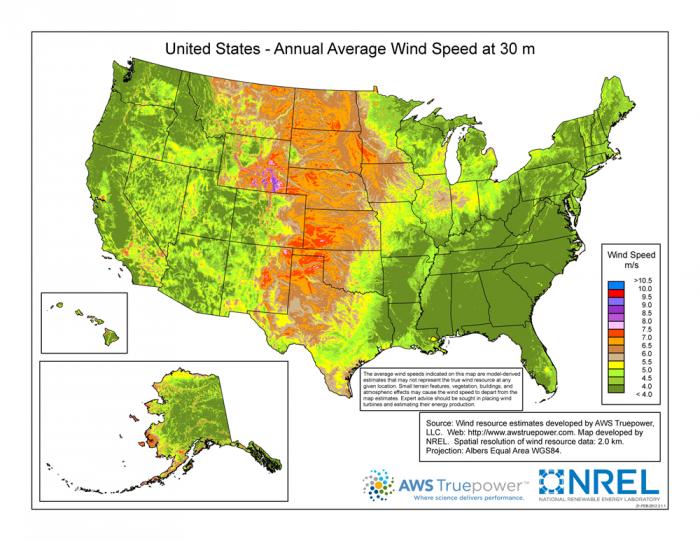
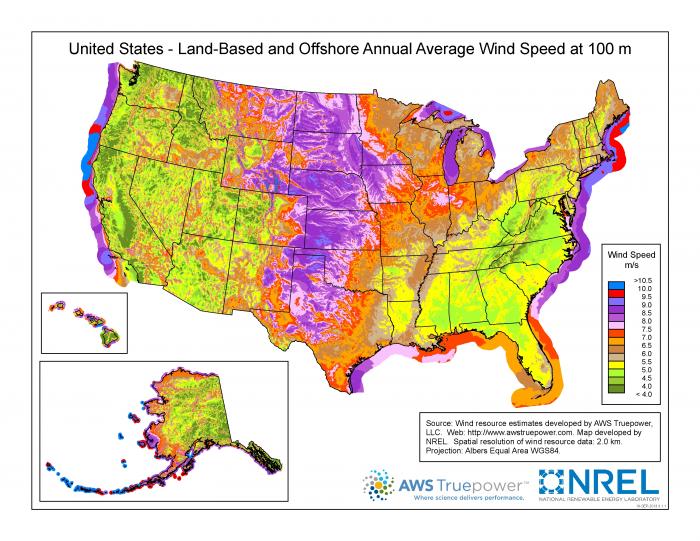
The graphs above show annual average wind speeds in the US at 2 different heights above the ground surface. For reference, 10 m/s is 22.3 mph. You can see that the wind speeds at 100 m are far greater than at 30 m — this is the friction effect of the land surface (which is minimal above large water bodies). As you can see, the Great Plains have great wind potential, as do the Great Lakes and offshore areas on both coasts.
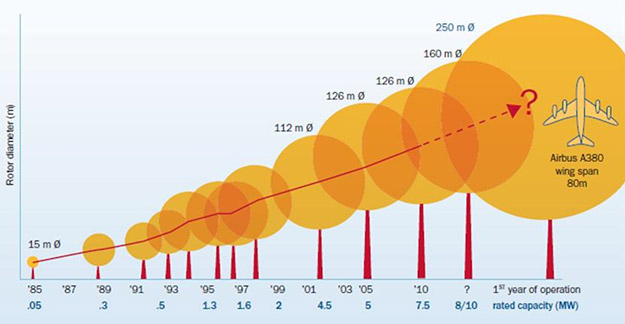
The area covered by the turbine’s blades is another important factor in determining power output. While wind turbines are available in a wide variety of capacities, from a few kilowatts to many thousands of kilowatts, it’s the larger turbine sizes that are being deployed most rapidly in wind farms. Several years ago the image on the right side of the figure below of a Boeing 747 superimposed on a wind turbine gave an astonishing representation for the scale of the state of the art wind technology. Now turbine rotor diameters are approaching the size of the Washington Monument!
Activate Your Learning
Given that the area of wind captured by the turbine is proportional to the square of the radius (essentially the length of the blade), if you were to double the length of a wind turbine's blade, how much more power would that turbine generate? Assume that wind speed and all other variables remain the same.
Click for the answer.
Market Deployment of Wind Energy
 Market Deployment of Wind Energy
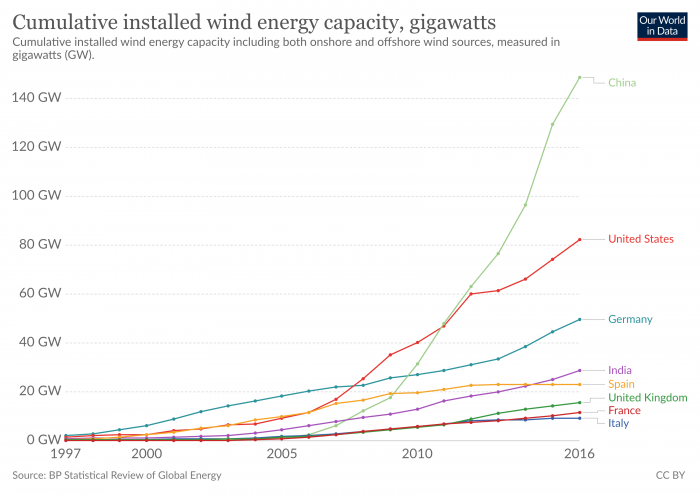
Over the last 20 years, growth in the total installed capacity of wind energy generation across the globe has been growing rapidly. Germany was the first country to lead the development of wind power, but the US and China have dominated the growth since 2010. China is especially impressive in terms of its recent growth.
Part of the reason for this growth is the steady decline in the cost of wind energy, as discussed in the previous section on solar energy. But government policies are another important factor. The United States has one of the most volatile markets for wind energy in the world, while those in Europe and China have been among the most stable. This is due in part to differences in how governments in these countries treat wind energy. In many parts of Europe, wind energy (and other renewable generation technologies) enjoy subsidies and incentives known as feed-in tariffs. The feed-in tariff is essentially a long-term guarantee of the ability to sell output from a specific power generation resource to the grid at a specified price (typically higher than the prices received in the market by other generation resources). The United States, on the other hand, has favored a system of tax incentives called the “Production Tax Credit” (PTC) to encourage renewable energy deployment. In theory, a tax incentive should not work much differently than a feed-in tariff (both are just payments based on how many kilowatt-hours are generated). But the PTC has historically needed to be re-authorized frequently by the US Congress – this “on-off” policy strategy has been a major factor in the volatility of wind energy investment in the US as shown in the figure below. It is worth noting that the PTC was recently renewed for 2013, but will lapse again at the end of 2019, so it is difficult to say what impact it will have on wind investment going forward.
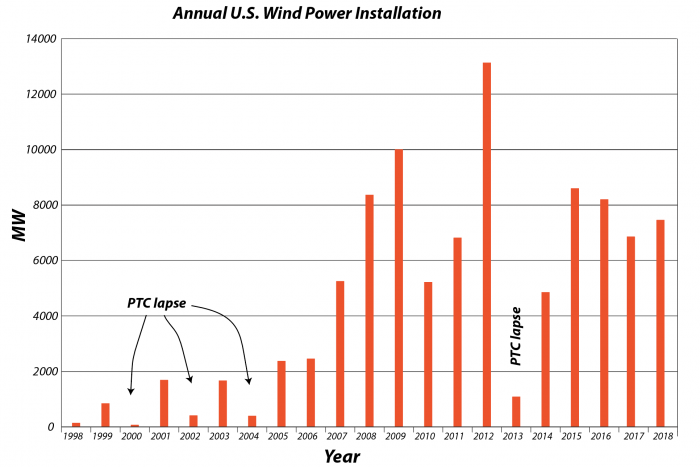
This bar graph shows the history of the annual US wind power installation. The heights of the bars represent the amount of new wind energy installed each year. So this goes from 1998 until 2019. And there are a couple of interesting things: One is there is very unsteady growth pattern over time, and the second is that there are four periods here, four years where there are very little in the way of new wind energy installation. And that’s because there was a lapse in this policy device we us in the US that encourages using wind energy called the Production Tax Credit ( PPC). This has to be renewed by Congress on a regular basis and they can’t get their act together all the time to renew this. So if that lapses then there are no incentives for wind power companies to install new turbines to generate more electricity. So what we see here is this kind of erratic history of production because the incentives are not reliable.
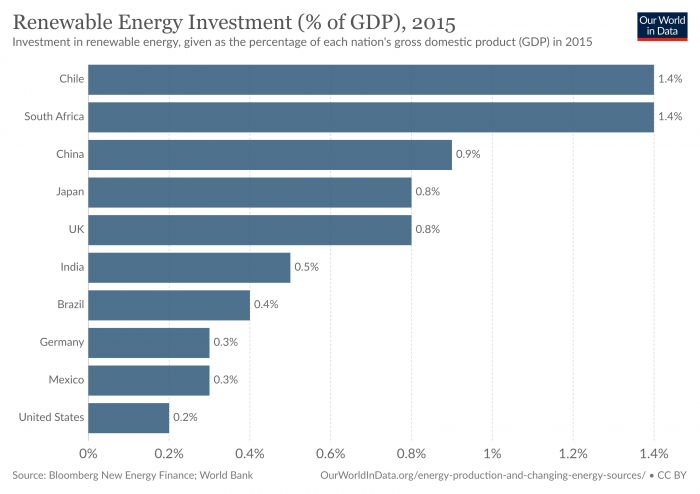
The above makes it clear that government policies are important to the growth of renewable energy production (both wind and solar). In a very real way, you can think about these policies (feed-in tariffs or tax credits) as a form of investment. Governments can also provide investments in the form of funding for basic research related to these technologies. In general, these investments do not add up to a huge amount when seen in the context of a country's gross domestic product (GDP), which is a measure of the size of the economy, as seen in the figure below.
The Potential Wind Energy Resource
The Potential Wind Energy Resource
A quick look at an annually-averaged wind map of the world (below) shows the regions of the world that are best suited for the production of wind energy in colors ranging from yellows to red (where the average winds are at least 9.75 m/s or 20 mph). The offshore regions are clearly the best in terms of the energy potential, but not all of these offshore regions are close to where people live. Even for onshore portions of the world, the wind energy potential does not always coincide with where the people are concentrated. This points to the necessity of new transmission lines to deliver this wind energy to major population centers.
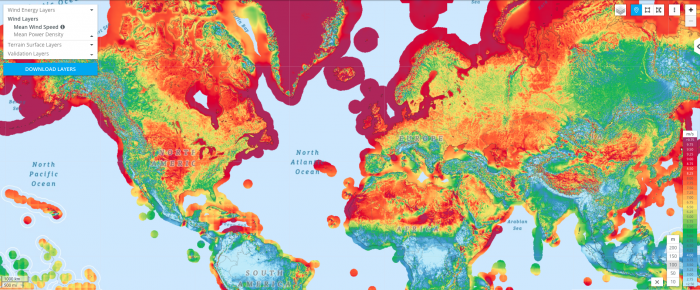
So, just how much energy could be produced by the wind? In 2009, a group of scientists makes some calculations to estimate the potential for the world and the US, using wind data and some assumptions about the size and spacing of the turbines. They assumed 2.5 MW turbines on land, and 3.5 MW turbines offshore, which were big for that time. They assumed that you could only place the turbines in unforested, ice-free, nonmountainous areas away from any towns and that the turbines had to be spaced by several hundred meters so they do not interfere with their neighbors. They further assumed that each turbine generated just 20% of its rated capacity to account for mechanical problems and intermittent winds. What they came up with is summarized in the table below, and it is pretty remarkable. The units here are exajoules (EJ = 1 x 10¹⁸ Joules) of energy over the course of a year. For reference, in 2018, the US total energy consumption (not just electrical energy) was 106 EJ and the global consumption was about 600 EJ. So, with just onshore wind energy, the potential is more than twice what we consume in the US, and more than 4 times the global consumption. But getting there is a matter of installing a lot of wind turbines!
| Region |
World |
Contiguous US |
|---|---|---|
| Onshore | 2484 | 223.2 |
| Offshore 0-20m | 151 | 4.32 |
| Offshore 20-50m | 144 | 7.56 |
| Offshore 50-100m | 270 | 7.92 |
| Total | 3024 | 244.8 |
Now let's consider a more practical question — how much wind energy have we managed to produce and can we somehow project the past trends into the future? The figure below shows the global history of wind energy (solar is plotted too just for comparison), and you can see that it is growing fast.
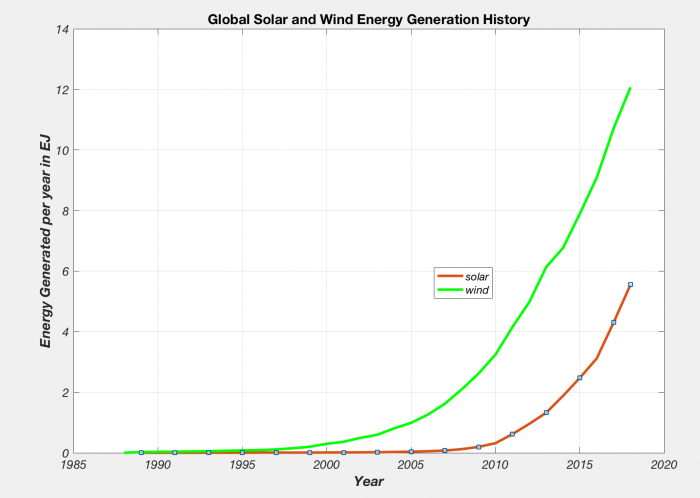
Both of these curves are growing exponentially, and the history so far suggests a growth of about 25% per year on average. If we assume that they continue to grow in the further following this exponential growth, we can project where we'll be at any time in the future. Below, we see where we might be in the year 2030, just eleven years from now. What you see is that we end up with vast amount of wind energy by 2030 — if it grows at the same rate it has been growing at, we end up with almost 300 EJ per year, about half of the current global energy consumption, and if it grows at a smaller rate of 20% per year, we still end up being able to supply about 20% of the total global energy demand.
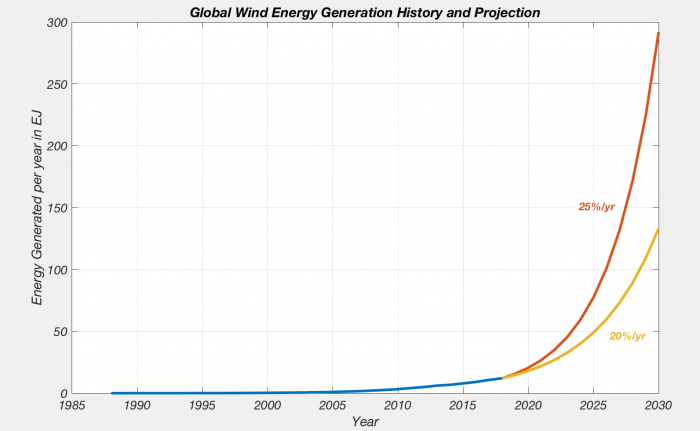
This figure shows the wind energy generation history from 1987 up until 2017 or 2018 in blues, and then the projection into the future at 2 different growth rates. So we know that the history up until now, wind energy generation has grown at about 25% per year, which is a remarkable growth rate. It is a continuous at that and we will follow this red curve and end up by the year 2030, so that’s just another 12 years from now or 10 years from now, we will have 300 exit joules of energy produced through wind. And if it grows at a slower rate of 20%, we will end up with something like 130 exit joules of energy per year. For reference, remember globally all of our energy consumption totals to about 600 exit joules of energy. So if it keeps going in the next 10 years as it has been going, we would be able to get half of our energy from wind alone, which is quit a remarkable thing. The power of exponential growth that we are looking at.
Barriers to Additional Wind Energy Development
Barriers to Additional Wind Energy Development
It is worth noting that, as with solar, wind investments are not always happening in the windiest areas. The reality is that there are a large number of factors that influence the development of wind energy globally. As the technology for wind energy has improved, other factors have also come together to create market drivers for wind power. These drivers include:
- Declining Wind Costs
- Fuel Price Uncertainty
- Federal and State Policies
- Economic Development
- Public Support
- Green Power
- Energy Security
- Carbon Risk
Earth: The Operator's Manual
Despite all of these barriers to wind energy deployment, wind is, in fact, one of the fastest-growing sources of power generation in the world. Wind energy is being embraced in areas that have traditionally favored low-carbon energy development as well as in areas that have a long history of fossil fuel extraction and use. The following video explains how two very different regions - Denmark and Texas - have embraced wind energy.
Video: Yes, in My Backyard (aka YIMBY!): (9:08)
Narrator: Are there other examples of communities and nations that have begun the transition away from fossil fuels? What does it take to welcome the turbines and solar farms of the new energy system, and say, "Yes, In My Backyard." This is the story of two communities that at first look very different. Samso is a small island off the Danish mainland. West Texas is a vast, dry expanse in America's South. What both have is abundant wind. At times, Samso produces more electricity than it uses, exporting surplus power to the Danish mainland. And Texas wind now generates as much power as the next three U.S. states combined. Samso and West Texas both solved the NIMBY, not in my backyard challenge that has stymied so many renewable energy projects. It's not easy, but with patience, and persistence, and the efforts of the right people, it can be done.
Soren: Okay-- My name is Soren Hermansen, and I am the Director of the Samso Energy Academy. Samso means, in Danish, means the Meeting Island-- when you make a circle around all of Denmark, then Samso is right in the center of the circle.
Narrator: But it wasn't geography that brought Lykke Friis, then Denmark's Minister of Climate and Energy, here in mid-2011. It was why and how this community had turned NIMBY into "Yes, in my backyard."
Lykke Friis: Well, Samso is a pioneering project, in the sense that Samso, way back, decided that Samso should become independent of fossil fuels. Narrator: Before its transformation, people thought of Samso as just a cute tourist community, busy in summer, empty and desolate in winter. Now people come here not just to see the turbines, but to understand the process that got the community to welcome wind energy. After a national competition, Samso was selected by the Danish government to be a proof of concept for how to transition from fossil fuels. But it was up to individuals like Soren Hermansen, with the passion and skills to effect change, to figure out just how. Soren: So when we won, the normal reaction from most people was, "Yeah, you can do this project, that's OK, but just leave me out of it."
Narrator: Samso has a deep attachment to its past and values its traditional way of life.
Soren: But gradually we won their confidence in establishing easy projects to understand, and also easy projects to finance. Because basically, it's all about, "What's in it for me?" Because it's not convinced idealists or green environmental hippies who lives here.
Narrator: Soren, a native of the island, convinced some of his neighbors to become early adopters. They found success and spread the word. Jorgen Tranberg operated a large and profitable herd of milk cows. After initial reservations, he invested in a turbine on his own land. When that went well, Jorgen became part owner of one of the offshore turbines.
Soren: Farmers, they have to invent new things and be ready for changes. So when they see a potential, they look at it, no matter what it is. They look at it, say, "Could I do this?" And if they see fellow farmers do the same thing, they are quick to respond to that. So even being very traditional and conservative in their heads I think they have this ability of making moves and do things because they have this independency in them. A farmer is a free man-- maybe he owes a lot of money to the bank, but he's still a free man in his thinking.
Narrator: It was seeing what was in it for them and for their community, that won over landowners in West Texas. And it took one of their own, a man whose family had deep roots in Roscoe's cotton fields, to educate them about wind farming. Cliff Etheredge: Well, I'm really a farmer-farmer, you see. I farmed for almost over 40 years. We're in-- right in the middle of the Roscoe Wind Farm. And we've got about 780 megawatts of production, that's per hour, enough electricity for about 265,000 average homes. Narrator: Roscoe had no oil and faced hard times in the early '90s, but it did have wind.
Cliff: When this land was acquired there was absolutely no value to the wind. Fact is, it was a severe detriment, because of the evaporation of the moisture.
Narrator: Cliff, like Soren, had to work with his neighbors to get them ready to accept wind turbines.
Cliff: The first thing farmers want to know is, "Well, how much is it going to cost me?" It costs them nothing. "What's it going to hurt?" Three to five percent of your farmland is all it's going to take up. You can do what you want to with the rest of it. Then it came down to, "Well, how much money is this going to make me?"
Narrator: Cliff did his research and checked his numbers with wind experts and the Farm Bureau.
Cliff: Then I was able to go to our Landowners' Association and show them, where they had been receiving 35 to 40 dollars an acre, then the landowners could expect somewhere in the neighborhood of three times that.
Narrator: In fact, farmers stand to make 10 to 15 thousand dollars a year, per turbine, just from leasing the wind rights.
Cliff: There was no guarantee in it from the very beginning, but sure enough we've got, I think, in the neighborhood of 95 or more percent of our area that accepted the wind farm.
Narrator: In both Samso and West Texas, individuals saw economic benefits. But the whole community, beyond the investors and land-owners, benefited too.
Cliff: Because of the wind farm, now, and the people working in the wind industry, now we've got jobs available and opportunities for young people to come back from college or from technical school or from whatever. It's just been a Godsend.
Narrator: For Kim Alexander, superintendent of the Roscoe school district, that godsend translates into dollars.
Kim Alexander: In 2007, prior to the wind values coming on our tax roll, our property values were at about 65 million dollars. And then, that wind development, they jumped to approximately 400 million dollars, to 465 million dollars.
Narrator: The school district will get more than 10 million dollars over a decade. That guaranteed revenue stream unlocked additional funding. School buildings, some dating from the 1930s, could be updated, and computer labs added.
Cliff: This is an indication to me of what can be done for rural areas, and will be done, all the way to Canada-- bringing life and prosperity back to these rural communities that are suffering just like we have.
Narrator: The same oil shock that got Brazil started on ethanol, got Denmark started on manufacturing wind turbines, just in time to compensate for a decline in its shipbuilding industry.
Lykke: And it's also good for the economy, in terms of export. I mean, 10 percent of Danish exports comes from the cleantech area.
Narrator: Energy and environment always require tradeoffs, such as clear vistas versus clean energy. It's something that communities have to make time to work through. Cliff, for one, believes it's worth it.
Cliff: Everything, the schools, the churches, the civic organizations, all the businesses will benefit from this. It will increase, hopefully, our town's populations, and our economics.
Kim Alexander: My granddad used to say, not realizing he was prophetic, but "If we could sell the wind, we'd be wealthy." Well, who would have ever thought we'd be able to sell the wind?
Narrator: For Samso, Denmark, and Texas, clean energy brought economic benefits and energy security. But replacing fossil fuel emissions with wind power has other advantages.
Lykke: And let's not forget, also good for climate and health, and such, and that's a very important argument.
Cliff: We've got a constant wind resource here, that's tremendously valuable, and as opposed to oil and gas, it'll last forever, and it doesn't pollute anything.
We have already mentioned the US Production Tax Credit, which is responsible for a good amount of the trend in US wind energy investment – both up and down! A decline in wind investment in 2010 and 2011 was due in part to the global financial crisis. A drop in natural gas/wholesale electricity prices has made some planned projects less competitive than originally expected and halted development. There has also been a slump in the overall demand for energy. Another factor that limits the growth of wind power capacity is the constraint on the transmission infrastructure. As can be seen in the wind capacity map on the previous page, many of the locations that experience the windiest conditions are not close to coastal population centers. The cost of upgrading this infrastructure is significant — perhaps $30 to $90 billion in the US by the year 2030 according to some estimates. This seems like a huge amount, but consider that our government spends about $20 billion each year in direct subsidies to the fossil fuel industry, which would sum up to $200 billion by the year 2030. In light of that, the upgrade cost for better transmission lines is a bargain!
Note
A great resource for information on the current state of the US wind market and the wind industry, in general, is the US Wind Technologies Market Report [29]which is annually published by the Mark Bolinger and Ryan Wiser of the Lawrence Berkeley National Laboratory.
Discussion Assignment
Reminder!
After completing your Discussion Assignment, don't forget to take the Module 6 Quiz. If you didn't answer the Learning Checkpoint questions, take a few minutes to complete them now. They will help your study for the quiz and you may even see a few of those question on the quiz!Discussion Question
Objective:
Evaluate who you think is responsible for maintaining infrastructure (power lines, meters, emergency repairs) when people generate their own renewable energy at home. Is it fair for those who can't afford new technology to shoulder the burden? Does charging a fee discourage people who could be installing solar and wind technology at home from doing so?
Goals:
- Find reliable sources of information on the internet
- Communicate scientific ideas in language non-scientists can understand
Read:
Arizona's New Fee Puts a Dent in Rooftop Solar Economics [30]
Salt River Project: Changes to Solar Pricing for New Rooftop Solar Customers [31]
SolarCity Lawsuit Alleges Arizona Utility's Fee Hurts Solar [32]
Description:
Perhaps you’ve heard a story about a person or family who installed solar panels or a wind turbine at their home, and during certain times of day when conditions are right, they can sit and watch their power meter run backward, feeding power back onto the grid. Sounds like a win-win situation, right? Those people are lowering their own dependence on fossil-fuel derived energy, and even supplying power derived from renewable resources to the big power companies to redistribute to other customers. So what’s the catch?
The problem is, as more customers in certain markets (for example, sunny desert areas like New Mexico and Arizona) install home solar and reduce their bills to almost nothing, the power companies are pulling in less profit. Which may not seem like a big deal – times change, new markets emerge and old ones die out. Newspapers have felt the pinch, and the postal service, and cable television. Companies have to keep up or make way. Except solar and wind can’t provide power 100% of the time. People who power their homes with these renewable resources still rely on the grid to provide power at night, or on cloudy or windless days. Maybe they give as much power back to the grid as they take from it over the course of a month, keeping the meter near zero. Now who is paying for the maintenance of the power lines that shuttle that power to and from these homes?
The power companies are paying, of course. But in a more pessimistic (or realistic) sense, the customers who can’t afford solar or wind technology will be the ones who will pay in the long run as power companies raise their prices to cover the loss of revenue. So in a sense, poorer people will be forced to subsidize the power grid while the wealthy sit back and smugly watch their meters run backwards.
Power companies in several states, including Arizona and Oklahoma, are beginning to charge fees of as much as $50-100 per month for customers who create their own solar or wind energy. This is a drastic turnaround from government tax breaks designed to encourage people to install their own renewable power technology. Proponents of renewable energy argue that such high fees will only serve to discourage more people from installing solar panels and wind turbines at home, proliferating our dependence on fossil fuels.
What do you think? Should the power company charge individuals a monthly fee to generate their own power? Who will determine what a reasonable charge would be?
Instructions
Summarize your thoughts on home power generation and responsibility for maintaining infrastructure in a 200-250 word discussion post. Give specific examples of why you think individuals should or should not be responsible for maintaining utilities. Your original post must be submitted by Wednesday. In addition, you are required to comment on one of your peers' posts by Sunday. You can comment on as many posts as you like, but please try to make your first comment to a post that does not have any other comments yet. Once you have an idea of what you want your post to be, go to the course discussion for your campus and create a new post.
Scoring Information and Rubric
The discussion post is worth a total of 20 points. The comment is worth an additional 5 points.
| Description | Possible Points |
|---|---|
| well-reasoned analysis in your own original post (200-250 words) | 20 |
| well-reasoned comment on someone else's post (75-100 words) | 5 |
Summary and Final Tasks
Summary
Humans have been harnessing wind energy in various forms for thousands of years, although the types of wind turbines that you may see sprouting up in various places (if you happen to live in a windy area) have been used widely for only the last few decades. Wind is one of the fastest-growing energy sources on the planet; in many areas, the amount of new electric generation capacity from wind turbines is outpacing the amount of new capacity from natural gas, coal or other fossil fuels. While European countries have embraced wind energy with larger financial incentives (and in some cases, generate a larger percentage of their electricity from wind energy than just about anywhere else in the world), China and the United States are still the world’s biggest wind markets. Despite falling costs and progressive designs that are friendlier to birds and bats, wind energy growth is still hampered in many areas by high costs, unpredictable incentives and ironically enough, a bad environmental rap.
Reminder - Complete all of the Module 6 tasks!
You have reached the end of Module 6! Double-check the [33]Module Roadmap to make sure you have completed all of the activities listed there before you begin Module 7.