Hurricane Katrina: August 2005
Hurricane Katrina’s historic impacts on New Orleans and Gulf Coast communities in Louisiana, Mississippi, and Alabama in 2005 serve as an important reminder of the destructive forces of hurricanes, most notably from storm surge. Katrina’s storm surge was so destructive that most gauges broke during the storm, making it difficult to get actual measurements. High-water marks in eastern Louisiana and western Mississippi indicate that the maximum surge was close to 9 meters (30 ft.).
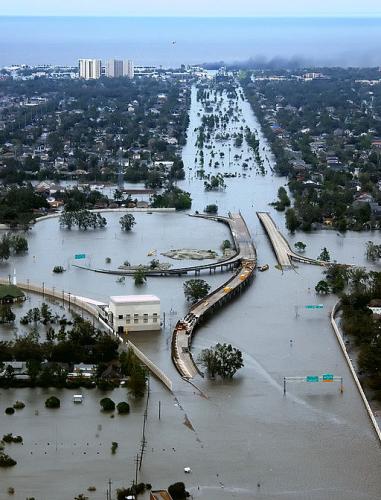
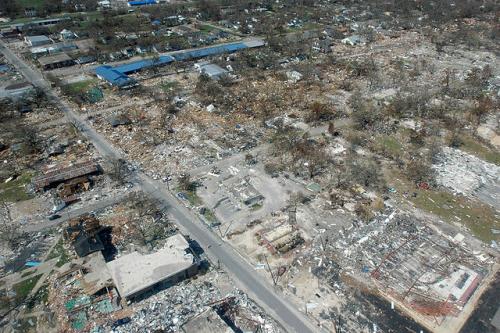
In New Orleans, the failed levee systems allowed billions of gallons of seawater to flood 80% of the city, as well as some suburban areas. The mayor called for a mandatory evacuation approximately 24 hours before landfall. This was not enough time for many people to make necessary plans, and a large portion of the population of New Orleans was living in poverty and had no means of transportation, while others did not heed the evacuation order for a variety of other reasons. After the initial partial evacuation prior to the storm, the entire population eventually was evacuated from the city following the flooding. For many families, the evacuation dragged into a long-term or permanent situation because they had no home or jobs to come back to. Tragically, families were dispersed, or family members lost. Meanwhile, outside the levee system, there were areas that were completely destroyed, especially to the east of New Orleans and the Mississippi Gulf Coast communities from Bay St. Louis to Biloxi. Katrina will have lasting effects on these communities for decades to come. So, how is it that this storm became one of the most significant global storms in a century?
Scientists from NASA's Goddard Space Flight Center produced an excellent short video (3:03), "Katrina Retrospective: 5 Years Later," that explains many details of the storm’s development and path. Data from numerous weather satellites were compiled to produce these magnificent 3D animations that illustrate exactly what happened before, during, and after the storm. In the video, you will notice the role of warm surface waters in the Gulf of Mexico as they contributed to increased rates of atmospheric uplift, which resulted in strengthening the storm. You will also see how the bands of precipitation moved across the region and the distinct wind patterns that moved the storm over Florida, out into the Gulf and eventually steering it right toward the eastern tip of the boot of Louisiana, and southern Mississippi.
Video: Katrina Retrospective: 5 Years Later (3:04)
Required Reading
Please read from NOAA – A short summary of the meteorological impacts of Katrina: "Extremely Powerful Hurricane Katrina Leaves a Historic Mark on the Northern Gulf Coast - A Killer Hurricane Our Country Will Never Forget".
The Times-Picayune newspaper produced an excellent interactive map-based time-series animation of the impact of Hurricane Katrina as it came ashore. Anatomy of a flood: How New Orleans flooded during Hurricane Katrina tracks the flooding from levee and floodwall failures as they happened. Each scene includes pop-up dialogue boxes that will guide you through the storm. As you work through the scenes, play special attention to the areas that became flooded (shaded in blue) and the areas where levees were compromised and breached, either due to poor construction and failure or surge levels that overtopped them. Note that the water flowed into the portions of the city that lie below sea level and filled the shallow “bowl” with up to 15 feet of water. In the end, the only areas that sustained little, or no flood damage were located on the natural levees of the Mississippi River or the artificially-created higher ground near Lake Pontchartrain (location of the University of New Orleans).
The storm made its second landfall at Buras, Louisiana (it had already made landfall in Florida before entering the Gulf and strengthening). After crossing the Mississippi River bird’s-foot delta and entering the shallow bays including Lake Borgne in Louisiana and Mississippi Sound near the state line with Mississippi, it made its final landfall near the state line and delivered its historic storm surge to the coastal areas of both states. Water was pushed into the shallow bays, including Lake Pontchartrain and Bay St. Louis, with disastrous consequences. The storm left a trail of destruction, the magnitude of which is hard to imagine without seeing it for yourself.
New Orleans and the low-lying communities to the east that took the brunt of Katrina’s storm surge were essentially crippled for months. It took weeks to pump the water out of New Orleans, as all the pumps that usually drain the city were damaged by the flooding. Pumps were brought in from around the world to drain the city. All that remained of some communities were concrete slabs and pilings. The cities, including the entire city of New Orleans, were without basic services such as power, water, and sewage treatment. Without these utilities, the residents could not return to their homes. Many stories are still told of survival and heroic rescue efforts, as well as people managing to survive by camping out in their wrecked properties during the sweltering September heat following the storm.