Assessing Vulnerability: The Vulnerability Scoping Diagram
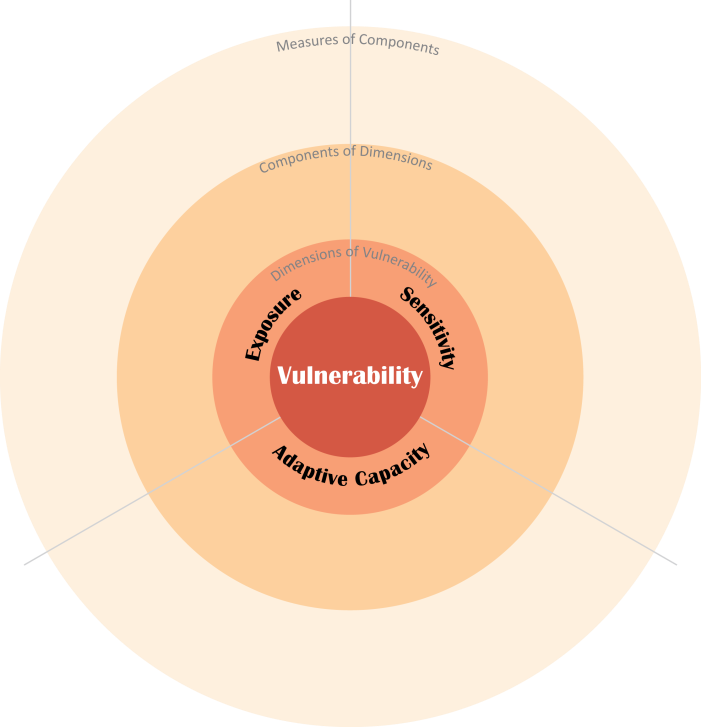
Figuring out the vulnerability of a person, place, or thing is a surprisingly complex task. To simplify this task, scientists have developed an assessment tool known as the Vulnerability Scoping Diagram (VSD). Moving from the center outward, the VSD defines the system being studied, divides vulnerability into its three dimensions (exposure, sensitivity, and adaptive capacity), defines components of these dimensions, and then assigns measures of these components. Each of these pieces of the VSD is described in more detail below.
Examples of VSD Explained
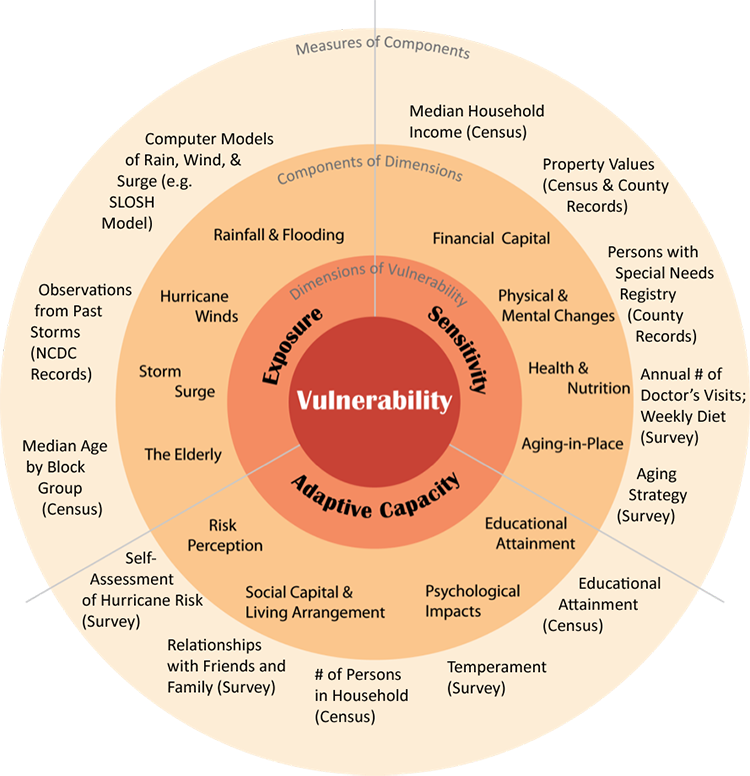
The above figure shows an example of how the VSD can be used to assemble a holistic picture of the many different components that shape vulnerability to coastal hazards. This VSD shows the vulnerability of the elderly to storm surge in Sarasota, Florida during the next decade. Starting with exposure, we see that the vulnerability of the elderly depends partly on the characteristics of the hazard itself – including storm surge, winds, and flooding – and partly on the location of the elderly relative to these hazards. The sensitivity of the elderly is a function of the age and income of the population, as well as their physical and mental health. The ability of the elderly to adapt to hurricanes – their adaptive capacity – is determined, among other factors, by how they perceive hurricane risks, the strength of their connections with family and friends (social capital), their access to living space outside of the hazard zone, and their education. Hence, elderly persons in Sarasota who are exposed to a large hurricane storm surge, are sensitive due to limited financial resources and poor health, and have few connections to friends or family would be quite vulnerable. In contrast, elderly persons who are exposed to the same storm surge but are healthy and can draw on significant financial and social resources would be much less vulnerable. Note that while this example describes some important components of vulnerability to coastal hazards, a completed VSD will often include many more components than are listed here.
There are many ways to measure these components of the vulnerability of the elderly to storm surge. Computer models can simulate the likely extent and intensity of exposure to hurricanes’ rain, wind, and flooding; these simulations can be compared to observations from past storms, which can provide additional information about hurricane frequency and severity. Census data can show how many elderly persons are living in areas that are exposed to these hurricane hazards. Census data can also provide the measures of financial capital (household income), social capital and living arrangement (number of persons per household), and educational attainment needed to assess these components of sensitivity and adaptive capacity. To measure other components (including physical and mental health or perception of hurricane risks), scientists may need to conduct their own surveys or request summaries of data sources that are not publicly available (such as the Sarasota County Registry of Persons with Special Needs).