Dimension 1: Exposure
Exposure is the degree to which people and the things they value could be affected or “touched” by coastal hazards.
Think about your favorite coastal location. What are the aspects of the natural and built (human developed) environment in that location that affect the likelihood that people or things they value will feel the impacts of a natural hazard there?
If the location is a house built on a beach on a barrier island such as the Outer Banks of North Carolina or South Padre Island in Texas, it is highly exposed to a potential coastal hazard, but it may be in a small community and the hazard (storm) may be low intensity. In this case, the exposure is not as high as, for example, if the location is New York City, and the hazard is a storm like Sandy. In this scenario, millions of people and things they value (including complex infrastructure and things of great cultural value) are exposed. Also, the hazard is high intensity, so this amplifies the exposure. This scenario is one of very high exposure.
The components one needs to consider when assessing exposure are as follows:
-
Hazard frequency and intensity
In Modules 4 and 5 you covered both storm and tsunami hazards and read about the intense Hurricanes Katrina, Sandy, Maria, Harvey, Dorian, and several others. It is well established that climate change is resulting in storms of increased intensity, although there is less evidence that the frequency is increasing. However, in some locations in the world tropical cyclones are a relatively common occurrence, so can be considered frequent. The pattern of tropical cyclone frequency is illustrated in the animation shown here.
Video: Hurricane Tracks Animation and Cumulative Map (00:14) No narration.
Tropical cyclones have a wide range of wind speeds that are used to classify their intensities. NOAA’s National Climatic Data Center has assembled the best track data for 11,967 tropical cyclones into a single database, called IBTrACS, with information from 1842 to 2012. Included in that database are estimates of wind speeds along the tracks of the storms. This image shows the output of that data. By coloring the maximum sustained wind speed over the course of a storm’s life, certain patterns arise. In contrast to the similar image of storm frequency, the Northwestern Atlantic shows a much greater spread of strong storms, whereas in the Pacific the strongest cyclones seem to group near the Philippines. Credit: NOAA National Environmental Satellite, Data, and Information Service (NESDIS). NOAA Environmental Visualization Laboratory.
Credit: NOAA SOSCoastal communities are increasingly exposed to extreme weather events including categories 3, 4, and 5 hurricanes and storms that generate extreme rainfall events. For example, you need only look at the 2017 hurricane season and consider Hurricane Harvey’s impact on Houston and Hurricane Maria’s impact on Puerto Rico.
-
Location and Landscape
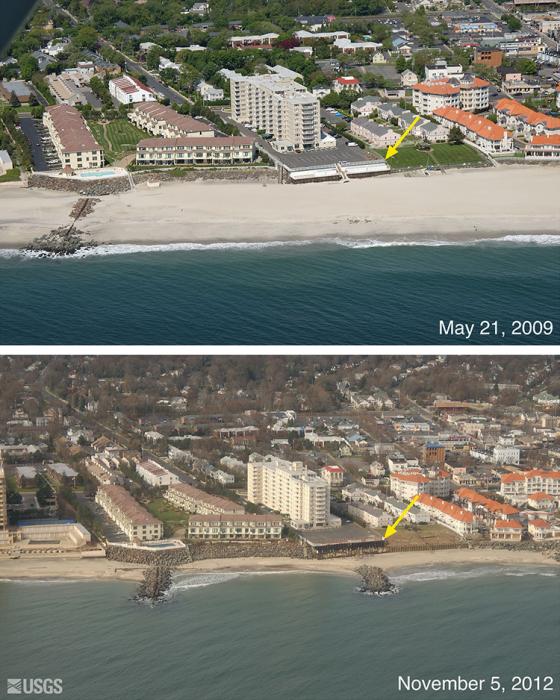 Oblique aerial photographs of Long Branch, New Jersey from before and after Hurricane Sandy. Note how the flood control structures (groins) have shaped the exposure to storm surge and beach erosion.
The physical features of the coastal landscape play a major role in determining exposure. For example, the low-lying coastline of southeastern Louisiana exposes the city of New Orleans and nearby communities to hurricane storm surges from the Gulf of Mexico. Complicating the effects of low elevation features such a narrow bays and inlets that can amplify storm surge. In Module 6 you looked at many case studies of coastal hazards and their impacts, including Super Typhoon Haiyan (Yolanda) that devastated Tacloban City in the Philippines in 2013. Tacloban is another city with a large, dense human population situated close to the ocean on land that sits at a very low elevation. But in addition, Tacloban is in San Pedro Bay. Watch the storm surge simulation of Typhoon Haiyan below to see the effect of magnification of surge height as it enters the confines of the bay.
Video: Storm surge of Super Typhoon Haiyan making landfall (00:10) No narration.
This video is a simulation of the approach and impact in Tacloban of the storm surge of Super Typhoon Haiyan. It illustrates how the magnitude of the storm surge increases as it enters a shallow bay such as San Pedro Bay, where Tacloban sits. The result of this unfortunate combination of hazard intensity and location was the loss of 4,000 lives in Tacloban city alone.
Credit: Maarten van Ormondt -
Density of People and Property
Population density on Earth can be explored using this NASA Earth Observatory image. Take a minute to explore this interactive Night Light image from 2016. Consider how this imagery illustrates the distribution of the human population on Earth. It certainly shows the large urban areas well. But one thing to keep in mind is that some locations will show as brighter at night not only due to a greater or denser population, but because of the economics of the area. A wealthier country will have a better and more reliable energy supply.
We have already considered examples, such as Typhoon Haiyan, and Superstorm Sandy, where very densely populated areas are impacted by severe coastal hazards.
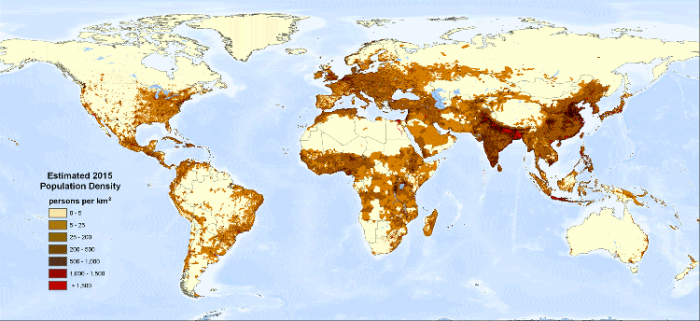 Global population density.Credit: United Nations Environment Programme, Global Environmental Alert Service Center for International Earth Science Information Network - CIESIN - Columbia University, and Centro Internacional de Agricultura Tropical - CIAT. 2005. Gridded Population of the World, Version 3 (GPWv3): Population Density Grid, Future Estimates. Palisades, NY: NASA Socioeconomic Data and Applications Center (SEDAC). Accessed August 15, 2023.
If this world population map and that of global hurricane intensity shown above are compared, we can see that the Atlantic seaboard of the U.S., as well as the east coast of China, are examples of places with high population density coinciding with high exposure to intense cyclones. Superstorm Sandy was unusual in size and intensity for a late-season storm hitting the northeastern U.S., but based on the map of storm intensity, it was not a complete anomaly. Adding the fact that Sandy, with its incredibly large diameter, impacted so many of the densely populated cities of the eastern seaboard, this was a perfect example of high exposure of people and property. In Module 6 you read about the circumstances of Sandy and the fact that these population centers (including New York, Boston, Philadelphia, ….) are home to 50 million people with an economic output of $3.6 trillion/year. The area definitely has a high exposure to hurricanes as the climate warms.
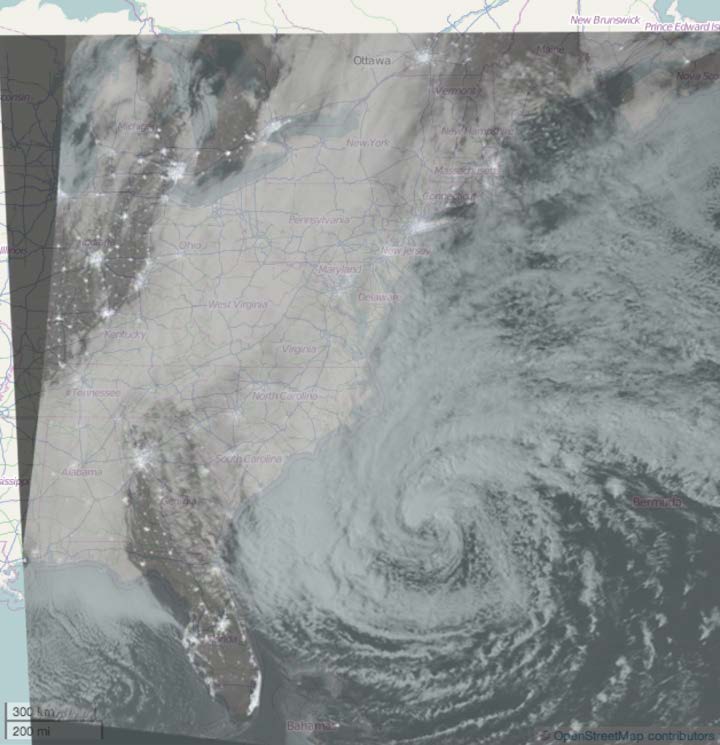 A nighttime image of Hurricane Sandy, with lights of major cities on the U.S. east coast visible through its swirling clouds, overlaid on top of a map of the U.S. eastern seaboard.Credit: NASA: Sandy and OpenStreetMap