Module 11: Vulnerability to Coastal Hazards: Policy for Coastal Resilience
Module 11: Vulnerability to Coastal Hazards: Policy for Coastal Resilience
Introduction
In the last three modules of this course, we will explore the policy related to coastal hazards. The first of these modules (Module 11) will focus on the ideas of risk and vulnerability and the question of why coastal hazards cause more damage and suffering in some places than in others – and how policy can address these disparities and increase the resilience of the most vulnerable places. In Module 12, we will look at the emergency management cycle as it pertains to coastal hazards, thinking about the four stages of mitigation, preparedness, response, and recovery. In Module 13, we will examine policy pertaining specifically to sea level rise.
Module 11
We will explore this complex question “Why do coastal hazards cause more damage and suffering in some places than in others?” while applying lessons learned in earlier modules. We will examine the concepts of risk and vulnerability to a range of coastal hazards in coastal communities around the world.
Take a moment to think about how you might quickly answer the question above. If you brainstorm answers to this question with a friend or partner now, you may first start by discussing the physical aspects that lead to one place being more vulnerable than another, such as topography, geologic and geographic location in relation to hazards such as hurricanes or tsunami. This would be the beginning, but to really get to the answer in-depth, we must consider how the hazard we are thinking about affects the human elements of the place we have in mind. Who lives there? How many people, and how do they make their living? Are they rich or poor? Is the population largely made up of many more vulnerable people such as minorities, poor, elderly, or the sick? What kind of housing is there in the community? Is it designed to withstand the hazard? Are there industries and businesses in the community that could be at risk or that may pollute the community if affected by a coastal hazard? All these questions are asking: How vulnerable are this community and its inhabitants to a coastal hazard?
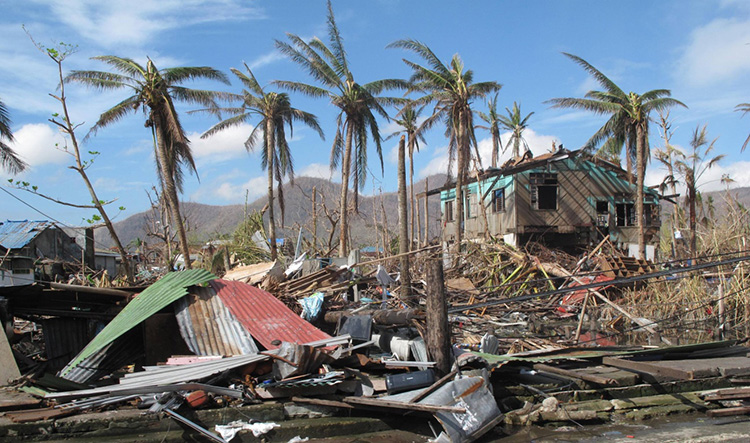
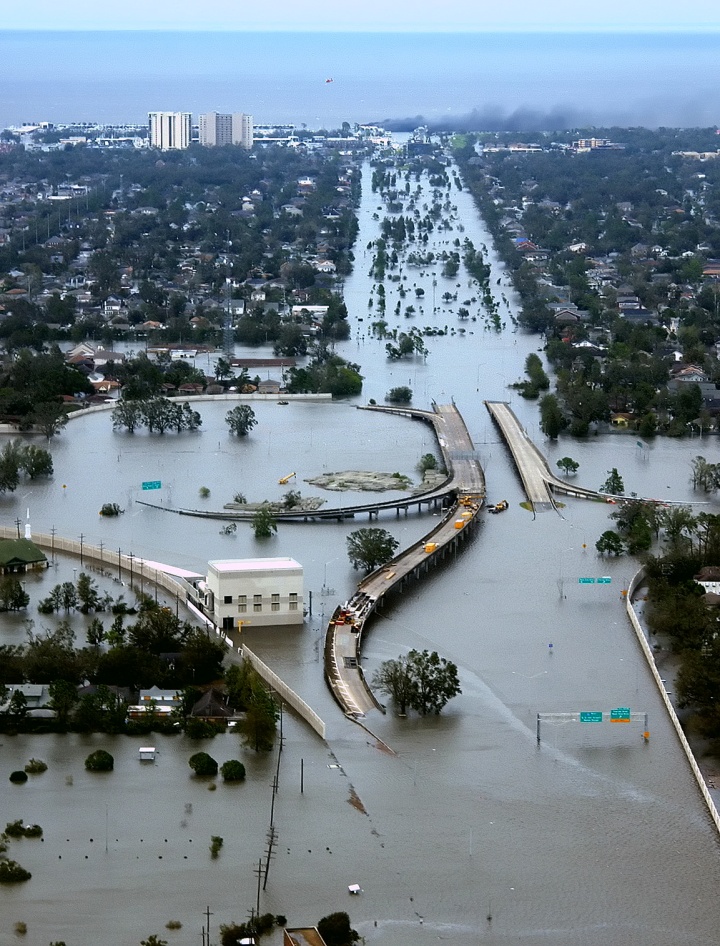
When a storm does strike a populated area, the amount of harm caused will depend on a complex interaction among several local physical and social factors. Long, narrow bays may worsen storm surge (as was observed during Sandy on the Long Island Sound), while certain kinds of coastal vegetation (such as mangroves) may protect coastal property from rising water. As seen during Hurricane Katrina, evacuation orders can save lives, but only if people have access to transportation, housing, and other resources needed to leave their homes and live elsewhere. And, as Typhoon Haiyan demonstrated, devastation can be extreme when a strong storm hits an area where buildings are built-in hazard zones and are not designed to withstand high winds or surge. Thus, to assess vulnerability effectively, compare the vulnerability of different people and places, and allocate resources accordingly, our policymaker would first need a consistent way to integrate these many factors into an overall vulnerability assessment.
Goals and Objectives
Goals and Objectives
Goals
- Students will assess the physical and social components of vulnerability to coastal hazards.
- Students will analyze worldwide case studies of coastal communities and their responses to coastal hazards in the context of vulnerability
Learning Objectives
By the end of this module, students should be able to:
- Identify the components of risk and vulnerability of coastal populations
- Assess and compare the exposure, sensitivity, and adaptive capacities of different coastal communities from an integrated earth systems perspective.
- Weigh the risks posed by coastal hazards and ways in which communities can adapt to increase resilience
Module 11 Roadmap
| -- | Assignment |
|---|---|
| To Read |
In addition to reading all of the required materials here on the course website, before you begin working through this module, please read the following required readings to make sure you are familiar with the content so you can complete the assignments.
Extra readings are clearly noted throughout the module and can be pursued as your time and interest allow. |
| To Do |
|
Questions?
If you have any questions, please use the Canvas email tool to contact the instructor.
Vulnerability's Three Dimensions Introduction
Vulnerability's Three Dimensions Introduction
Let’s break down the concept of vulnerability to a coastal hazard into its components.
What Exactly is Vulnerability?
In terms of social science and natural hazards, vulnerability can be thought of as a three-dimensional construct.
The three dimensions of vulnerability we will explore are exposure, sensitivity, and adaptive capacity.
- Exposure is the degree to which people and the things they value could be affected or “touched” by coastal hazards.
- Sensitivity is the degree to which they could be harmed by that exposure.
- Adaptive Capacity is the degree to which the community could mitigate the potential for harm by taking action to reduce exposure or sensitivity. This can also be thought of as a measure of resilience. See below.
Take a few minutes to watch at least the first 4-5 minutes of this short video focusing on the immediate aftermath of Hurricane Katrina in New Orleans and coastal Mississippi.
Video: Hurricane Katrina Survivor Clung to Trees as House Fell Apart: Part 2 (8:32)
Narrator: In the chaos of the rescues, Serena Johnson found herself living a nightmare.
Serena: We went to, it was a Louis Armstrong Airport. And when you walked into the airport, you saw all this, like, it smelled like a hospital. Some people were passing there.
Narrator: Desperation and despair were already hard to bear. But on top of that, many of evacuees, like Serena, were separated from loved ones. Hurricane Katrina caused the largest and most abrupt displacement in US history.
Serena: People allows businesses, people lost homes that they work hard on.
Narrator: A million people in the Gulf Coast were uprooted, scattered across all 50 states. Unsure of how to find her father, Serena and her mother had no option but to evacuate without him. Soon they were airlifted from New Orleans with no idea where they were going, where her father was, or if he was even alive.
Serena: I remember like looking to my mom like, with tears in my eyes, it was like I lost everything.
Narrator: Including the city she called home. And while a devastated New Orleans was drowning in unmerciful floodwaters, just 57 miles away on the Mississippi coast, Katrina had also left a trail of unimaginable destruction. More than 60,000 homes were destroyed back on August 29, when the eye of the hurricane made landfall directly over Waveland Mississippi. There, deadly storm surges, nearly 30 feet high, exceeded everyone's worst-case predictions, leaving an entire community trapped. That's when Howard Oh Quinn spring into action. This video shows Howard fighting the storm. As roads turned into raging rivers, and cars were completely underwater, he pulled aboard anyone needing his help.
Howard: We're driving the boat down the highway. I mean I never expected that in 100 years. Wind was screaming like you never heard it before. Rain was coming down it was like needles hitting us. We just started hearing people hollering, so we start picking up people. They were all strangers.
Narrator: A true life boat with 15 desperate people crammed into a vessel meant to hold only six.
Howard: I had to do something, I'm not gonna leave them there. People was hollering for help, help, you go help em. I was scared, but I wasn't gonna let everybody in that boat know I was scared because I'd had a panic attack.
Narrator: Soon he heard frantic screams coming from this house, which was almost totally submerged.
Betty Gillan: We couldn't get our door open to get out.
Narrator: Betty Gillan, 76 at the time, was trapped inside.
Howard: I jumped overboard. When I opened up the door and I put her and her son and his girlfriend in the boat.
Betty: it was very scary.
Narrator: Howard navigated the boat through two miles of treacherous water, finally reaching safety on a motel balcony just above the water level.
Betty: He saved my life. He was like a little cloud come down from heaven, just to see me. I love ya Howard.
Howard: I love you too.
Narrator: Strangers before Katrina, now lifelong friends.
Howard: I mean they called me a hero, but everybody was a hero that made it out of that storm.
Narrator: For one woman we met in nearby Pass Christian, my hometown, there was no hero to rescue her. She's been silent about her story until now.
Diane Brugger: I was incredulous. I just couldn't imagine it. We thought we were safe
Narrator: Diane and Tony Brugger did not evacuate from Harbor Oaks, the historic inn they had lovingly restored. They believed it's 33-foot elevation was well above the predicted 25-foot storm surge.
Diane: It was supposed to be going towards New Orleans.
News Reporter: The track of the storm has shifted to the east.
News Reporter 2: Capable of producing a tornado seven miles southeast of Pass Christiana.
Narrator: The Brugger's took refuge on the top floor of their inn.
Diane: We saw the water coming, the cars and floating, and everything, and the water was almost up to scenic drive. And it was like, oh this is serious.
Narrator: News stations around the world covered the storm, reaching out to eyewitnesses who still had phone service. At daybreak, a Canadian news anchor spoke to Tony Brugger.
Tony Brugger: We had a couple of windows we weren't able to get to from the outside. They've already broken, so we're gonna try and board them up from the inside.
Narrator: He had no idea what was coming. One block away, police captured video of an alarming sight.
Policeman: That's Sergeant Michael Ali's patrol car.
Narrator: And as the waters continued to rise, tornadoes touched down in Mississippi, one of which hit the Brugger's full-on.
Diane: We were sitting in the, sitting on the bed, and the dogs were just going crazy, and the house you'd feel it sort of well you know, like lift up like a boat, and then settle back, and lift up like a boat. And we just looked at each other and I saw a weird acceptance in his eyes that really unnerved me. He almost was acknowledging that this was it. And I understood it, but I didn't accept it. But we said nothing. We just held hands and just looked at each other. And then when the house went up and then it didn't quite go right back down the way it was supposed to, and we all got up and then that's when the walls fell away and the ceiling came down. Then it just covered him.
Narrator: The house literally just started breaking apart.
Diane: It just sort of flattened out into like just a field of debris. Tony, when part of the ceiling came down, it caught his head and just took him right under.
Narrator: Somehow Diane survived.
Diane: The only thing I remember is the trees, there were two together, and I had a foot in one and a foot in the other tree. It was all just, hang on.
Narrator: She clung to the tree limbs for six hours until the violent storm subsided and she was rescued. Having lost the love of her life, her home, and her communty, how could she possibly find the strength to carry on.
Narrator: A little later, how Diane discovers that determination. The amazing reinvention of a life. Also, a saint comes marching in.
Man: I needed somebody to believe in me just as much as New Orleans needed someone to believe in them.
Narrator: How Drew Brees and football win back the joy.
Knowledge Check Point
People and Things they Value
What is meant by the expression “people and things they value”?
This expression not only refers directly to people’s lives, livelihoods, and things of economic value, but also to places and to cultural, spiritual, and personal values. Also included are critical physical infrastructures such as police, emergency, and health services buildings, communication and transportation networks, public utilities, and schools, and daycare centers. It also refers to social infrastructures such as extended families, neighborhood watch groups, fraternal organizations, and more. The expression even includes such social factors as economic growth rates and economic vitality.
A community may be highly vulnerable to a low impact coastal hazard because of high sensitivity or low adaptive capacity – for example, a densely populated, impoverished neighborhood built on a low-lying shoreline could be easily inundated with a minimal flood from storm surge or tsunami and, due to the challenges imposed by poverty, they have great difficulty recovering from this event.
Another community can have a lower vulnerability to even high-impact coastal hazards because of low sensitivity or high adaptive capacity – for example, a wealthy tourist destination built to withstand flooding from storm surge may suffer a temporary setback when hit by a major hurricane but would be more likely to have the resources to rebuild than a low-income neighborhood would.
Therefore, coastal hazards can result in highly variable impacts because of these variations in vulnerability in time and space.
Disadvantaged groups of people are inherently more vulnerable to coastal hazards than others. The poor, the very old or very young, the sick, and the physically or mentally challenged are often vulnerable. Those lower educational attainment, or non-native speakers, are also often more vulnerable than native language-speaking people with higher levels of education. In the U.S., communities of color in coastal settings are often highly vulnerable, for example, this was true in New Orleans during Katrina and Puerto Rico during Maria. Vulnerable people may fit into more than one group. For example, the most vulnerable of a community could possibly be the minority, elderly, non-native speaking women.
Risk
What is Risk? Risk is the result of interaction between the components of the hazard and the vulnerability of the place that is impacted. Residents of a particular coastal community may weigh the risks of staying there versus relocating, or a person considering purchasing a house in a coastal community would definitely need to think about the risk to the property and his or her family and possessions. As we considered in our first exercise in Module 1, insurance companies account for all components of risk when determining insurance coverage. As the risk of devastating hurricanes has increased in the last decade, premiums have risen drastically in places such as South Florida. Below is a simple diagram summarizing the relationships between vulnerability, hazards, and risk.
Risk examples are obviously not restricted to coastal hazards. The descriptions above can be applied to other risks, such as serious illness during the COVID-19 epidemic. The risks of getting severely ill or dying vary greatly among different groups in a community, so that the elderly, those with underlying health conditions, and those living in group settings are at greater risk of severe illness from a COVID-19 infection than those who do not fit those demographics. Like other hazards, the disease has disproportionally affected minorities who tend to be poor and have more limited access to quality health care, so are more likely to suffer untreated underlying health conditions like high blood pressure and diabetes.
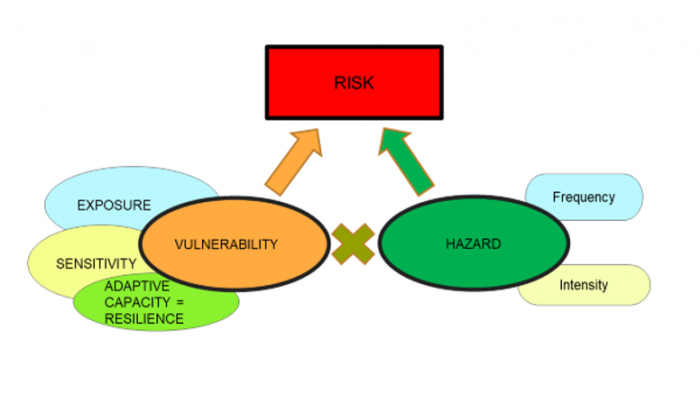
So, the question of why one place is more vulnerable to coastal hazards (or other types of hazards) relative to another does not have a simple answer. We must appreciate how the local frequency and intensity of these hazards interact with a diverse set of coastal processes, landforms, infrastructure, and social systems to harm people and things they value.
The question is important to policymakers because if governments and other coastal decision-makers are to make sound decisions to reduce the risk of all members of coastal communities to coastal hazards and prioritize spending to protect their most vulnerable people, places, and property, then they must understand where damage and suffering are likely to be greatest.
Resilience and Adaptive Capacity
The concept of resilience is important for understanding the adaptive capacity dimension of vulnerability to coastal hazards. The resilience of a community is its ability to use available resources to recover and grow from adverse situations, just as a resilient person can more easily bounce back from a setback than a less resilient person. Resilient communities can learn from past experiences and use that knowledge when confronting future problems. Systems with high adaptive capacity are therefore resilient and able to make the necessary changes to deal with coastal hazards. Systems with low adaptive capacity are much less resilient and much more vulnerable to coastal hazards. Later in the module, we will explore several examples of how communities with low adaptive capacity and poor resilience have coped with coastal hazards and how they have learned from these terrible experiences and are working to increase levels of resilience.
First, we will dig deeper into Vulnerability.
Assessing Vulnerability: The Vulnerability Scoping Diagram
Assessing Vulnerability: The Vulnerability Scoping Diagram
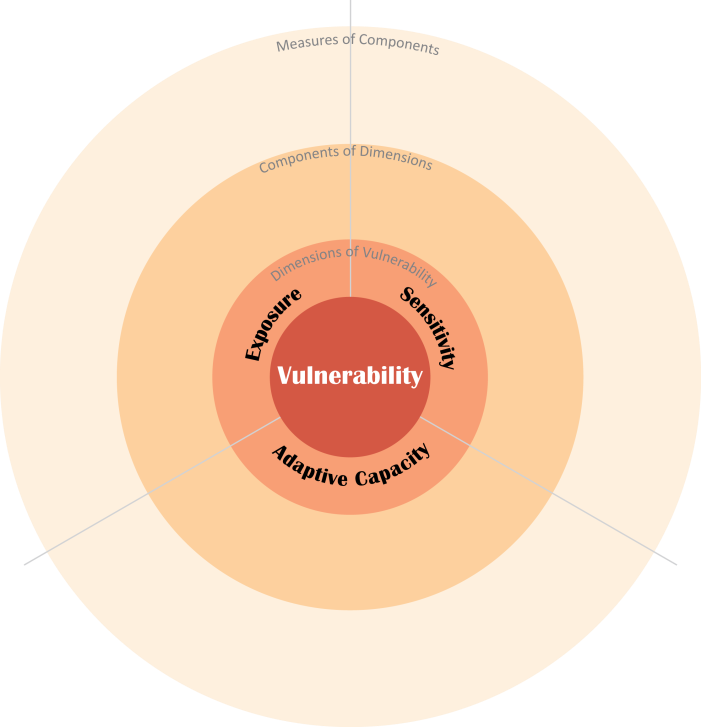
Figuring out the vulnerability of a person, place, or thing is a surprisingly complex task. To simplify this task, scientists have developed an assessment tool known as the Vulnerability Scoping Diagram (VSD). Moving from the center outward, the VSD defines the system being studied, divides vulnerability into its three dimensions (exposure, sensitivity, and adaptive capacity), defines components of these dimensions, and then assigns measures of these components. Each of these pieces of the VSD is described in more detail below.
Examples of VSD Explained
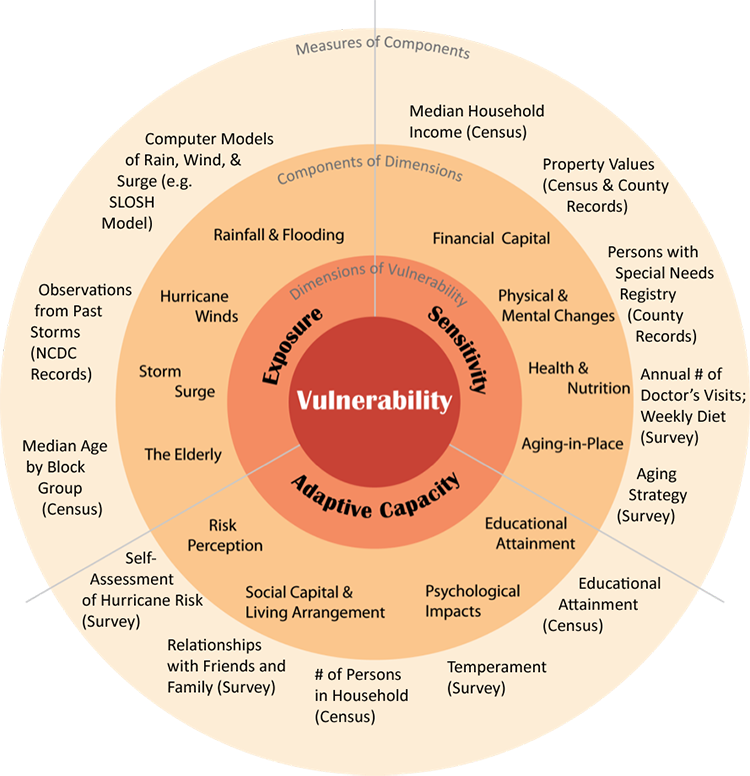
The above figure shows an example of how the VSD can be used to assemble a holistic picture of the many different components that shape vulnerability to coastal hazards. This VSD shows the vulnerability of the elderly to storm surge in Sarasota, Florida during the next decade. Starting with exposure, we see that the vulnerability of the elderly depends partly on the characteristics of the hazard itself – including storm surge, winds, and flooding – and partly on the location of the elderly relative to these hazards. The sensitivity of the elderly is a function of the age and income of the population, as well as their physical and mental health. The ability of the elderly to adapt to hurricanes – their adaptive capacity – is determined, among other factors, by how they perceive hurricane risks, the strength of their connections with family and friends (social capital), their access to living space outside of the hazard zone, and their education. Hence, elderly persons in Sarasota who are exposed to a large hurricane storm surge, are sensitive due to limited financial resources and poor health, and have few connections to friends or family would be quite vulnerable. In contrast, elderly persons who are exposed to the same storm surge but are healthy and can draw on significant financial and social resources would be much less vulnerable. Note that while this example describes some important components of vulnerability to coastal hazards, a completed VSD will often include many more components than are listed here.
There are many ways to measure these components of the vulnerability of the elderly to storm surge. Computer models can simulate the likely extent and intensity of exposure to hurricanes’ rain, wind, and flooding; these simulations can be compared to observations from past storms, which can provide additional information about hurricane frequency and severity. Census data can show how many elderly persons are living in areas that are exposed to these hurricane hazards. Census data can also provide the measures of financial capital (household income), social capital and living arrangement (number of persons per household), and educational attainment needed to assess these components of sensitivity and adaptive capacity. To measure other components (including physical and mental health or perception of hurricane risks), scientists may need to conduct their own surveys or request summaries of data sources that are not publicly available (such as the Sarasota County Registry of Persons with Special Needs).
Learning Check Point
Learning Check Point
Please take a few minutes to think about what you just learned and answer the questions below.
Dimension 1: Exposure
Dimension 1: Exposure
Exposure is the degree to which people and the things they value could be affected or “touched” by coastal hazards.
Think about your favorite coastal location. What are the aspects of the natural and built (human developed) environment in that location that affect the likelihood that people or things they value will feel the impacts of a natural hazard there?
If the location is a house built on a beach on a barrier island such as the Outer Banks of North Carolina or South Padre Island in Texas, it is highly exposed to a potential coastal hazard, but it may be in a small community and the hazard (storm) may be low intensity. In this case, the exposure is not as high as, for example, if the location is New York City, and the hazard is a storm like Sandy. In this scenario, millions of people and things they value (including complex infrastructure and things of great cultural value) are exposed. Also, the hazard is high intensity, so this amplifies the exposure. This scenario is one of very high exposure.
The components one needs to consider when assessing exposure are as follows:
-
Hazard frequency and intensity
In Modules 4 and 5 you covered both storm and tsunami hazards and read about the intense Hurricanes Katrina, Sandy, Maria, Harvey, Dorian, and several others. It is well established that climate change is resulting in storms of increased intensity, although there is less evidence that the frequency is increasing. However, in some locations in the world tropical cyclones are a relatively common occurrence, so can be considered frequent. The pattern of tropical cyclone frequency is illustrated in the animation shown here.
Video: Hurricane Tracks Animation and Cumulative Map (00:14) No narration.
Tropical cyclones have a wide range of wind speeds that are used to classify their intensities. NOAA’s National Climatic Data Center has assembled the best track data for 11,967 tropical cyclones into a single database, called IBTrACS, with information from 1842 to 2012. Included in that database are estimates of wind speeds along the tracks of the storms. This image shows the output of that data. By coloring the maximum sustained wind speed over the course of a storm’s life, certain patterns arise. In contrast to the similar image of storm frequency, the Northwestern Atlantic shows a much greater spread of strong storms, whereas in the Pacific the strongest cyclones seem to group near the Philippines. Credit: NOAA National Environmental Satellite, Data, and Information Service (NESDIS). NOAA Environmental Visualization Laboratory.
Credit: NOAA SOSCoastal communities are increasingly exposed to extreme weather events including categories 3, 4, and 5 hurricanes and storms that generate extreme rainfall events. For example, you need only look at the 2017 hurricane season and consider Hurricane Harvey’s impact on Houston and Hurricane Maria’s impact on Puerto Rico.
-
Location and Landscape
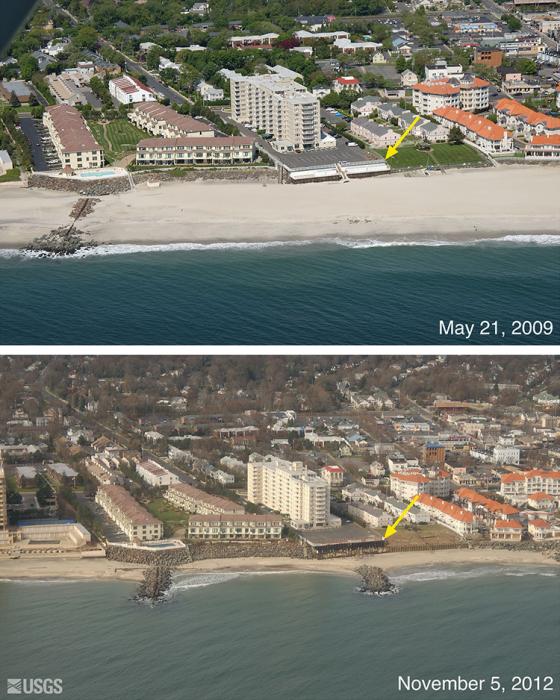 Oblique aerial photographs of Long Branch, New Jersey from before and after Hurricane Sandy. Note how the flood control structures (groins) have shaped the exposure to storm surge and beach erosion.
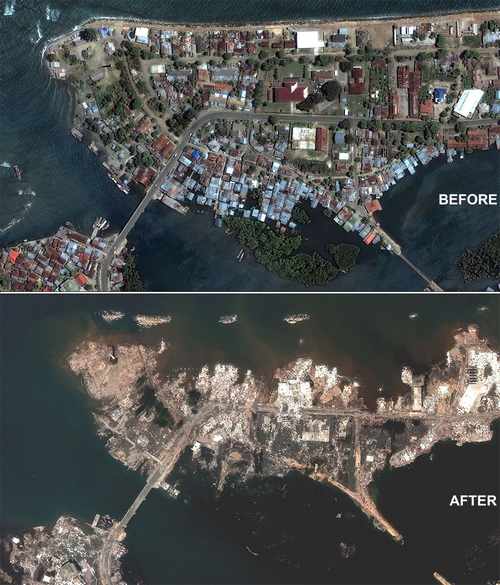
The physical features of the coastal landscape play a major role in determining exposure. For example, the low-lying coastline of southeastern Louisiana exposes the city of New Orleans and nearby communities to hurricane storm surges from the Gulf of Mexico. Complicating the effects of low elevation features such a narrow bays and inlets that can amplify storm surge. In Module 6 you looked at many case studies of coastal hazards and their impacts, including Super Typhoon Haiyan (Yolanda) that devastated Tacloban City in the Philippines in 2013. Tacloban is another city with a large, dense human population situated close to the ocean on land that sits at a very low elevation. But in addition, Tacloban is in San Pedro Bay. Watch the storm surge simulation of Typhoon Haiyan below to see the effect of magnification of surge height as it enters the confines of the bay.
Video: Storm surge of Super Typhoon Haiyan making landfall (00:10) No narration.
This video is a simulation of the approach and impact in Tacloban of the storm surge of Super Typhoon Haiyan. It illustrates how the magnitude of the storm surge increases as it enters a shallow bay such as San Pedro Bay, where Tacloban sits. The result of this unfortunate combination of hazard intensity and location was the loss of 4,000 lives in Tacloban city alone.
Credit: Maarten van Ormondt -
Density of People and Property
Population density on Earth can be explored using this NASA Earth Observatory image [8]. Take a minute to explore this interactive Night Light image from 2016. Consider how this imagery illustrates the distribution of the human population on Earth. It certainly shows the large urban areas well. But one thing to keep in mind is that some locations will show as brighter at night not only due to a greater or denser population, but because of the economics of the area. A wealthier country will have a better and more reliable energy supply.
We have already considered examples, such as Typhoon Haiyan, and Superstorm Sandy, where very densely populated areas are impacted by severe coastal hazards.
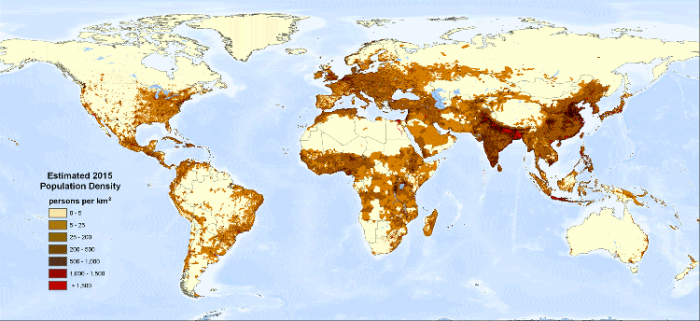 Global population density.Credit: United Nations Environment Programme, Global Environmental Alert Service [9] Center for International Earth Science Information Network - CIESIN - Columbia University, and Centro Internacional de Agricultura Tropical - CIAT. 2005. Gridded Population of the World, Version 3 (GPWv3): Population Density Grid, Future Estimates. Palisades, NY: NASA Socioeconomic Data and Applications Center (SEDAC) [10]. Accessed August 15, 2023.
If this world population map and that of global hurricane intensity shown above are compared, we can see that the Atlantic seaboard of the U.S., as well as the east coast of China, are examples of places with high population density coinciding with high exposure to intense cyclones. Superstorm Sandy was unusual in size and intensity for a late-season storm hitting the northeastern U.S., but based on the map of storm intensity, it was not a complete anomaly. Adding the fact that Sandy, with its incredibly large diameter, impacted so many of the densely populated cities of the eastern seaboard, this was a perfect example of high exposure of people and property. In Module 6 you read about the circumstances of Sandy and the fact that these population centers (including New York, Boston, Philadelphia, ….) are home to 50 million people with an economic output of $3.6 trillion/year. The area definitely has a high exposure to hurricanes as the climate warms.
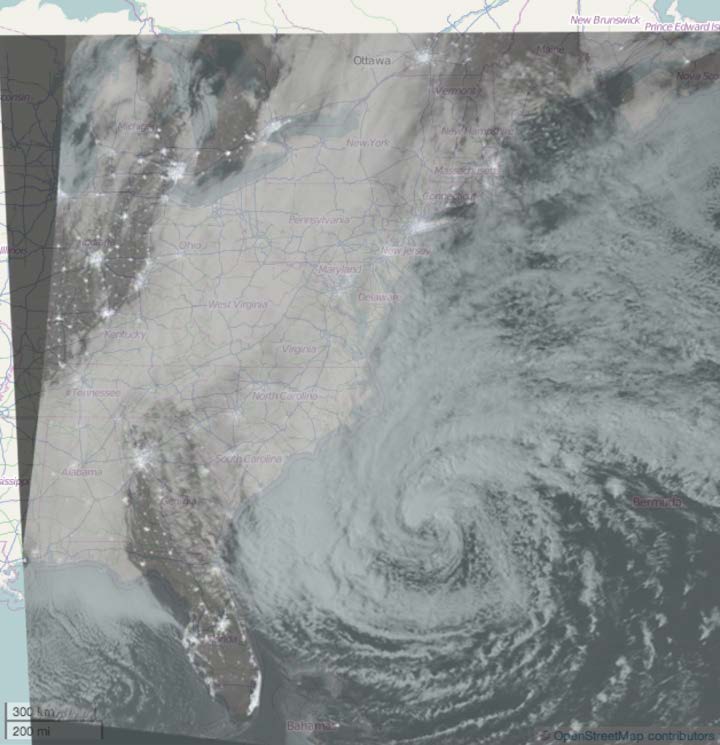 A nighttime image of Hurricane Sandy, with lights of major cities on the U.S. east coast visible through its swirling clouds, overlaid on top of a map of the U.S. eastern seaboard.
Learning Check Point
Learning Check Point
Using the satellite image and OpenStreetMap [13], identify three cities (bright spots) that were beneath Sandy’s circulation (evident here as a swirl of clouds) when this picture was taken. To identify specific cities, use the above satellite image overlay to identify the names of states that contain these cities. Then pan and zoom on the interactive map of the eastern United States [13] to find the names of these cities.
Exposure Summary
Exposure Summary
The maps on the previous page show how the severity of Hurricane Sandy’s impacts on the East Coast of the United States was a product of regional differences in not only the intensity of its wind, surge, rain, and snow but also in the distribution of people and property. One of the main reasons that Hurricane Sandy was so destructive was that it made landfall in a densely populated and developed region, exposing many people and the things they value to damaging wind and water. However, this is only part of the story. As the following sections on sensitivity and adaptive capacity will explain, other characteristics of the people who lived in Sandy’s path – including their demographics and their capacity to plan, prepare, and rebuild – also played an important role in shaping their vulnerability.
Dimension 2: Sensitivity
Dimension 2: Sensitivity
Introduction
Sensitivity is the degree to which people and the things they value could be harmed by exposure to a hazard.
Sensitivity to coastal hazards is more difficult to assess than exposure, particularly before a disaster occurs.
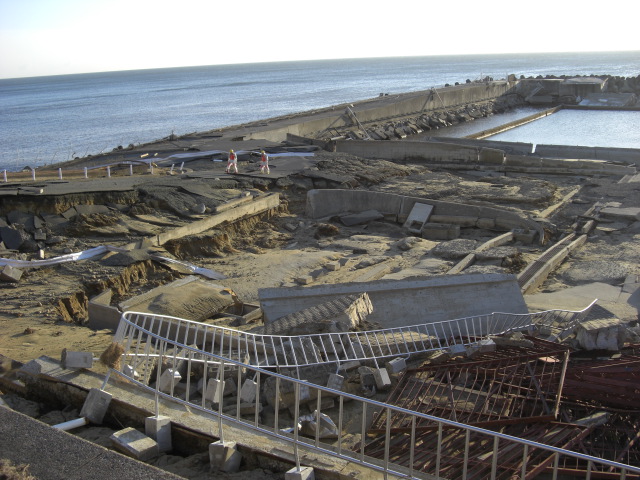
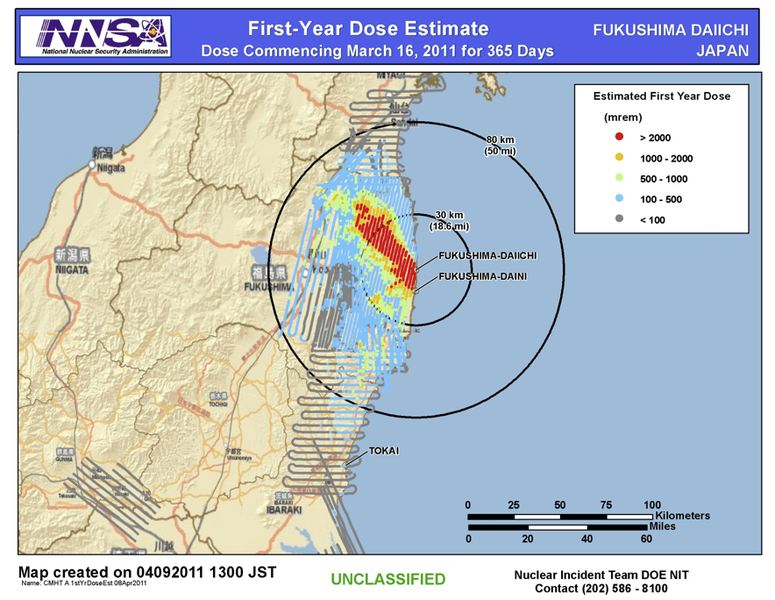
In 2011, a 9.0 magnitude earthquake off the Pacific coast of the Japanese island of Tōhoku caused a massive tsunami that killed more than 15,000 people and destroyed or damaged hundreds of thousands of buildings. It also caused a nuclear disaster in the form of meltdowns at three reactors of the Fukushima Daiichi Nuclear Power Plant. However, other nuclear reactors within the path of this event’s tsunami waves were essentially unaffected.
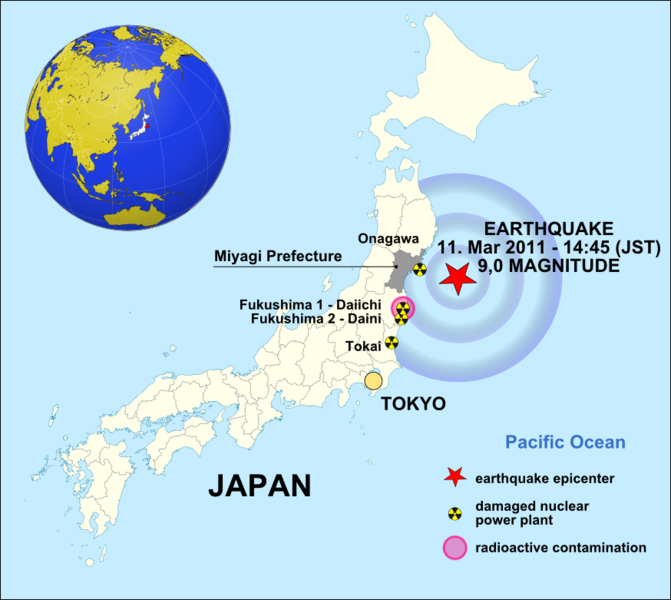
Why did the Fukushima Daiichi plant experience catastrophic meltdowns while other reactors exposed to the tsunami did not? One explanation is that Fukushima Daiichi reactors were more sensitive to tsunamis than other reactors. Sensitivity, as defined earlier in this module, is the degree to which people and the things they value could be harmed by exposure to a hazard. It is important to assess sensitivity to a hazard before an event occurs to more fully understand the potential for adverse impacts. It is also important to assess sensitivity after an event has occurred to locate where the worst effects were felt and to identify lessons that might be applied to future hazard events.
Sensitivity to coastal hazards is more difficult to assess than exposure, particularly before a disaster occurs. Hurricanes and associated storm surge exposure are generally only possible in particular coastal areas globally, and are much more common in some areas than in others. Likewise, tsunamis are generally caused by undersea or volcanic seismic events, which limits the number of places they can physically occur. Because we have much historical experience and physical science knowledge about these hazards, we can often predict with reasonable accuracy which places might be exposed.
Sensitivity, however, is not always as clear. As depicted in the vulnerability scoping diagram presented earlier in this module, one needs to consider both the components of sensitivity to a hazard and measures of that sensitivity. Two components of sensitivity often considered to be important to understanding vulnerability to coastal hazards are infrastructure and demographics. Of these, infrastructure is the more straightforward of the two to assess. Typically, information is readily available on infrastructure’s date of construction, materials used, ability to withstand various hazards, and so on, particularly in developed countries. Understanding the condition and quality of infrastructure enables assessment of its sensitivity to hazards, and consequently the sensitivity of populations that rely on the infrastructure.
Demographic factors such as race, gender, and socioeconomic status can also play an important role in assessing sensitivity to coastal hazards. However, these factors are highly context-specific, and can also interact with one another.
The two aspects of a community most often considered in sensitivity assessments are the demographics of the population and the infrastructure of the built environment. Of these, infrastructure is the more straightforward of the two to assess.
Let’s think of an example we are already familiar with. With Hurricane Katrina, the infrastructure designed to protect the city of New Orleans from storm surges (the levee system) was not strong enough to withstand the surge and therefore failed and the city flooded. Many people living in the city had characteristics that lead to high levels of sensitivity. Poverty, sickness, and old age are three characteristics that were shared by many of the people who suffered the most as a result of Katrina’s flooding. This led to the shocking human catastrophe we witnessed, with thousands of people unable to evacuate and trapped, and some dying for lack of medical help or basic human needs. The city displayed a high level of sensitivity. This became painfully obvious after the storm, but was, perhaps, harder to assess before Katrina happened (although there had been many attempts to draw attention to the issue prior to the storm).
Similarly, but with far less impact on human suffering, with Sandy in New York, the infrastructure of Lower Manhattan, including the subway, was not designed to withstand a storm surge. This became painfully obvious after the storm, too. These lessons in sensitivity are (or should be) what drive communities to improve their resilience to coastal hazards by working to strengthen their adaptive capacity, as we will see in the next section.
Learning Check Point
Learning Check Point
Please take a moment to answer the following questions. It is not for credit, but the understanding is critical to the assessments in this module.
Sensitivity Summary
Sensitivity Summary
In summary, sensitivity is the degree to which people and the things they value could be harmed by exposure to a hazard. To understand sensitivity, we need to consider both the components of sensitivity to a hazard and measures of that sensitivity. The two aspects of a community most often considered in sensitivity assessments are demographics of the population and the infrastructure of the built environment. Of these, infrastructure is the more straightforward of the two to assess. Understanding the condition and quality of infrastructure enables assessment of its sensitivity to hazards, and consequently the sensitivity of populations that rely on the infrastructure. Demographic factors such as race, gender, and socioeconomic status can also play an important role in assessing sensitivity to coastal hazards. However, these factors are highly context-specific, and can also interact with one another.
Dimension 3: Adaptive Capacity
Dimension 3: Adaptive Capacity
Introduction
What can community leaders and all community members do to build their resilience to coastal hazards?
The adaptive capacity of a community is its capacity to cope with, recover from, and adapt to hazard events. Coastal communities around the world are focusing on ways to adapt to increased risk in the face of amplified coastal hazards such as extreme weather and sea level rise.
The term resilience is often used to describe the ability to cope or bounce back after a setback such as a storm surge, or to cope with ongoing challenges such s more frequent tidal flooding. Resilience can be thought of as a measure of a community’s adaptive capacity. As we mentioned before, communities can increase their adaptive capacity and resilience by learning from a disaster or hazard event. New Orleans is certainly a good example that we will examine in a case study.
Our case studies of coastal hazard events around the world throughout this course have highlighted how the issues of social inequity in communities can impact the speed with which and how well certain groups of people are able to recover and bounce back from a setback such as flooding from Katrina or Sandy, or a tsunami such as the devastating 2004 Indian Ocean tsunami. Those things we mentioned in the section on sensitivity that make people more sensitive to the disruption and harm caused by an event such as these – age, health, poverty, and race all can be major obstacles to the ability to bounce back – recover and rebuild homes, lives, and livelihoods after a major setback.
Who are the most vulnerable?
As we have touched on already, there is a strong link between poverty and vulnerability. Why is this? First, the data show that lower-income Americans are more likely to live in neighborhoods prone to chronic flooding and to live in housing that is more susceptible to damage from storms. Second, lower-income people have lower levels of resilience because they do not have the economic cushions that help to reduce the shock when disaster hits. For example, poorer families are less likely to have flood insurance policies and have a harder time finding the resources to rebuild and get back on their feet. This has been clearly shown for families in New Orleans, who even a decade after Katrina were lagging behind wealthier counterparts in economic recovery. Adding to these facts, in many locations, including New Orleans after Katrina and Houston after Harvey, the communities of color were the ones of lower economical means and therefore have more difficulty recovering from the shock of these events. Longer-term effects of flooding also include health impacts and again, lower-income people and people of color tend to struggle more due to lack of access to high-quality healthcare in some cases. For example, after Katrina, houses that may not have been very badly flooded were rendered unlivable due to the black mold that grew in the hot, humid climate. It is much harder for a poor family to address more insidious long-lasting impacts such as these, and they can lead to chronic health issues such as high levels of childhood asthma.
As we work through the remaining modules of the course, keep in mind the need to find equitable solutions to the issues we are examining. If we, as a society, cannot address the need to increase resilience for everyone, the future is going to be very challenging for many people[d1].
[d1]Reference:
How to Increase Adaptive Capacity: Non-structural Measures for Strengthening a Community’s Resilience to Coastal Hazards
How to Increase Adaptive Capacity: Non-structural Measures for Strengthening a Community’s Resilience to Coastal Hazards
What can be done so all members of a community can increase their adaptive capacity to reduce the impact of a coastal hazard event?
It’s important to draw a distinction between the actions of individuals, families, neighborhoods, municipalities, etc. to build the adaptive capacity of their community versus decisions on a governmental level to construct physical barriers such as flood walls and other engineering structures to protect the community, which were the focus in Module 7. In this module, we are focusing more on what is called non-structural adaptations and the policies that drive them, rather than on engineering or structural solutions. But of course, the two kinds of adaptations work together to reduce the risk of coastal hazards.
A community can take action towards increasing its adaptive capacity on many levels. These actions are designed to reduce or avoid risk or damage from hazard events or to reduce or avoid people’s or places’ exposure and/or sensitivity to hazard events. So, included in thinking about adaptive capacity and resilience is how everyone can become better informed and prepared for an event that could cause harm, whether it is a hurricane, tsunami, or another coastal hazard event. We will delve into this in detail below.
Increasing Community Resilience
A lot of work is taking place to address the need to increase coastal resilience or adaptive capacity. Work can be done at all levels of society - Individuals, families/households, communities, and local, state, and federal governmental units. There are many exemplary programs around the U.S. and the rest of the world that are working to reduce the vulnerability and increase the adaptive capacity of coastal communities. Each major coastal disaster we have looked at in this course has stimulated local and national policy changes in the communities affected so that greater protection and resilience is enacted. The questions you might ask are: Is enough being done? Is coastal resilience increasing at the same rate as the risk of harm from a coastal hazard is increasing? What can different levels of a community do to increase a community’s adaptive capacity and resilience?
What individuals and families can do:
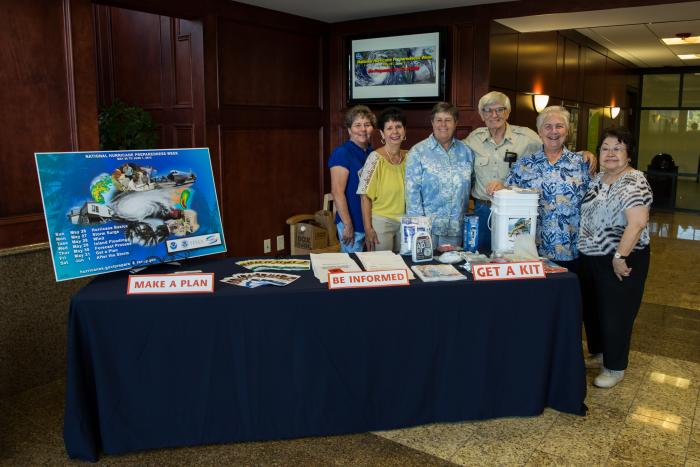
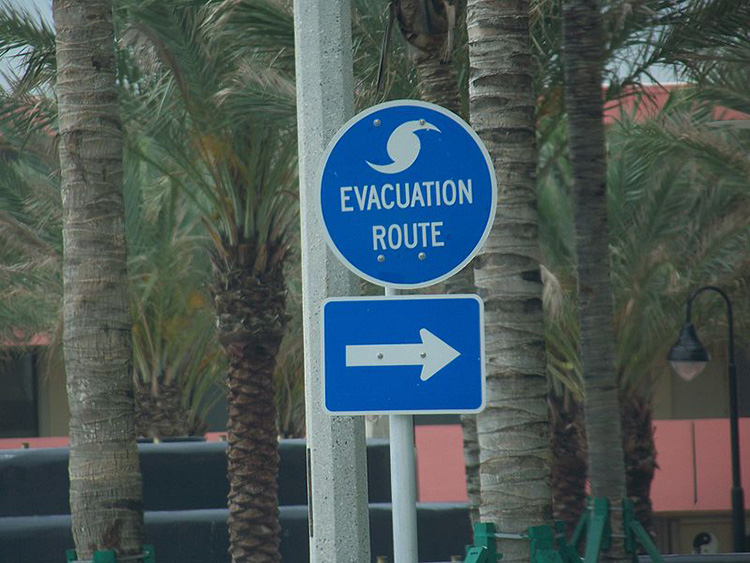
As an individual, learning about hazards can help you prepare for the hazard event and know what to do during or after disasters. Families or households can buy hazard insurance, prepare a disaster supply kit, and develop an evacuation or shelter in place plan to protect themselves and their loved ones. As we noted above, families must have the means to buy insurance and execute plans such as evacuation. Those who don’t have the means are at an immediate disadvantage.
What community organizations and local government entities can do:
Communities and local governmental and non-governmental entities such as non-profit organizations in a community can play important roles in educating the community and working on various aspects of community resilience, including providing assistance to disadvantaged families.
In areas prone to coastal or other hazards there are usually educational programs offered to schools, churches, and other places where learning takes place to increase awareness and understanding of disaster preparation. An example in New Orleans is the Evacuteer program, which is a non-profit organization that started after Hurricane Katrina, filling an immediate need to help people plan an evacuation, but also to help New Orleans community members generally develop greater resilience or adaptive capacity. See Evacuteer [22]. Another example is in coastal Washington state where schools prepare students to evacuate in the event of an earthquake and possible tsunami that would flood their school (see Module 7).
In addition, community organizations and local governments can work together with citizens to develop hazard mitigation plans to help community members before, during, and after hazard events. One important way communities can increase their resilience to flooding is to take mitigation steps that count toward the Community Rating System (CRS) of the National Flood Insurance Program (NFIP). CRS points are earned to reduce flood insurance premiums in a participating community. This is described later in the section on the NFIP. It is a very important tool for communities to take proactive steps towards addressing resilience to chronic flooding issues. Mitigation measures may include raising the elevation of homes and protecting critical infrastructure.
In Module 12 we will focus on the Emergency Management Cycle of Mitigation, Preparedness, Response, and Recover. The measures mentioned above will be explored further there.
What other levels of government can do:
Governments at various levels can work to increase resilience in several ways. These methods include the improvement of building codes and enacting new zoning and land-use plans to address issues arising from increased flooding. Emergency services, early warning systems, and communication of warnings are key to community resilience and rely on coordination at many levels to be effective, as we mentioned in the discussion on tsunamis. The Federal Department of Homeland Security, in which the Federal Emergency Management Administration (FEMA) resides has state offices that address emergency preparedness and disaster management. State Office of Homeland Security oversees all-hazard preparation, mitigation, and recovery. City and state governments in many coastal areas have emergency preparedness offices or agencies and many have coastal resiliency officers. Government agencies such as these also play an important role in disaster-reduction educational programs. Check out the links under Recommended Resources to find ways FEMA provides guidance to homeowners to prepare for potential flooding events. As you will read below, the federal government is overdue to address weaknesses in the NFIP, which, when enacted may change the way flood insurance works for homeowners and business owners.
Addressing Social Inequity Issues that Hamper Community Resilience
People in poverty may not have access to ways of coping in an emergency and therefore they suffer more. After the hazard event has passed, poor people may have fewer means during recovery. They may not be able to repair the damage to their house for a lack of funds and insurance. Programs that address disparities between the rich and poor when it comes to coping with coastal and other hazards are essential. Although policymakers recognize the importance of poverty reduction in enhancing people’s adaptive capacity, it is challenging to implement so it must be a long-term, ongoing strategy for building adaptive capacity.
Poverty reduction might be the most fundamental way to enhance people’s adaptive capacity. Working to increase educational and financial opportunities to lead people out of poverty in communities in need is one long-term strategy that is fundamental to decreasing poverty and thereby increasing adaptive capacity around the world as well as in the U.S.
In a 2018 article, “Echoes of Katrina: Post Hurricane Maria Public Health Threats and Trauma”, referenced in the Recommended Reading section of this Module, authors with the Center for American Progress discuss the disproportional impact of extreme weather events such as Hurricane Katrina on the Gulf Coast, and Hurricane Maria in Puerto Rico and the U.S. Virgin Islands have in communities disadvantaged by poverty and racism. Below we will look at the impact of Maria on Puerto Rico and the response by the Federal Government. In the article, the authors state,
“To prepare for and recover from increasingly strong and frequent extreme weather fueled by climate change, communities of color and families living in poverty are forced to overcome additional barriers set in place by historic discriminatory policies and practices. And, as in the aftermath of Hurricane Katrina, families with limited means, women, young children, older adults, and residents with disabilities are disproportionately affected.”
These “barriers” come in various forms, often related to public health, such as: being more likely to live in sub-standard housing subject to the growth of mold after a storm, which can cause serious lung ailments; living in neighborhoods more prone to flooding and environmental pollution, which compounds the impacts of the event from which the community is trying to recover; more likely to suffer trauma, which can lead to PTSD and other mental health issues. Therefore, on top of the financial strain of trying to recover from a major disaster, these many obstacles can compound the problems in disadvantaged communities. In addition, many poor families are forced from their homes permanently because of economic needs, whether it is a lack of funds for repairs or the need to move to find employment. This was a common scenario following Katrina in New Orleans and Maria in Puerto Rico. These factors hamper and prolong the recovery process. The authors of the above-mentioned article stress that disadvantaged communities such as those devastated by Hurricane Maria must receive ongoing financial assistance to be able to not only rebuild but increase the resilience of their community by making the needed changes and improvements to remove the obstacles mentioned above.
Cultural Sensitivity
In working to enhance community adaptive capacity, policymakers also need to be aware of the cultural differences among members of their populations, especially in regions or nations that have diverse cultural groups. These differences have major implications for developing community disaster reduction projects. For example, some cultures tend to work collectively while other cultures stress individual action. In another instance, some cultures may be inclined to believe in fate, making them less likely to prepare for natural disasters. It is worth mentioning here that cultures that have evolved in coastal settings also contain a level of local knowledge of the hazards that can be helpful in times of disaster or ongoing threat. Examples include many groups of indigenous people around the U.S. and in other countries. An example you met in Module 9 is the case of the tribal members of Isle de Jean Charles, Louisiana, who are descendants of Biloxi, Chitimacha, and Choctaw Indians. Their resettlement plan ran into obstacles related to misunderstandings due to cultural differences between the state policy experts and tribal leaders. To read more about the resettlement of Isle de Jean Charles, please visit Isle de Jean Charles: Tribal Resettlement [23].
Learning Check Point
Learning Check Point
Please take a few moments to think about what you just learned, then answer the following question to test your knowledge.
Adaptive Capacity Summary
Adaptive Capacity Summary
In summary, adaptive capacity is the capacity of a community to cope with, recover from, and adapt to hazard events. Coastal communities around the world are focusing on ways to adapt to increased risk in the face of amplified coastal hazards such as extreme weather and sea level rise. Adaptive capacity involves any action taken either to reduce or avoid risk or damage from hazard events or to reduce or avoid people’s or places’ exposure and/or sensitivity to hazard events. There are several types of strategies that reduce or avoid exposure or sensitivity. They include the ideas of mitigation, adaptation, and resilience. While those terms mean slightly different things than adaptive capacity, all of the terms consider the capacity to cope with, deal with, and adapt to hazard events.
Case Studies: Exposure, Sensitivity, and Adaptive Capacity in Real Examples
Case Studies: Exposure, Sensitivity, and Adaptive Capacity in Real Examples
To help you understand Exposure, Sensitivity, and Adaptive Capacity, you will be introduced to several case studies.
2004 Indian Ocean Tsunami
2004 Indian Ocean Tsunami
Introduction
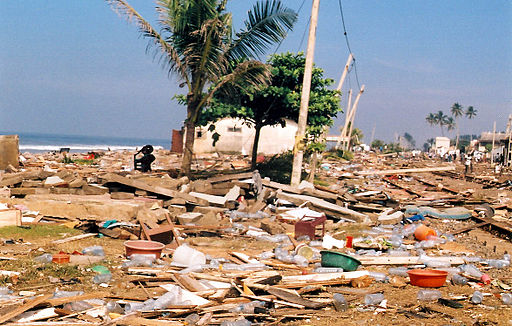
The Indian Ocean Tsunami of 2004, which we covered in Module 7, provides us with a case study to help understand how levels of sensitivity and adaptive capacity affected the level of impact and the recovery of the communities in the tsunami’s path.
The massive earthquake and tsunami that occurred on December 26, 2004, off the coast of Indonesia, was one of the most damaging disasters in recorded history. It caused at least 230,000 deaths and billions of dollars in damages in countries bordering the Indian Ocean. The tsunami impacted many countries including Indonesia, Sri Lanka, India, Thailand, the Maldives, and Somalia. Of the people who lost their lives, many vacationing westerners were included.
Following this severe hazard event, damages were unevenly distributed throughout the affected regions. The reasons for this inequity are complex and include variations in all three dimensions of vulnerability, exposure, sensitivity, and adaptive capacity. Let’s look at sensitivity and adaptive capacity.
Sensitivity
Variations in sensitivity were one of the major factors, driven by variability in economic resources and demographic factors.
Sri Lanka and housing sensitivity:
One heavily affected country was Sri Lanka, where 0.17% of the entire national population was killed and 2.5% were displaced. The Sri Lankan scholar Mohan Munasinghe observed that houses belonging to poorer individuals that were in the path of the tsunami were more likely to be destroyed due to the low quality of construction, suggesting a higher sensitivity of the physical property of poorer people. One clear way of reducing sensitivity to tsunamis in Sri Lanka would be stricter housing construction requirements at the coast. However, Sri Lanka is a poor country with limited economic resources, which could make implementing and enforcing such requirements difficult.
Adaptive Capacity
Importance of traditional family community networks for enhancing adaptive capacity:
Many community members in developing nations, despite lacking in economic resources, have access to strong traditional family and community networks. These networks are valuable, if not essential, for recovery by providing informal mutual help following a disaster, like a tsunami. In the case of Sri Lanka, Munasinghe noted that these networks improved survivors’ ability to cope with and recover from the disaster compared to wealthier groups. Therefore, in this instance, informal social ties reduced community sensitivity to the hazard event. This is an example of adaptive capacity, which will be described in a subsequent section.
Learning Check Point

Economic Recovery and Adaptive Capacity
Anthropogenic factors can sometimes exacerbate the losses from a natural hazard like a tsunami. Economic development patterns of South Asian coasts played a part in 2004, including tourist developments and shrimp farms, which had negatively impacted coral reefs and mangroves that otherwise might have diminished the intensity and inland reach of the tsunami. In some communities, the reliance on these types of economic development have limited local livelihood options to tourism-related or fishery-related jobs, instead of more traditional, diversified livelihood strategies. The damages to tourism and fisheries industries following the tsunami placed greater stress on communities that were heavily dependent on jobs in these sectors. Consequently, it was harder for local people in these communities to recover from the tsunami because of damages and the lack of other livelihood options.
Despite the widespread damage, some communities suffered less or recovered more quickly because they possessed higher adaptive capacities to this hazard event. One study found that fishing communities on Simeulue Island, Indonesia, and Surin Island, Thailand had fewer losses from the tsunami because they possessed traditional knowledge of tsunamis and had institutions in place that helped them prepare for and respond to the disaster.
Around the Indian Ocean basin, there were no early warning systems when the tsunami struck. In response to the disaster, governments almost immediately collaborated to develop the Indian Ocean Tsunami Warning and Mitigation System to reduce exposure to tsunamis. This aspect will be discussed further in Module 11.
1992 Hurricane Andrew and Housing Sensitivity in South Florida
1992 Hurricane Andrew and Housing Sensitivity in South Florida
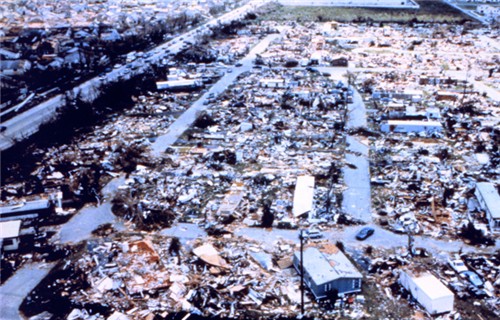
Another example of the role of sensitivity in creating vulnerability to hazards involves the impacts of hurricanes on mobile homes. As discussed in Module 6, in 1992, Hurricane Andrew struck the Florida coast as a category 5 storm. Many South Floridians still have vivid memories of Hurricane Andrew. It became the costliest storm in history at the time, causing an estimated $25 billion in damages and 17 direct deaths and many more indirect deaths, amounting to approximately 44 deaths. The storm came ashore just to the south of Miami, devastating the town of Homestead. Had it hit the coast just 20 miles to the north, it is estimated that the economic and human costs would have been multiplied more than ten-fold. In the case of Hurricane Andrew, the wind damage had the greatest impact. In the communities impacted, mobile homes received the most severe damage, and the severity of destruction was partially attributed to structural design that could not withstand the winds of a major hurricane. In fact, 90% of all mobile homes in Miami-Dade County were damaged beyond repair. In Homestead, 99% of mobile homes were completely destroyed. Many of South Florida’s poorer residents resided in this highly sensitive type of housing, so they were disproportionally impacted by the hurricane.
Many lessons were learned from Hurricane Andrew in terms of sensitivity related to insufficiently stringent building codes in general and mobile home construction codes specifically.
The production of mobile homes is regulated by the Department of Housing and Urban Development (HUD) building codes. At the time that Andrew struck, relatively lax building codes from 1976 were in place, making mobile homes especially sensitive to the major hurricane’s intense winds. After Hurricane Andrew, HUD significantly strengthened the building codes to enhance the structural integrity of mobile homes; these improved regulations went into effect in 1994. In addition, the Florida Department of Highway Safety and Motor Vehicles, which ironically treats mobile homes not as buildings but as vehicles, also placed several stricter rules on mobile home construction in 1996 and 1999.\
The revised mobile home standards have had a dramatic impact on the sensitivity of these structures (Table 1). In the very active 2004 hurricane season, which saw four hurricanes make landfall in Florida, all damages to mobile homes occurred in units built before the federal regulations changed. No mobile homes built after 1994 were damaged. This is a clear example of variable sensitivity to the same hazards based on the quality of construction.
| Hurricane | Total number of mobile homes in storms' path | Mobile homes built before July 1994 | Mobile homes destroyed | Mobile homes built after July 1994 | Mobile homes destroyed and seriously damaged |
|---|---|---|---|---|---|
| Charley | 11909 | 9011 | 2413/26.8% | 2898 | 0/0% |
| Frances | 7089 | 6961 | 99/1.4% | 128 | 0/0% |
| Ivan | 1432 | 1246 | 82/6.6% | 186 | 0/0% |
| Jeanne | 8845 | 8001 | 989/12.4% | 844 | 0/0% |
| Total | 29275 | 25219 | 3583/14.2% | 4056 | 0/0% |
Learning Check Point
Fukushima Daiichi Nuclear Disaster
Fukushima Daiichi Nuclear Disaster
Let us return to the example of the Tōhoku earthquake and tsunami and subsequent Fukushima Daiichi nuclear disaster. Fukushima Daiichi and several other Japanese nuclear plants were all exposed to tsunami hazard, in the sense that they were close enough to the coast that a tsunami could affect their operations. The plants are designed to automatically shut down during earthquake and tsunami events, but the shutdown process itself requires power, which is provided by diesel generators. They are also protected by seawalls that are designed to prevent flooding by waters up to a specified height.
There were two major sources of sensitivity at Fukushima Daiichi, one of which applied to all of the other Japanese nuclear facilities, and one of which was particular to Fukushima Daiichi. If the on-site diesel generators at any plant flooded and failed, no additional failsafe mechanism was available, and a meltdown became possible. This potential for failure greatly increased the sensitivity of these plants and the surrounding populated places and property. More importantly, in this example, if the seawalls were too low and could, therefore, be overtopped by a tsunami, then flooding might disable the generators. This is exactly what happened at the Fukushima Daiichi plant. Its seawall was 19 feet high. Despite warnings in a 2008 report suggesting that the plant could be exposed to a tsunami of up to 33 feet, the plant was still protected only by the existing 19-foot seawall when the tsunami struck. The tsunami that made landfall reached over 40 feet high, even larger than the earlier report had suggested was possible. Because the seawall was inadequately protective relative to the magnitude of the potential hazard, the plant was more sensitive to a catastrophic meltdown, which in turn increased the sensitivity of nearby populations to exposure to radioactive materials and long-term contamination of property and natural resources.
What lessons might we learn from the Fukushima nuclear disaster that could reduce sensitivity to similar future hazard events? This is a particularly tricky question in this case. Earthquakes of the magnitude of the Tōhoku earthquake, which was the initial hazard event that triggered the tsunami and subsequent nuclear disaster, are extremely rare. However, sensitivity to a hazard of this magnitude was sufficiently great that the result was a catastrophe. The extents to which countries should prepare for very rare events with potentially extreme consequences are difficult political and policy questions.
However, setting those questions aside, there are two main ways in which sensitivity could have been reduced in this situation. First, the seawall was far too short and could have been overtopped by a much smaller seismic event and tsunami. To reduce this sensitivity, seawalls protecting nuclear power plants should be built to withstand a tsunami of the highest possible levels. Second, any additional strengthening or redundancy in the electrical power system responsible for powering shutdown during a seismic event would further reduce reactor sensitivity to a tsunami.
Learning Check Point
Please take a few minutes to think about what you just learned then answer the question below.
Tacloban, Philippines, and Super Typhoon Haiyan
Tacloban, Philippines, and Super Typhoon Haiyan
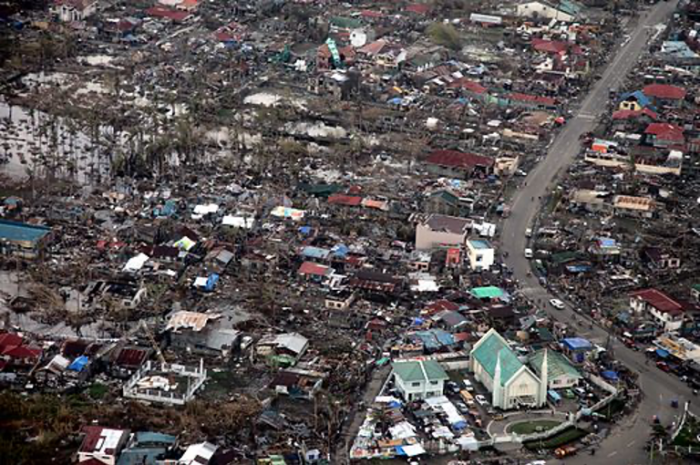
On November 8, 2013, Super Typhoon Haiyan (locally known as Yolanda) swept across the Philippines, generating a storm surge of more than 5 meters in places and winds in excess of 190 mph. Fifteen million people felt the effects of the storm directly. Across the nation, approximately 4.1 million people were displaced from their homes, and more than 6,000 lost their lives. This made Haiyan the deadliest storm recorded in the Philippines. The nature of the storm itself, the geology and geography of the Philippine Islands, as well the population distribution and economics of the people living in the affected communities all contributed to the severity of the impact of Haiyan on communities. What made Tacloban so vulnerable? We can break it down into the components of vulnerability to understand this,
Exposure
Tacloban City is densely populated with more than 240,000 residents, many of whom are poor. Much of the city sits at low elevation, with many parts, including the airport, sitting below 5 meters above sea level. The storm surge was reported to be more than 5 meters (16 feet) in height. Population density, at 1200 people per square km, or about 3,000 per square mile makes for a densely populated urban area. The Philippines is highly prone to typhoon activity, with twenty tropical cyclones crossing the island chain per year on average, with ten of those reaching typhoon status, and five of these causing major destruction. These factors render the Tacloban city highly exposed to typhoon hazards.
To appreciate the level of destruction and conditions in the immediate aftermath of the typhoon in Tacloban City and some of the factors that combined to create such levels, please read the two articles (BBC and New York Times) linked below. In the BBC article, there is a short video that really helps to bring to life the misery following a catastrophe such as this of a densely populated city such as Tacloban.
.jpg)
.jpg)
![By Juliancolton (Own work) [Public domain], via Wikimedia Commons](https://commons.wikimedia.org/wiki/File:Hurricane_Evacuation_Route.jpg)
Sensitivity
Remember that by using the term sensitivity, we are referring to such measures as poverty levels and the state of infrastructure. Because Tacloban was essentially destroyed by Haiyan, everyone in the city was impacted (see maps in linked articles). But the high level of poverty that exists in the Philippines accentuated and increased the scale of suffering. According to the Humanitarian Practice Network, the Philippines ranked 165th in world GDP in 2013, and approximately 2 million people in the country were living on $2 per day. Tacloban is a relatively wealthy city within the Philippines, so this rate of poverty is not as severe in the city as some parts of the Philippines. However, even though the government had a relatively good typhoon preparation program in place, poverty levels, coupled with the sheer size of the storm, rendered preparations ineffective. Houses were not designed for the power of the storm surge and winds and were completely destroyed, leaving people homeless. The sensitivity of the low-lying infrastructure of the airport is another case in point. It sits close to sea level and was overwhelmed by the storm surge. Of course, an airport in an island nation is essential for disaster relief, so this hampered relief from reaching the stricken city immediately following the storm. It was three days before flights could land with relief supplies, and even then, only small planes could land. This led to a lack of basic supplies such as food and water for the residents. Long lines formed for scarce supplies. Refer to the BBC article in the readings linked below, which describes in detail the scenes of deprivation that ensued in the days following the typhoon. In addition, not only were roads and other transportation routes blocked, there would have been no working electricity or modern methods of communication in the aftermath of such a huge storm.
Adaptive Capacity
The poor are at a disadvantage when it comes to recovery. Those with financial means are more able to get back on their feet or bounce back from a disaster than those with few financial means. Many of those who lost livelihoods to Haiyan worked in the fishing industry and were poor. Two major elements worked to help the people of Tacloban and other communities devastated by Haiyan. One is the strong community networks that are so important, in which community members and families help each other. The other is aid from domestic and foreign governments and non-governmental organizations.
Currently, after nearly one decade, Tacloban’s economy is growing and the poverty rate has been lowered. This economic rapid bounce-back may be a phenomenon of a city that has to start from scratch. New Orleans also went through a rapid growth phase in the 10 years after Katrina. Sustaining this healthy economy will be the challenge and if Tacloban is successful, then it will prove its strong resilience and high adaptive capacity.
References and Recommended Reading
References
- Humanitarian Practice Network: Typhoon Haiyan: pushing the limits of DRR? [35]
- Humanitarian Practice Network: Assessing early warning efforts for Typhoon Haiyan in Leyte [36]
- The Guardian: Two years after typhoon Haiyan, leaders have a duty to act on climate change [37]
Recommended Reading
- Tacloban: City at the center of the storm (BBC) [38]. This article contains both images and video. Please note that the video contains disturbing images.
- Mapping the Destruction of Typhoon Haiyan (New York Times) [39] This article includes maps showing the path of the storm across the Philippines.
Module 11 Lab: Discussion
Module 11 Lab: Discussion
Reflecting on Coastal Community Vulnerability
Overview
In this module, you learned about the components of vulnerability as defined by coastal policy experts. You read many case studies that helped to illustrate the components of vulnerability: exposure, sensitivity, and adaptive capacity.
For the Module 11 lab, we will spend time reflecting on what makes one coastal community more vulnerable than another and how they might reduce their vulnerability to coastal hazards. You will read the following statement and respond appropriately based on your knowledge of module concepts. You will respond to at least one other student's response throughout the week.
Discussion Prompt
Using one or two of the case studies from Module 11 (and listed in Required Resources), in this discussion, consider how adaptive capacity may be increased to reduce the vulnerability of a coastal community. Be specific in terms of location and coastal hazard.
Instructions
- Use Word or another text editor to respond to the prompt with your thoughts backed up with evidence from the Module 11 case studies. The length of your response should be about 200 to 400 words. (Typing your response in Word or another text editor and then copying/pasting from Word or similar to the discussion forum is recommended to avoid losing your work midstream in the event of an accidental browser closing, intermittent Internet connectivity, etc.)
- Go to Module 11 Lab (Discussion) and type or copy/paste your response to the prompt into the text box marked 'reply' and select Post Reply by 11:59 p.m. on Tuesday to allow time for responses. Your response is now visible to your classmates and your instructor.
- Read through others’ responses and write a thoughtful reply to at least one other student by 11:59 p.m. on Thursday. These replies should be either a rebuttal in which you add your ideas in the form of a persuasive argument (written with respect for the originating author), or a response that agrees with, supports, and builds upon the original response. Because a timely response to the conversation is part of your grade, subscribing to the forum is required. Check in to the discussion forum often throughout the week to post and respond to comments.
Grading
The grading rubric will help you understand what constitutes an appropriate level of participation on your part. The instructor reserves the right to not award any credit (including points for timing and interaction) if the content of the posts, however on-time they may be, are off-topic, offensive, or otherwise inappropriate. Such posts may be deleted at any time by the instructor as well.
| Content | Addresses all facets of the assigned discussion prompt, with accurate supporting detail where necessary. Response post is at least 200-400 words of substantive content addressing the prompt. Posts are appropriately cited as needed. To earn full credit in this category, your comments and replies to classmates must demonstrate thoughtful consideration of the topic and go well beyond, "I agree with you." | 6 Points |
|---|---|---|
| Formatting and Mechanics | Posts should be edited and cited appropriately as needed. While a discussion forum has an informal tone, please refrain from foul or offensive language, texting abbreviations, etc. | 2 points |
| Timing | This assignment is deliberately structured to allow you to participate throughout the week. Your initial response to the statement should be shared by 11:59 p.m. on Tuesday and your response to at least one other classmate by 11:59 p.m. on Thursday to allow for authentic discussion to occur. | 2 points |
Summary and Final Tasks
Summary and Final Tasks
Summary
We have introduced the three dimensions of vulnerability – exposure, sensitivity, and adaptive capacity – with a focus on coastal disaster contexts. In addition to showing how to quantify these dimensions of vulnerability, we have also shown how this model of vulnerability can be used to assess and compare the physical and social vulnerabilities of different coastal settings and populations. In the activity at the end of this module, you explored how the vulnerability model can be used to compare the vulnerability of three coastal communities to hurricanes. The case studies were meant to help you think about sensitivity as a component of vulnerability. Sensitivity can be related to physical factors, such as age and quality of infrastructure, as in the Fukushima Daiichi nuclear power plant and Florida mobile home examples, or it can be related to social factors, as in the Indian Ocean tsunami example. Although lessons from each of these examples are generalizable in the broad sense, it is important to think about vulnerability, including sensitivity, in a place-specific, localized manner. For example, issues related to mobile home sensitivity to hurricanes, although relevant in many parts of Florida, are not relevant to all places exposed to hurricanes. Likewise, many countries that are exposed to tsunami hazards either do not use nuclear energy or do not have any plants in tsunami hazard zones. In these places, the lessons of the Fukushima Daiichi disaster are only applicable in the generalized sense, i.e., that seawalls should be high enough to protect key resources from the highest waves likely to occur based on current science, and that critical resources requiring electrical power incorporate redundancy.
In the following modules, we will apply the concept of vulnerability to three kinds of coastal hazards: tsunamis, hurricanes, and sea level rise. We will also discuss policies in relation to those hazards. While tsunamis and hurricane hazards are short-term hazards that exist a few hours to several days, sea level rise is a medium- to long-term hazard that shows its impacts slowly over decades. We will discuss tsunamis and hurricane hazards, the two short-term hazards in the next module, and discuss sea level rise, the medium- to long-term hazard, in the following module.
Reminder - Complete all of the Module 11 tasks!
You have reached the end of Module 11! Double-check the to-do list in the Module 11 Roadmap to make sure you have completed all of the activities listed there before you begin Module 12.
References and Further Reading
- Frazier, T. G., N. Wood, B. Yarnal, and D. H. Bauer. 2010. Influence of potential sea level rise on societal vulnerability to hurricane storm-surge hazards, Sarasota County, Florida. Applied Geography 30 (4):490–505.
- Polsky, C., R. Neff, and B. Yarnal. 2007. Building comparable global change vulnerability assessments: the vulnerability scoping diagram. Global Environmental Change 17 (3):472–485.
- Yarnal, B. 2007. Vulnerability and all that jazz: Addressing vulnerability in New Orleans after Hurricane Katrina. Technology in Society 29 (2):249–255.