Putting Sea Level Change in Context of the Earth’s History
Putting Sea Level Change in Context of the Earth’s History
Thinking in the Long Term: Sea Level Change in Geologic Time
The instrumental data we explored above gives a small window of time in Earth’s recent history. To put the recent changes into context, we need to also consider long term changes in sea level.
Humans typically have difficulty thinking about time beyond a human lifespan. Geologists may be the exception to this rule, but you may belong in the category of those who find it difficult to visualize the long distant past and the long distant future and to think in terms of millions or billions of years (or even thousands of years). But understanding the changes to atmospheric and ocean changes in the geologic history of the Earth is important if we are to understand what is going on with our climate and sea levels today.
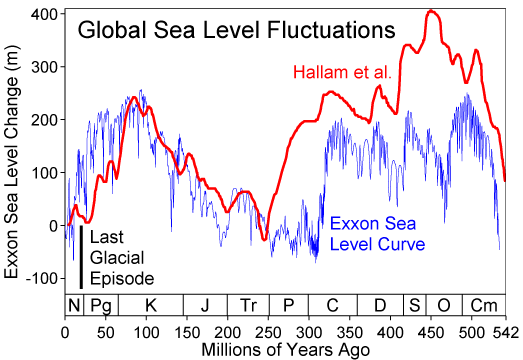
Thinking REALLY long term: Below is a graph plotting sea level over the past 540 million years - since the Cambrian era. For reference, zero on the Y-axis is where the current sea level is. We don’t need to go into a lot of detail, but you can easily appreciate that sea levels have been much higher than today for much of this period of the Earth's history. Scientists have correlated these fluctuations with changes in atmospheric carbon dioxide and ocean and atmospheric temperatures, using methods described in the next few pages.
We also must acknowledge here that some people may argue that sea levels have always fluctuated, so why is sea level rise today a big deal? Hopefully, we can shed some light on this question by looking at the changes in sea level through the history of the Earth, while considering the causes for these changes. But, perhaps the simple fact that seas are rising faster than ever before in human history is enough to facilitate action and adaptation. You also may ask, “What can we do about it?” This question will be addressed in later modules.
For a rapid and fun overview of the history of the Earth’s climate changes, watch the following fascinating monolog video. It summarizes most of the concepts to be discussed in more detail in the materials that follow.
Video: A History of Earth's Climate (11:19)
Click for a transcript of the A History of Earth's Climate video.
We sometimes forget that this planet had a climate long before we showed up and started noticing it and then eventually affecting it, but let's be clear. The climate of this planet has always been pretty not so -- ice ages, completely iceless ages, volcanic winters, crazy methane, and ammonia atmospheres -- you name it. Our climate is influenced by a whole series of cycles, some incredibly long, some lasting only a few thousand years. These cycles have been churning along for hundreds of millions of years, and in most cases, they'll continue long after we are gone.
A look at the history of climate change on Earth can give us some much-needed perspective on our current climate dilemma because the surprising truth is what we're experiencing now is different than anything this planet has encountered before. So, let's take a stroll down Earth's climate history lane and see if we can find some answers to a question that's been bugging me a lot lately -- just how much hot water are we in, exactly?
Over the past 540 million years or so, Earth's environment has experienced a few large fluctuations between two very different states: greenhouse and icehouse climates. During greenhouse periods, there's a lot more liquid water on the planet and very little, if any, ice at the poles. During icehouse conditions, the global climate is cold enough to support large sheets of ice at both the poles. The most recent transition between these phases occurred about 55 million years ago when Earth reached thermal maximum, the peak of its last greenhouse state. Back then, there were turtles and palm trees at the poles, and the equator, we can assume, was pretty inhospitable. Then a long process of cooling started, ultimately resulting in an ice age that we are currently experiencing at this very moment. But, of course, Earth's climate doesn't just change for no reason, so what happened?
Well, one theory is that the Arctic Ocean was subject to a huge bloom of freshwater fern called Izola, which eventually died and sank to the seafloor, taking with it a massive load of carbon, which is, of course, coming from carbon dioxide, a greenhouse gas. So, with less carbon dioxide in the atmosphere, the earth began to cool until we landed in a great big ice house. That fern is a good example of how living things can influence the climate over long periods because, over time, there's been a big give-and-take between oxygen, which is manufactured by plants and consumed by animals, and carbon dioxide, which is spewed out by animals and used by plants. The relative abundance of these gases has a lot to do with what the climate is like at any given time. When there's a lot of greenhouse gases like carbon dioxide and methane in the atmosphere, they trap heat to create a greenhouse effect; when there's less CO2 and other greenhouse gases in the atmosphere, the planet cools down. But, of course, when it comes to the really long-term cycles, we have to talk about that all-important climate influencer which you could probably guess at: the Sun, which can affect climate in a bunch of ways.
For starters, the Sun hasn't always been as bright as it is now. When the earth was young, the Sun itself was just a baby -- less than a billion years old and about 70% dimmer than it is today. Nowadays, the Sun has some serious stability, but it still varies a bit. Fluctuations in the sun's energy export run in 11-year sunspot cycles. During periods of maximum solar activity, the Sun emits about 0.1% more energy than during Sun SPOT minimums, so not a lot. The sunspot cycle has at best a subtle impact on earth temperatures. But, on top of that, variations in the Earth's orbit and inclination toward the Sun also cause temperature fluctuations. Over millions of years, the shape of the Earth's orbit around the Sun varies from nearly circular to elliptical. This causes the distance from the earth to the Sun to vary during its orbit and with it the amount of solar energy we receive. This phenomenon is called orbital eccentricity, and it occurs in cycles of about a hundred thousand years. Right now, scientists think we're probably somewhere near the minimum of this cycle with the distance from the Sun only changing slightly in a single orbit enough to create about a six percent difference in solar radiation throughout our orbit. But, when the earth is at the peak of this cycle, the amount of the sun's energy we receive can change as much as 30 percent in a year, which means crazy big fluctuations in climate. While orbit changes, so does the tilt of the Earth's axis as it spins through space. The earth wobbles a bit changing its angle with respect to the Sun and cycles that run about 42,000 years. So, right at this moment, the earth tilts at a twenty three point four degree angle, but, over the eons, that can change from as small as 22 point one degrees to as much as 24 point five degrees. The steeper the angle, the more the poles are directed toward the Sun, which makes for far greater extremes as the seasons change with the poles being way warmer in the summer and much, much colder in the winter.
A lot of the changes in prehistoric climate seem to coincide with these cycles, particularly the changes in Earth's orbit, and while nothing is completely certain at this point, many experts think that these orbital cycles have had huge influences on the cycles of climate change that we find in the record of recent geologic history. So, while these are the most general climate influencers that we know about today, it wasn't like this at first. Between 4.5 and 3.8 billion years ago, when the earth was just a baby, there was no climate to speak of. The surface was just molten lava, and it was real hot up in here. After the atmosphere eventually cooled enough for it to rain, oceans formed and land masses appeared. At that point the Sun was way cooler, but the Earth's atmosphere, which consisted mostly of ammonia and the greenhouse gas methane, kept the planet nice and toasty. Between 2.5 billion and 500 million years ago, oxygen levels rose dramatically. much of the life that had managed to take hold by then was anaerobic or lived without oxygen, but thanks to the evolution and hard work of kajillions of photosynthetic algae called cyanobacteria, which started pumping out oxygen like nobody's business, the composition of the atmosphere changed to the point where a whole lot of anaerobic life couldn't deal. This oxygen boom resulted in the great oxygen catastrophe, one of the most significant extinction events in Earth's history. Well, it was a catastrophe for the anaerobic bacteria in the archaea, but a nice bit of luck for us, who wouldn't happen along for another couple billion years or so. I guess it's all about perspective.
There was probably a big cooling around this time too, partly because of the rise in oxygen and most of the methane being removed from the atmosphere at the peak of this cooling period. It's thought that the average temperatures at the equator were about what they are in modern-day Antarctica. Some scientists think that the entire globe essentially froze, resulting in what they call a snowball earth. Between 500 and 250 million years ago, the planet's core cooled down to the temperature it is today, so volcanic eruptions became rare. It's during this time that we see the Cambrian explosion where multicellular life evolved like crazy in the oceans. Photosynthetic organisms on land turned out oxygen, but there weren't yet enough aerobic organisms to breathe it in and pump the CO2 back out, so earth stayed pretty chilly.
250 to 65 million years ago, all that changed. By then, there were lots of critters on land exhaling all that CO2. Pangaea, the huge honkin supercontinent, was also starting to break up, so more land was coming into contact with the oceans' increasing humidity and helping drive the climate into a warming period. This culminated at a time when temperatures were about 10 degrees Celsius higher than they are today and pretty uniform all over the globe. Then another climate change driver intervened.
The reigning theory is that 65 million years ago, a 200 kilometer-wide asteroid smashed into what is now Mexico; sprang up nine hundred quadrillion kilograms of flaming rock into the atmosphere. This probably caused an impact winter that was likely enough to kill off all the large dinosaurs and allow mammals to kind of take over. Just ten million years later, we began the run-up to that thermal maximum I mentioned earlier. About 55 million years ago, the planet experienced sudden warming, which sent global temperatures up five to eight degrees Celsius in just 20,000 years. It didn't last very long, and what exactly caused it is a matter of debate, but the geological record shows that there was a huge infusion of carbon into the environment.
One of the most popular hypotheses is that it came from methane being released from sudden melting of methane containing ice under the seafloor and at the poles something happened, say undersea volcanic activity or a peak and one of the solar cycles we talked about, to melt this methane ice. And once it was unleashed into the atmosphere, we were all in greenhouse city. Because of this little escapade, the earth went completely ice-free. The opposite of snowball earth, sometimes called greenhouse earth or hothouse earth, and in addition to creating an ideal climate for warm-blooded creatures like us mammals, this also allowed for the proliferation of more plant life, including that huge bloom of Izola freshwater fern, so levels of greenhouse gases started to tank yet again.
But when the next cooling trend began, this time it was different. About 35 million years ago, glaciers started to form in Antarctica for the first time, in part because there was no Antarctica before. See, while all the cycles that we've been talking about kept churning, the continents were also sliding around on the Earth's surface until land masses appeared at the South Pole that allowed glaciation to take place. Meanwhile, other formations that didn't exist before, like the Himalayas and the Atlantic Ocean, had taken shape, which helped to amplify and circulate the cooling and thus began a major Ice House climate. When people talk about the ice age, this is usually what they mean, and because there's still permanent ice to be found, we're technically still in it.
But this cooling hasn't been consistent within this ice age. There have been small warming events interspersed with even cooler events, where average temperatures were about five degrees Celsius cooler than today. In fact, in the past 2.5 million years there have probably been around 25 glaciations or cold periods, sometimes called little ice ages, interspersed with interglacials which are warmer periods. You might notice that that comes out to about one climate swing every 100,000 years, which coincides with that orbital pattern we talked about and that brings us up to now, or, you know, within about 12,000 years of now, which is yesterday in geologic time.
So, you've heard of the hockey stick, right? This is the graph depicting the average global temperatures over the last two thousand years or so based on what can be gathered from historical data -- tree rings, corals and ice cores -- you'll notice that average temperatures increased dramatically during the 20th century, which is when we started relying heavily on fossil fuels to power our everything. This graph came out in 1999 using data collected by Penn State climate scientist Michael Mann, who has taken an incredible amount of heat for this research over the past 15 years.
But new research reconstructs global temperatures further back than Mann did -- eleven thousand three hundred years back, using fossilized plankton dug up by oceanographers from 70 sites worldwide. On one hand, it shows that temperatures for about 20 percent of this historical period were actually higher than they are today, but it also shows that right now temperatures are increasing faster than they ever have. In the past 100 years, temperatures have risen so dramatically that they have canceled out all of the cooling that took place over the past 6,000 years. And probably more important, the study shows that in addition to being in the middle of a long term ice age, we should now be entering the bottom of a several-thousand-year-long cooling period even if it were just natural factors, but it's not.
So, this new evidence pretty much corroborates what's already known. That we're making a mess. But one thing's for sure, our planet's climate has dealt with a lot and it'll probably survive humans. But what the cost will be for us? We're going to need some more data on that.
Thanks for watching this episode of SciShow. If you have any questions, comments, or suggestions for us, you can find us on Facebook and Twitter or down in the comments, and if you want to keep getting smarter with us here at SciShow, you can go to youtube.com/scishow and subscribe.
Measuring Sea Level Changes in Earth’s Past
Measuring Sea Level Changes in Earth’s Past
Sea levels change over different spatial and temporal scales. The images produced by altimetry illustrate well the spatial variations, and also provide important data on relatively recent temporal changes. We can examine sea level changes over the short term and long term. Examination of tide gauge data gives us a detailed look at sea level change over a short period of history. These are valuable, but do not show us the whole picture.
If we want to look back at the planet’s ocean levels before people began making measurements, we must use proxy, or indirect measurement. This is the basis of the science of paleoclimatology. Before looking at more information on paleoclimate, we need to understand how these data are obtained.
Paleoclimatology
How do we know what the climate was like 500 million years ago? To reconstruct and understand the fluctuations in climate that have taken place on Earth, scientists use proxy, or indirect data, including data obtained in ice cores, coral, tree rings, and ocean and lake sediment cores.
Paleoclimatologists use various forms of environmental evidence to understand the Earth’s past climate. Earth’s past climate conditions are preserved in tree rings, skeletons of tropical coral reefs, sediment layers in lakes and the ocean, and in the ice of glaciers and ice caps. Using these records, paleoclimatologists can reconstruct climate conditions going back hundreds of millions of years to create graphs such as the one in Figure 4.4 on the previous page.
It was the examination and analysis of ice cores and their trapped molecular contents that revealed the connection between Earth’s atmospheric CO2 and temperature. In order to unlock the information contained in the ice, scientists collect cores and analyze them in slices representing small increments of time, using very precise methods. This way patterns that identify changes in the atmosphere's composition and temperature can be revealed.
For example, the ratio of oxygen isotopes present in the cores ("light" oxygen-16 to "heavy" oxygen-18) can tell the story of global temperatures when the ice formed. Colder temperatures are needed to produce precipitation when water vapor in the atmosphere contains higher levels of oxygen 16.
The paleorecord shows that the Earth’s climate is always changing and that in the distant past (such as the Cretaceous – think end of the dinosaurs’ reign - from 145.5 to 65.5 million years ago), the climate on Earth was much warmer than today and sea levels would have been significantly higher. See Figure 4.4 on the previous page.
The paleoclimate record also shows that in relatively recent geologic time (within the last 2 million years), the Earth underwent a series of glacial periods, which locked much of the Earth’s water in ice which covered the Northern Hemisphere landmasses. This caused the sea level to drop much lower than today (more than 400 ft. below current levels). We are currently in an “interglacial” period during which the Earth has warmed, and the sea level has risen.
Paleoclimate records can also help to shed light on the more recent changes and provide evidence for the anthropomorphic effects on climate and sea level, correlating an unprecedented rapid rise in sea level with increased carbon dioxide in the atmosphere. More on that later.
Required Reading
Please read the article on how scientists use ice cores to reconstruct past climates, "Climate at the core: how scientists study ice cores to reveal Earth’s climate history [3]".
Sea Level in the Past 200,000 Years
Sea Level in the Past 200,000 Years
Let’s look at how sea levels have changed over the past 200,000 years of Earth’s history, based on evidence provided by paleoclimatology.
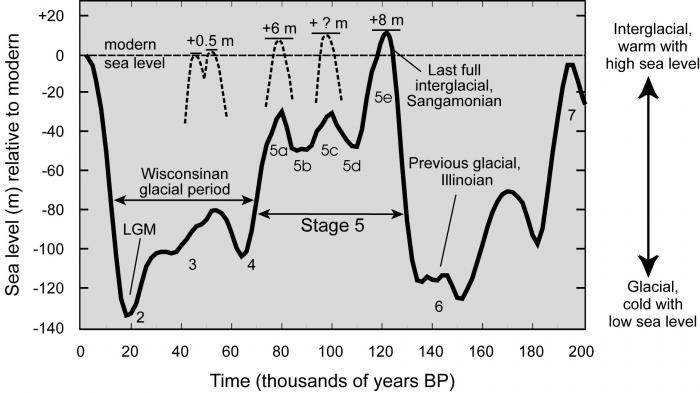
Probably, the factor that influences sea levels on the planet more than any other is the proportion of the Earth’s water that is in the form of ice at any point in time.
The figure below illustrates this very well. Take a look at the curve on the graph, obtained by analyzing oxygen isotopes in ice cores. It represents the fluctuations in sea level from 200,000 years ago to the present (going from right to left on the x-axis). Approximately 125,000 years ago, the sea level was approximately 8 meters higher than it is today. This was during the Sangamonian Interglacial, the last time the north polar ice cap completely melted. After this peak in sea level, ice returned to the planet. And the Wisconsinan Glacial period followed between 80,000 and 20,000 years ago when a glacial maximum, and sea level low stand (more than 130 m lower than today) took place. This is what most people mean when they refer to the "ice age". Glaciers covered much of North America. Following the glacial maximum, we see sea levels rising rapidly - the curve is about as steep as the one leading up to the Sangamonian Interglacial. It began to level off about 5,000 years ago, leading to fairly slow sea level rise in recent geologic time and the sea level human society has been accustomed to.
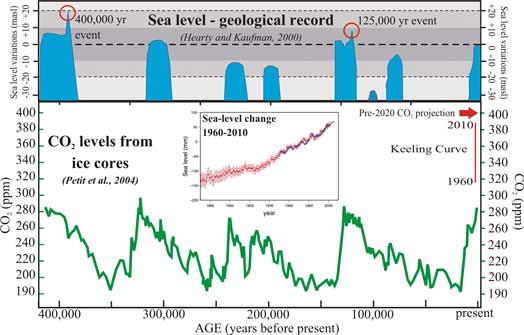
The figure above (Hearty) illustrates the CO2 fluctuations over 400,000 years and the rapid rise to the recently reached 400 ppm level (Keeling curve). These levels are unprecedented during the past 800,000 years. During the Sangamonian interglacial period mentioned above, at about 130,000 years ago, levels reached 300 ppm, but sea level was much higher than today. A CO2 level of 400 ppm occurred in the Pliocene 3 million years ago, when sea level is estimated to have been 10 to 40 m higher than it is now. The concern is that, based on evidence provided by paleoclimate studies such as those illustrated in the two figures above, this rapid increase in CO2 levels can be correlated with the melting of ice sheets leading to an ice-free planet. This melting is currently being watched closely. If all of Greenland’s ice were to melt, an increase of 5-7 m in sea level would be experienced. This is predicted to lead (as well as flooding of all coastal cities on the globe) to the disruption of the circulation of ocean currents (due to the rapid addition of huge volumes of freshwater to the ocean) that currently dictate the climate patterns as we know them in Earth. Of course, the implications of this scenario are huge. Stay tuned, and pay attention when you hear of news related to this phenomenon.
We will return to the ideas presented in these graphs after considering the complex cause and effect mechanisms that control sea levels on the planet.