
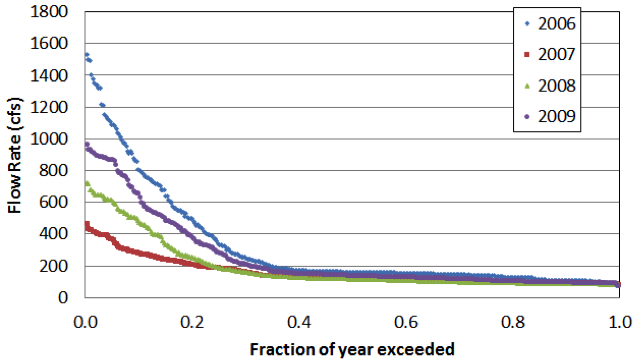
Figure 21. Flow duration curves for the Logan River, in northern Utah for four different years. As the Logan River is a snow-melt dominated system, observed differences in high flows each year (left side of plot) correlate to differences in snowpack in each of the years.
Credit: Patrick Belmont