
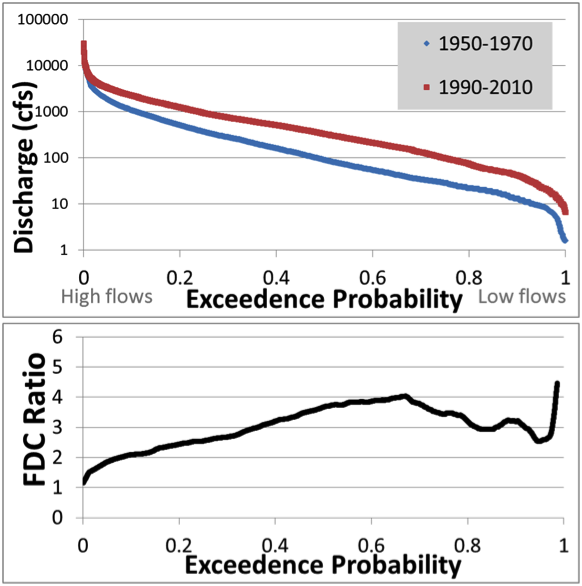
Figure 27. Flow duration curves shown for two different time periods in the Le Sueur River, southern Minnesota. Changes in flows are attributed to changes in artificial drainage of agricultural fields, as well as changes in precipitation and crop type. See Schottler et al., (2014) Hydrological Processes for more information.
Credit: Patrick Belmont