
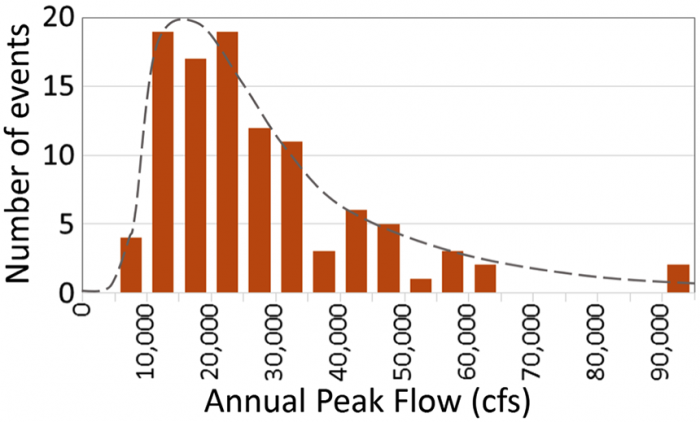
Figure 4. Orange bars show the histogram of the annual peak flows shown in Figure 3 for the Lehigh River. Grey dashed line is a theoretical distribution (a probability density function, or PDF) approximating the complete distribution represented by the histogram of historical data. The PDF can be used to make predictions of flood frequency.
Credit: Patrick Belmont, data from US Geological Survey