
Making Sense of Hydrologic Variability
Video: Advanced Hydrologic Prediction Service (1:37)
This short video introduces the NWS Advanced Hydrologic Prediction Service that provides alerts for droughts and floods in the United States.
Montra Lockwood - Forecaster, National Weather Service, Lake Charles, LA: Floods are one of nature's deadliest natural disasters. Timely and accurate forecasting of floods is vital to the protection of life and property. The Advanced Hydrologic Prediction Service, also known as AHPS, was created for this purpose.
AHPS is a national weather service program designed to provide improved river and flood forecasting. This service provides a suite of text and graphical products that are available online to assist the public, community officials, and emergency managers, in making better life and cost-saving decisions about evacuations and protection of property before flooding occurs. AHPS provides detailed and accurate answers to such questions as, How high will the river rise? When will the river crest? Where will it flood? How long will the flood last? How certain is the forecast? and What are the impacts of the flood? Additional enhancements to the AHPS pages include multi-sensor precipitation information and flood inundation maps for specific locations. To view AHPS information, please visit the AHPS website at water.weather.gov/AHPS. And for more information on flooding and what you can do to protect yourself and your property, visit the National Weather Service's Flood Safety page at nws.noaa.gov/floodsafety.
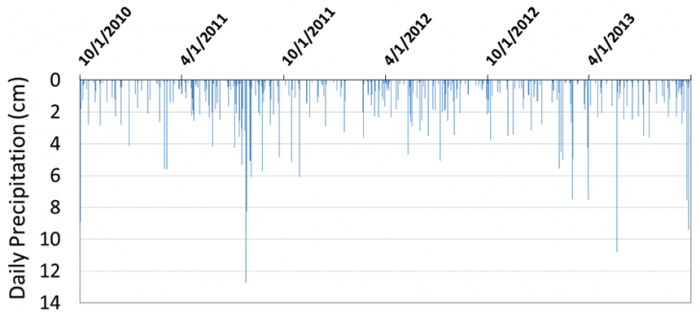
Precipitation and streamflow are both incredibly variable aspects of the environment, often changing dramatically over short time scales and small spatial scales. If you look up the precipitation record for a location of interest (data freely available from the National Weather Service, Natural Resource Conservation Service, and many other outlets), you would see that events seem to happen ‘randomly’, often without an obvious pattern in the frequency, magnitude or duration. Take, for example, the precipitation record for Kingston, New York from October 1, 2010, through September 30, 2013 (Figure 1). There is an immense amount of variability from day to day. So what can we really say about precipitation from these data? July and August of 2011 appear to be a very wet time period, with many events clustered and one event reaching over 12 cm (nearly 5 inches)! Do you think that caused a flood? Precipitation was very sparse from mid-December 2011 to mid-February 2012. Do you think that was a drought?
It is essentially impossible to answer the questions posed above about July 2011 being a flood or winter 2011-2012 being a drought from the precipitation data alone because precipitation is not the only factor that causes floods and droughts. Processes of water use and transport occurring in a landscape also matter. For example, an increased impervious surface associated with urbanization is known to dramatically increase runoff, resulting in much higher peak discharge (bigger floods) for any given amount of rainfall. In contrast, a large rain event occurring on dry soil will have a relatively small effect on streamflow compared with the same rainfall event occurring on very wet or saturated soils, because more of the rain would be absorbed by the dry soil. Landscape processes also influence droughts. While a prolonged lack of precipitation can initiate a drought, the severity of the drought is strongly influenced by the water demand, by vegetation and/or humans, throughout the landscape. Landscape processes can amplify or dampen precipitation variability. This greatly complicates the job of forecasting floods and droughts. Hydrologists must account for numerous factors that vary in time and/or space.
Though it is difficult, hydrologists can make remarkably accurate and timely predictions of floods and droughts. For example, the National Weather Service (NWS) uses large amounts of real-time data from precipitation gauges, radar systems, river discharge gages, and satellite imagery. The NWS maintains a network of 13 river forecast centers and 50 hydrologic service areas that provide real-time flood warnings throughout the US, which can greatly reduce loss of life and property damages.
| Date | Daily Precipitation (cm) |
|---|---|
| October 1, 2010 | 3 |
| April 1, 2011 | 2.25 |
| October 1, 2011 | 5 |
| April 1, 2012 | 1.5 |
| October 1, 2012 | 3.75 |
| April 1, 2013 | 7.5 |