
Contaminant Example 2: "Dead Zones" and Excess Nutrient Runoff
A major issue in pollution of surface waters is the role that excess nutrient flows from polluted waterways into lakes, bays, and coastal zones play in creating excess biologic production in surface waters and dissolved oxygen at depth. In most cases, this nutrient-rich runoff results from agricultural operations, including the application of fertilizer to crops. Of course, such issues have already been briefly highlighted for the Chesapeake Bay in Module 1, but such so-called "Dead Zones" are globally widespread. It is, perhaps, easier to understand impacts on more restricted bodies of water (lakes, bays) with high fluxes of water from nutrient-laden rivers (such as the Chesapeake Bay setting). But, such issues also plague some coastal zones characterized by high river discharges. For example, the Gulf Coast "dead zone" has been recognized for over a decade and is attributed to high rates of nitrogen (and phosphorus) discharge through the Mississippi River system. Watch the following video from NOAA that provides a dead zone 'forecast' for 2019 and explains in general how dead zones form in the Gulf of Mexico and their impacts on the region.
Video: Happening Now: Dead Zone in the Gulf 2019 (1:59)
Dead Zone 2019 forecast and explanation
Figure 6. Click for a transcript of Happening Now: Dead Zone in the Gulf 2019.
NARRATOR: The numbers are in. The 2019 Gulf of Mexico Hypoxic Zone, or Dead Zone, an area of low oxygen that can kill fish and marine life near the bottom of the sea, measures 6,952 square miles. This is the 8th largest dead zone in the Gulf since mapping of the zone began in 1985! It begins innocently enough. Farmers use fertilizers to increase the output of their crops so that we can have more food on our tables and more food to sell to the rest of the world. But it is this agricultural runoff combined with urban runoff that brings excessive amounts of nutrients into waterways that feed the Mississippi River and starts a chain of events in the Gulf that turns deadly. These nutrients fuel large algal blooms that then sink, decompose, and deplete the water of oxygen. This is hypoxia - when oxygen in the water is so low it can no longer sustain marine life in bottom or near bottom waters - literally a dead zone. When the water reaches this hypoxic state, fish and shrimp leave the area and anything that can't escape like crabs, worms, and clams die. So, the very fertilizers that are helping our crops are disrupting the food chain and devastating our food sources in the ocean when applied in excess. If the amount of fertilizer, sewage, and urban runoff dumping into the Gulf isn't reduced, the dead zone will continue to wreak havoc on the ecosystem and threaten some of the most productive fisheries in the world.
During summer, 2014, this area of hypoxia (less than 2 ppm dissolved oxygen in the water column near the bottom on the shelf) along the Louisiana and Texas coast was just over 13,000 km2 (>5000 mi2), somewhat smaller than that in 2013. Figure 6 illustrates the extent and severity of oxygen deficiencies during mid-summer, 2013. Coastal currents flowing westward mix and transport nutrients flowing from the Atchafalaya and Mississippi Rivers into the ocean.
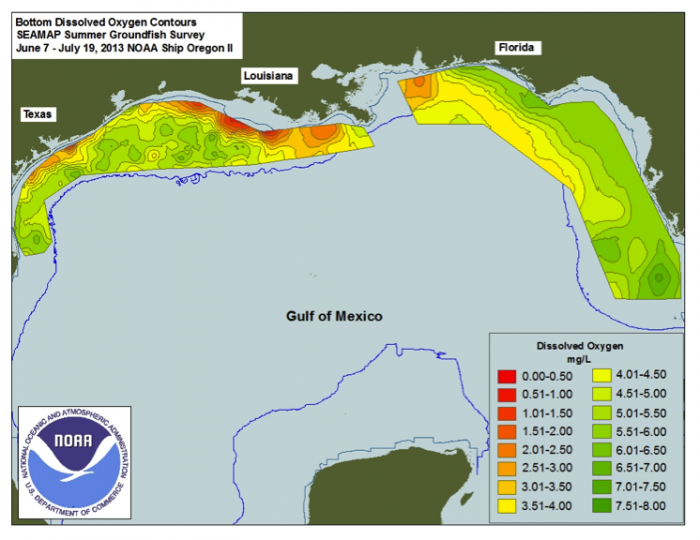
But how do high nutrient fluxes promote oxygen deficiency in coastal regions? The availability of nutrients in shallow sunlit waters near the coast allows prolific blooms of marine plankton (primary photosynthesis) which produces large amounts of organic matter. Nutrients can be a good thing and can benefit the entire food chain unless the fluxes of N and P reach an extreme termed "eutrophic" conditions. As the organic matter sinks to the bottom, it is a food source for consumer organisms (both in the water column and on the bottom), including bacteria. Shrimp, bivalve, and fish catches can increase to a point. In the extreme, the metabolism of fish, bivalves, bacteria and other critters consumes available dissolved oxygen in the water column faster than it can be replenished by mixing from above or laterally by currents. Also, because the coastal waters are warming during summer, they can hold less dissolved oxygen initially. As long as high nutrient fluxes continue the hypoxia expands and the organisms that depend on oxygen to survive either flee if they can swim, or die if they are more sedentary.
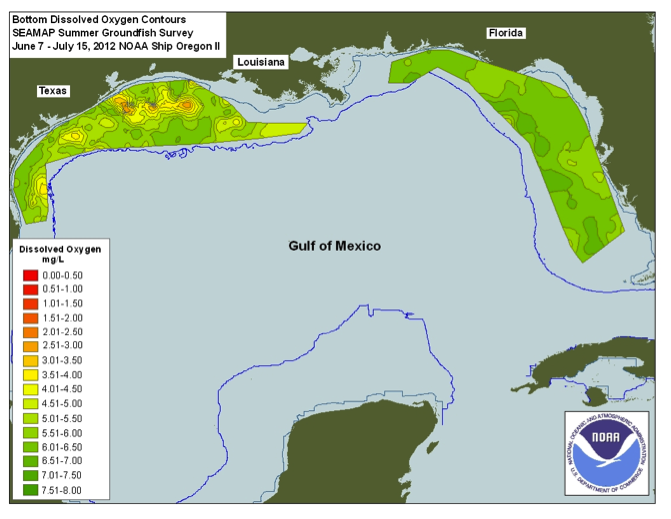
Observations over a number of years indicate that the extent of hypoxia can wax and wane from year to year. In 2012, Louisiana coastal hypoxia was much less extensive and less intense (Fig. 8, contrast with Fig. 7). A severe drought occurred in 2012 in the mid-continent U.S. The flow of the Mississippi River system was much reduced, and nutrient fluxes decreased commensurately.
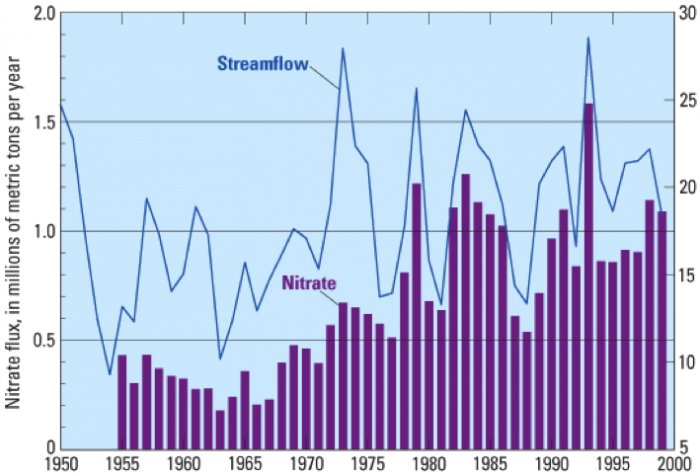
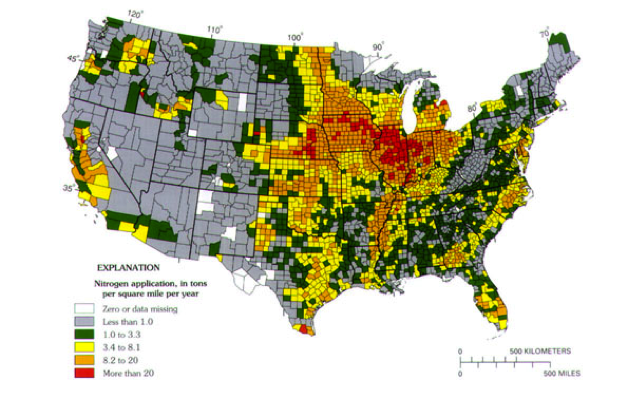
It is also clear from Figure 10 that very high rates of fertilizer application characterize the Mississippi River Basin. Think back to the section called Contaminant Example: Arsenic in Groundwater when you examined nitrate concentration variation in Iowa streams at present. It should be apparent that fertilizer applications and runoff are the main culprits in hypoxia in the Gulf of Mexico.