
Cities in Peril: LA
The Giant Straws of Los Angeles
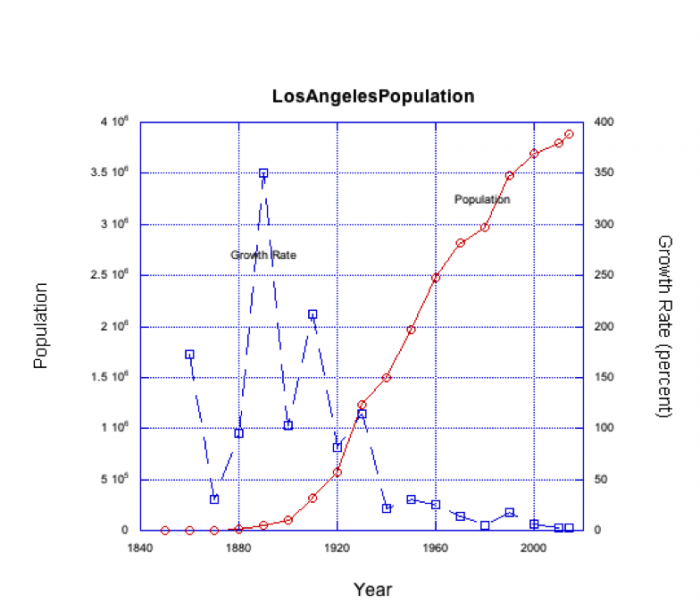
To see Los Angeles, with its lush landscaping and common swimming pools, one would never believe it to be water limited. Los Angeles is a sprawling agglomeration of towns and neighborhoods spread over nearly 470 sq. miles (1220 sq. km) of semiarid hills and valleys (precipitation is about 15 in--38 cm-- annually). One river, the Los Angeles River, runs through the city to the sea, but this watercourse flows only intermittently and--mainly for flood control--has now been straightened and confined to a concrete channel. The City of Los Angeles now has nearly 3.9 million people living within its borders, a far cry from the estimated 1600 people that lived there in 1850 when (a smaller footprint) LA was first incorporated (Fig 1). By 1900, LA's population had grown to over 100,000, and the local water supply was deemed inadequate. Thus began LA's quest for additional water resources. The subsequent history of water acquisition, especially that of Owen's Valley water and the LA aqueduct (see L.A. Aqueduct Centennial 2013 for pics) engineered by William Mulholland, makes very interesting reading ("Cadillac Desert" by Marc Reisner, p. 54-107). Controversy still surrounds this acquisition. Table 1 shows the major aqueducts that now supply water to LA.
| Aqueduct | Year Complete | Year Construction | Length | $ Cost | Delivery |
|---|---|---|---|---|---|
| Owens Valley and LA Aq | 1913 | 5 | 223 mi | 23mill | 485 cfs |
| Second LA Aq. | 1970 | 5 | 137 mi | 89mill | 290 cfs |
| Colorado River Aq. | 1941 | 10 | 242 mi | 220mill | 1600 cfs |
| California Aq. and West Br* | 1973 | 1960 appop | 701 mi | 5200mill | 4400 cfs |
*California State Water Project: note that the length and cost is for the entire system, not just LA, and the cfs for the West Branch is not what LA alone receives. Source: California State Water Project At a Glance
The second LA Aqueduct was built to take advantage of additional water taken from the Mono Lake drainage through an 11-mile tunnel drilled under the Mono Craters to connect to the Owens Valley system. Today, about 70% of LA's water comes from the Eastern Sierra. The two LA aqueducts supply nearly 430 million gallons per day (about 100 gpd per person in the City of Los Angeles today!). Groundwater wells in the San Fernando Valley and other local groundwater basins supply 15% of water needs, and purchases from the Metropolitan Water District (Colorado River Water and California State Water Project) supply the remaining 15%. Variation in use of each of these sources year by year (Figure 2) is a function of water supply available at the source resulting from drought, competing uses, and other factors. For example, the period between 1987 and 2004 required the purchase of considerably more water from MWD sources (at greater expense) because of severe drought/low snowpack in the eastern Sierra Nevada during that period.
Activate Your Learning: Think about it!
Imagine if your hometown annexed water rights from somewhere as far away as Mono Lake is from Los Angeles. Where would that water come from for your hypothetical case?