
Distant Sources
If you have ever carried your water on a camping or backpacking trip, you know first hand that water is heavy, and therefore that transport is costly and energy-intensive (that’s why there is a market for water filters and iodine tablets!). For example, almost 20% of electricity in California is used for the water-related activity, and much of that to move water across the state. Despite the high energy and economic cost to transfer large volumes of water, it remains the only – and ultimate – hedge against uncertain supply. As you’ve heard from Marc Reisner and George Miller in the Cadillac Desert films we’ve watched, the idea behind many ambitious water proposed water projects in the Western US, many of which never reached fruition, was to “go where there was so much water, you’d never run out”, and construct “pipelines beyond the wildest imagination”. Patricia Mulroy has even suggested that water transfers from the Great Lakes to the American Southwest should be considered in order to serve the greatest good; water rights and export form the Great Lakes watershed is, not surprisingly, a controversial topic.
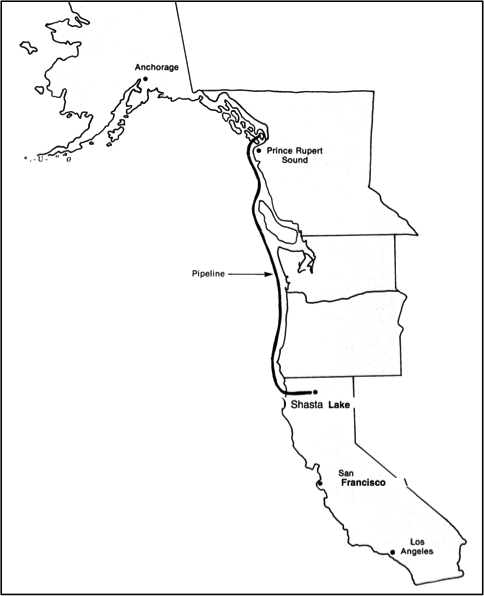
In most instances, large-scale water transfers over huge distances by pipeline or tanker are simply too expensive to make sense, or there is too much political resistance. As one extreme example, in the early 1990s, Walter Hickel (then governor of Alaska) and California congressmen Edward Roybal and George Brown requested a feasibility investigation for a pipeline that would bring water from Alaska to California through a subsea pipeline (Figure 9). The committee estimated that the cost of water transfer would be between $3000-4000 per acre-foot, or approximately triple to quadruple the cost of SWRO desalination. In the same report, the committee assessed other sources of water for California and noted that bringing water in by tanker would cost $1,500-2,000 per acre-foot for contracts of at least 30,000 acre-feet.
In other cases, the economics are not as prohibitive. For example, water is routinely transferred within California, or between Western States (e.g. Colorado River water transferred to Southern CA in the All American Canal) over distances of hundreds or even over a thousand km. This so-called “imported water” is the basis for the cost comparison of alternative supplies. At a yet larger scale, China has recently undertaken the world’s largest water transfer project, the South-to-North Water Diversion Project (or SNWDP). The main driver for the water project is that precipitation, and thus water resources, are very unevenly distributed across China (Figure 10) – and water-scarce provinces account for over 40% of the GDP. At the same time, almost a third of the population (300 million people) have access only to contaminated water – largely because of insufficient clean water supply and/or limited surface water flows that do not flush pollutants from the channel (as discussed in Module 5 – sidebar on the Three Gorges Dam).
The SNWDP will move almost 45 billion m3 of water per year (36 million acre-feet, or ~3 times the Colorado River’s flow), over distances of almost 4500 km. Although the financial benefits seemingly outweigh the costs – and hence the project is moving forward – major drawbacks are inevitable. For example, such a large water transfer is likely to have major impacts on river systems, in terms of changes in flow, sediment transport, and flushing; relocation of people along the route; construction across archeological and religious sites; and environmental impacts on wetlands that may disappear and endangerment of species that have adapted to the natural river flow regime (sound familiar? think back to Modules 3, 4, and 5!)
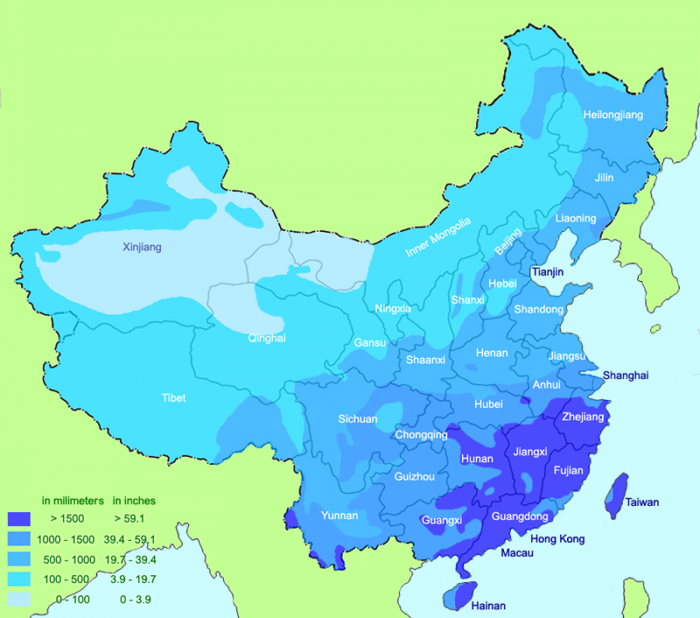
.png#mediaviewer/File:China_average_annual_precipitation_(en).png)