
Issues Accompanying Dam Removal
One of the issues accompanying dam removal is the potential impact of the large volume of sediment that accumulated behind some dams over time. This so-called "legacy sediment" is commonly very fine-grained and contains stored nutrients and organic matter, among other possible pollutants. When dams are destroyed, efforts must be made to avoid a large flux of this sediment downstream as the newly released river cuts down to its natural base level. This requires careful engineering and significant funding. Merritts and Walter (2010) have suggested that most rivers and streams in eastern Pennsylvania and Maryland run through floodplains and levees of legacy sediment, not natural river valleys, created by the plethora of small dams built to impound water for hydropower in the past. And, even now, some large dams serve as a buffer against sediment transport that would create broad mudflats and high turbidity in coastal bays such as the Chesapeake Bay. Conowingo Dam in Maryland is one such structure that is estimated to trap as much as 50% of the sediment carried by the Susquehanna River before it empties into the Chesapeake Bay. There are concerns that this dam only has a bit more than a decade of useful life before it is filled to the brim with sediment, thus imperiling Chesapeake ecosystems (Langland, USGS, 2012). For an example of the engineering and costs of removing a dam, check out the San Clemente Dam Removal & Carmel River Reroute Project in central California.
Many dam removal projects are proposed, but await funding from federal sources—Congress must appropriate funds. Projects on the Snake River and the Klamath River in the west remain controversial, but at least in the case of the Klamath, the Department of the Interior has recommended removal to allow salmon to reinhabit this river. Figure 9 illustrates the consequences of waiting for funding of dam removal using the Olmstead Dam example.
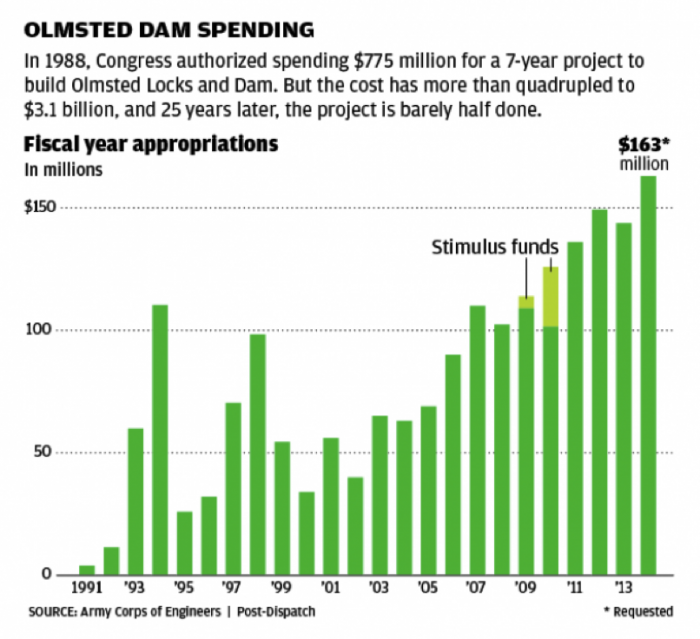
In 1988, Congress authorized spending 775 million dollars for a 7-year project to build Olmsted Locks and Dam. But the cost has more than quadrupled to 3.1 billion dollars, and 25 years later, the project is barely half done.
| Year | Funds in millions |
|---|---|
| 1991 | 5 |
| 1993 | 60 |
| 1995 | 35 |
| 1997 | 70 |
| 1999 | 55 |
| 2001 | 60 |
| 2003 | 70 |
| 2005 | 75 |
| 2007 | 115 |
| 2009 | 115 + 5 in stimulus funds |
| 2011 | 140 |
| 2013 | 145 |
| 2014 | 163 |