
The Geographic Distribution of Water Uses
A deeper look: the geographic distribution of water uses
It is also instructive to look in more detail at the distribution of different water uses. For example, in the U.S., industry is concentrated East of the Mississippi, mainly in the “steel belt” (also known as the “rust belt”) and in Texas and Louisiana (primarily related to oil and gas extraction) – and thus water use for industry is as well (Figure 14). It’s worth considering whether this pattern is ultimately rooted in the timing of settlement and westward expansion in the U.S., availability of fuel (i.e. coal), or availability of water sources and rivers as a means of transportation for goods and raw materials. The pattern of water withdrawal for agriculture in the US is even more dramatic (Figure 15). Large agricultural water withdrawals from surface water and groundwater are dominantly West of the Mississippi. This is evident from a state-by-state map view and shown even more clearly when plotted simply from West to East (Figure 15, bottom panel).
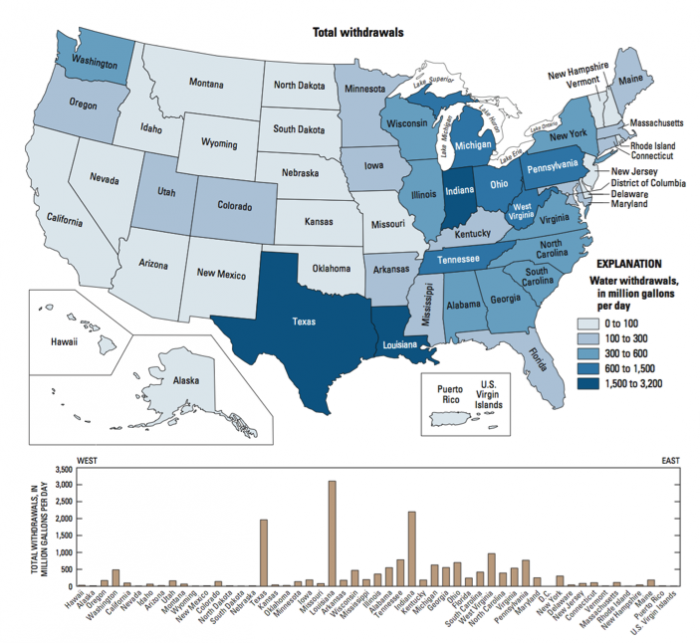
Click link to expand for a text description of Figure 14
| State | Water Withdraws million gal/day |
|---|---|
| Hawaii | 100 |
| Alaska | 100 |
| Oregon | 250 |
| Washington | 500 |
| California | 200 |
| Nevada | 100 |
| Idaho | 100 |
| Arizona | 100 |
| Utah | 250 |
| Montana | 100 |
| Wyoming | 100 |
| New Mexico | 100 |
| Colorado | 200 |
| North Dakota | 100 |
| South Dakota | 100 |
| Nebraska | 100 |
| Texas | 2200 |
| Kansas | 100 |
| Oklahoma | 100 |
| Minnesota | 200 |
| Iowa | 300 |
| Missouri | 100 |
| Louisiana | 3200 |
| Arkansas | 250 |
| Wisconsin | 500 |
| Mississippi | 300 |
| Illinois | 400 |
| Alabama | 500 |
| Tennessee | 800 |
| Indiana | 2400 |
| Kentucky | 250 |
| Michigan | 700 |
| Georgia | 600 |
| Ohio | 650 |
| Florida | 250 |
| South Carolina | 300 |
| West Virginia | 1100 |
| North Carolina | 300 |
| Virginia | 500 |
| Pennsylvania | 900 |
| Maryland | 250 |
| D.C. | 100 |
| New York | 300 |
| Delaware | 100 |
| New Jersey | 100 |
| Connecticut | 200 |
| Vermont | 100 |
| Massachusetts | 200 |
| Rhode Island | 100 |
| New Hampshire | 100 |
| Maine | 250 |
| Puerto Rico/US Virgin Islands | 100 |
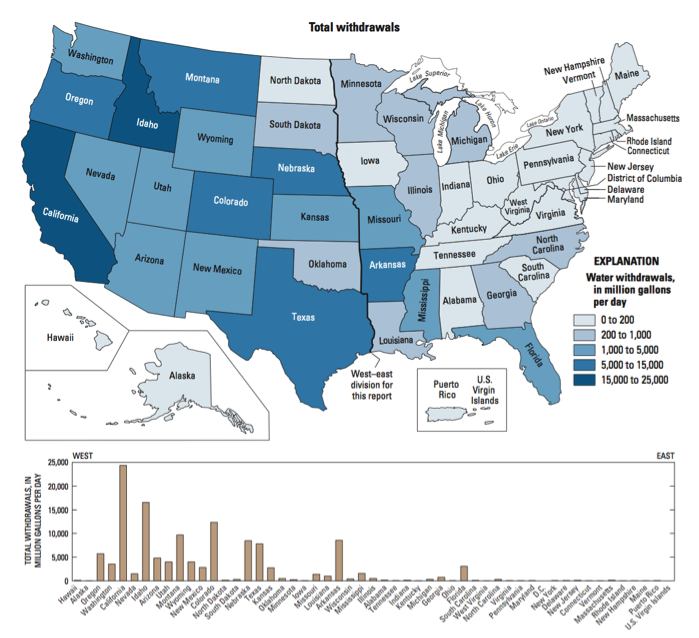
Click link to expand for a text description of Figure 15
| State | Water Withdraws million gal/day |
|---|---|
| Hawaii | 200 |
| Alaska | 200 |
| Oregon | 6000 |
| Washington | 3000 |
| California | 24000 |
| Nevada | 1500 |
| Idaho | 16000 |
| Arizona | 5000 |
| Utah | 4000 |
| Montana | 10000 |
| Wyoming | 4000 |
| New Mexico | 2000 |
| Colorado | 13000 |
| North Dakota | 200 |
| South Dakota | 200 |
| Nebraska | 9000 |
| Texas | 8500 |
| Kansas | 2000 |
| Oklahoma | 500 |
| Minnesota | 300 |
| Iowa | 200 |
| Missouri | 1500 |
| Louisiana | 900 |
| Arkansas | 9000 |
| Wisconsin | 300 |
| Mississippi | 2000 |
| Illinois | 500 |
| Alabama | 200 |
| Tennessee | 200 |
| Indiana | 200 |
| Kentucky | 200 |
| Michigan | 300 |
| Georgia | 750 |
| Ohio | 200 |
| Florida | 3500 |
| South Carolina | 200 |
| West Virginia | 200 |
| North Carolina | 200 |
| Virginia | 200 |
| Pennsylvania | 200 |
| Maryland | 200 |
| D.C. | 200 |
| New York | 200 |
| Delaware | 200 |
| New Jersey | 200 |
| Connecticut | 200 |
| Vermont | 200 |
| Massachusetts | 200 |
| Rhode Island | 200 |
| New Hampshire | 200 |
| Maine | 200 |
| Puerto Rico/US Virgin Islands | 200 |
The source of the water we use also provides clues about where water may be most readily available, and/or where typical rainfall and snowmelt cannot meet demand. Inspect the maps below (Figure 16). Surface water withdrawals are spread more or less uniformly across the U.S., and reflect overall water use reasonably closely. This is influenced in large part by total population, energy production, and industrial and agricultural activity (i.e. CA, TX, NY, and FL are the most populous states). However, groundwater withdrawals (obtained by pumping at wells) are a good indication that surface water flows alone are not sufficient to meet demand.
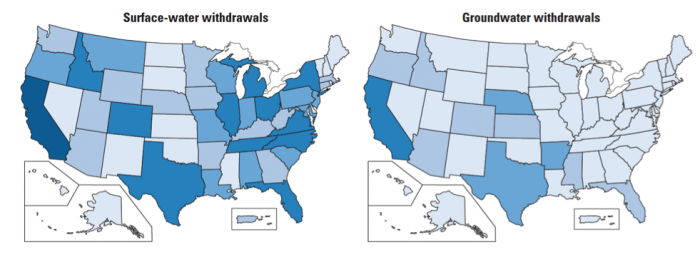
Click the link to expand for a text description of Figure 16
text text
| Amount (million gals./day) | States (random order) |
|---|---|
| 1500-3200 | CA |
| 600-1500 | ID, TX, CO, IL, MI, OH, NY, NC, VA, TN, |
| 300-600 | OR, MO, WI, IN, PA, NJ, DE, SC, AL, LA, AK |
| 300 | All others |
| Amount (million gals./day) | States (random order) |
|---|---|
| 1500-3200 | n/a |
| 600-1500 | CA |
| 300-600 | TX, NE, AK |
| <300 | All others |