
Water Use
How much and for what purposes?
Globally, there is a widely varied usage of water, as a result of differing total populations and population densities, geography and climate (i.e. water availability), cultures, economies, lifestyles, and water use and reuse efficiency. This can be described both in terms of total water abstraction from surface water and groundwater sources and as per capita water withdrawal. It can also be divided to consider the end uses (for example, as percentages of the total use), or to consider the source of the water. Each of these facets of water use illuminates different aspects of the “water story”.
In many industrialized nations, the dominant water uses are for industry (including thermoelectric power generation, manufacturing, etc…) and agriculture (Figures 10-11). In contrast, domestic and municipal water use generally constitutes less than 15-30% of the total. In developing nations, this is somewhat different – total water use is smaller, less is used for industry, and the proportion used for domestic water supply is larger.
In the U.S., the average per capita use of domestic or municipal water (i.e. the most direct uses – those that would be measured by the water meter at your home) is about 215 m3 per person per year, equivalent to 156 gallons per day (as of 2002). For comparison, the total abstraction of water from surface and groundwater sources in the U.S. is about 1700 m3/person/yr, or 1230 gallons per day. The difference in these numbers represents the large proportion of water that goes to so-called “indirect” uses: food production, manufacturing, power generation, and mining, among others.
In contrast, in sub-Saharan Africa, total water use is less than 200 m3 per person per year (less than 12% of water use in the U.S.). Total abstractions in Western Europe are about 600 m3 per person per year, about 850 m3 per person per year in the Middle East; and 1150 m3 per person per year in Australia. Among those nations with the highest water use, agriculture accounts for anywhere from <40% of use (U.S.), to 67-81% (India and China), to as much as 96% (Pakistan). Industrial use (including power generation) ranges from over 80% of total water use to less 1%. In the U.S. water use for power generation is near 50%; in China, it constitutes 25% and in India about 5%. Germany, Russia, Canada, France, and much of Western Europe use around 60% of withdrawn water for power generation. Municipal and domestic water use typically constitutes about 10-20% of the total and varies little among the worlds most populous countries (Figure 9). You can explore these patterns on your own via a useful interactive plotting engine at Gapminder.
It is important to note that because many products are imported or exported across state and national borders, the total abstractions of water in a given place do not necessarily map to the distribution of water “consumption” there. Consider tomatoes that are transported from California to Massachusetts. The water withdrawal from rivers and aquifers needed to grow the tomatoes would appear on California’s “water tab”, but the eventual use of that water would be elsewhere. The same goes for agricultural and industrial products exported internationally. This flow of indirectly used water, embedded in products, is termed virtual water, and is defined as the amount of water used in generation of the product, or alternatively, the amount of water that would be needed to generate the product at the site where it is ultimately used. It is “virtual” because the water use is indirect; it is required to make or grow the item but is not actually physically contained in the item or transported with it.
Consumptive vs. Non-consumptive Use
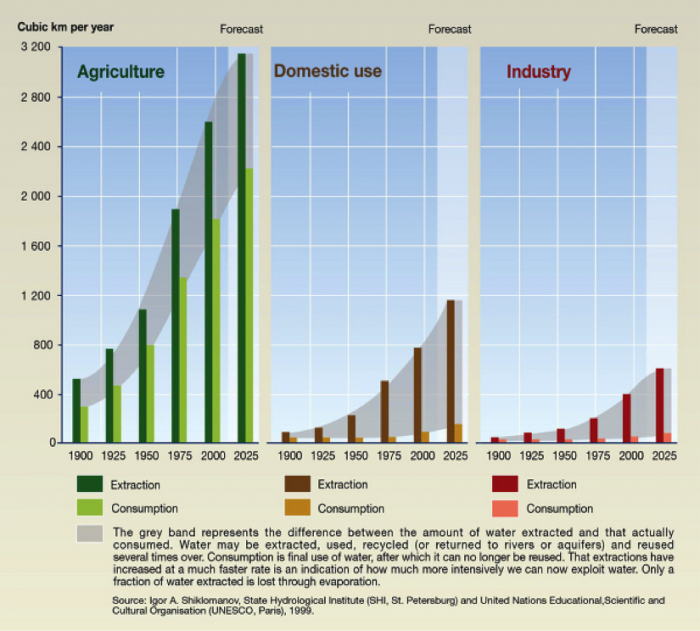
Another important aspect of water use is the degree to which the water is available for recycling and/or reuse (Figure 12; cf. Figure 2). For some water uses, including industrial or domestic applications, the wastewater is captured, treated, and may be reused. These are termed nonconsumptive uses. For example, water used in homes is, for the most part, recaptured for treatment and discharged to surface water or groundwater systems – or for recycling of supply. In this sense, the water is not removed from the system (i.e. not “consumed”). In other applications, the water is effectively removed from the Earth’s surface environment and is not available to be re-captured. These are consumptive uses. Examples include water used for agriculture, which is mostly transpired by plants or evaporated and thus transferred to the atmosphere, or thermoelectric power generation, in which much of the water also evaporates (think of the steam you may have seen rising from power plants – this is consumptive water use, in action!).
Learning Checkpoint
1. Describe the difference between consumptive and non-consumptive water use. Provide an example of each.
ANSWER: Consumptive use means that the water cannot be recovered, usually because it is lost to evaporation or transpiration, or to deep aquifers. Examples include irrigation, lawn watering, and some fraction of the water used for fracking or cooling in thermoelectric power generation. Non-consumptive use implies that the water may be recovered and treated for reuse either by the same users or by downstream users. Examples include many industrial uses and domestic use.
Click here for a text description
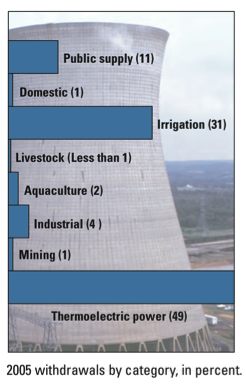
| Usage | Percentage |
|---|---|
| Public supply | 11 |
| Domestic | 1 |
| Irrigation | 31 |
| Livestock | Less than 1 |
| Aquaculture | 2 |
| Industrial | 4 |
| Mining | 1 |
| Thermoelectric power | 49 |
Click here for a text description
Click here to expand for a text description of Figure 13
Learning Checkpoint
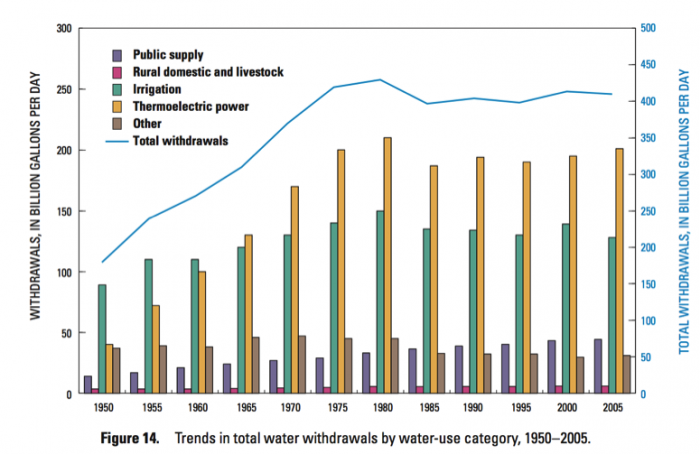
1. Based on Figures 10-13, what are the two largest uses of water in the U.S.?
ANSWER: Irrigation (agriculture) and thermoelectric power generation.
2. Have the dominant uses of water in the US changed much in the past 50 years? If so, how?
ANSWER: Yes, they have. Prior to around 1965, irrigation was the largest use of water in the US. From then to the present, thermo-electric power generation has overtaken it, although the amount of water used for both applications has grown.
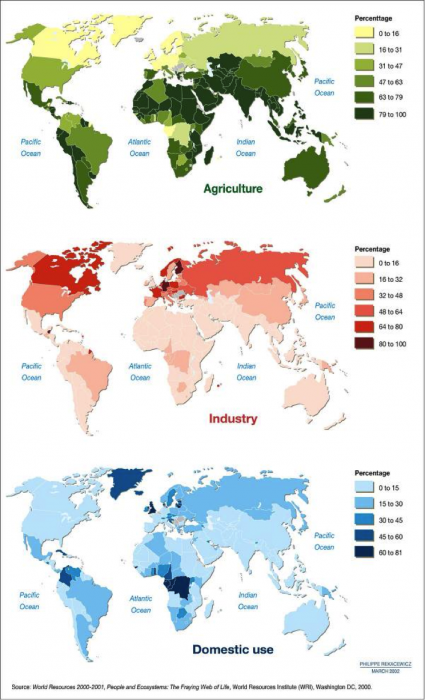
3. Note three regions or countries where the dominant water use is for agriculture (look at Figure 12). Note three where it is for industry. Is this what you would have expected?
ANSWER: Agriculture: mainly in equatorial regions of Africa, Asia, Indonesia, and S. America (dark green in the top panel of Figure 12). Industry: mainly in N. America, Europe, and Russia (pink and red areas in the center panel).
4. How much water do you think you use per day for household or domestic activities (e.g., washing dishes, laundry, showering, cooking, drinking)?
ANSWER: Most people underestimate their use and guess 20-50 gallons per day.