
Increased Impacts of Climate Change on Demand
We would probably be better off examining the impacts of climate change on water availability that would increase "water stress," then compare these stresses with those caused by increasing demand, either by population growth in a given region (personal or agricultural demands) or increased water usage resulting from new demands (e.g., energy production) (Figure 20). A number of studies have predicted water supply vs. water demand relationships resulting from climate change. A study by MIT (Massachusetts Institute of Technology) researchers (Schlosser et al., 2014) compared the potential impacts of climate change, on the basis of projected greenhouse gas emission increases in a complex Earth-system model, on water stress in 282 assessment regions (large or multiple watersheds) globally, holding demand constant, to the potential impacts of population growth in the same regions.
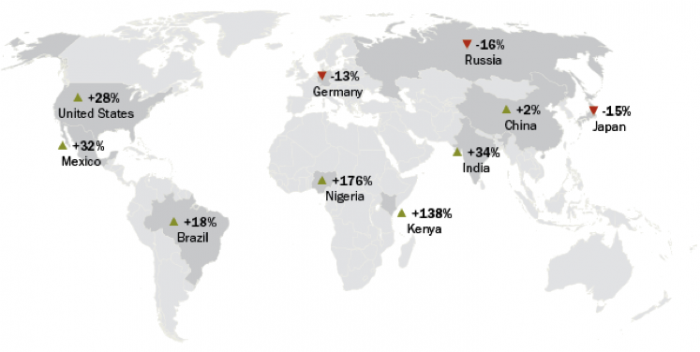
Click link to expand for a text description of Figure 20
| Country | Increase/Decrease | Percent |
|---|---|---|
| US | Increase | 28 |
| Mexico | Increase | 32 |
| Brazil | Increase | 18 |
| Germany | Decrease | 13 |
| Nigeria | Increase | 176 |
| Kenya | Increase | 138 |
| India | Increase | 34 |
| China | Increase | 2 |
| Japan | Decrease | 15 |
| Russia | Decrease | 16 |
They found that, in most regions, projected population growth with increased demand to 2050 was the greater stressor. These researchers use a Water Stress Index (WSI) defined as WSI = TWR/RUN+INF (TWR is total water required for a given watershed region, i.e. all consumptive uses, RUN is available runoff within the watershed, and INF is inflow to the watershed from adjacent regions. The cutoffs used for interpreting water stress are: WSI<0.3 is slightly exploited, 0.3≤WSI<0.6 moderately exploited, 0.6≤WSI<1 heavily exploited, 1≤WSI<2 overly exploited, and WSI≥2 extremely exploited as originally set out by Smakhtin et al. (2005).
It appears that a substantial proportion of Africa, all of the middle East, India, and central Asia will see increased water stress in the next few decades, largely due to projected population increases. Even the southwestern U.S. is projected to experience expansion and intensification of water stress, but, in this case, mostly as the result of climate change and longer-term drought. Interestingly, the major central U.S. groundwater source, the Ogallala Aquifer, does not appear to be a candidate for significant stress except at its southern end in Texas. However, other studies (see Module 7) suggest that depletion of this aquifer will be more severe.