
Measuring the Severity of Drought
Many different indices have been developed over the past several decades to indicate the occurrence and severity of drought. The simplest index relates precipitation amounts during a specific period of time to the historical average during that same time period. For example, precipitation for the month of June 2014 was 15% below the historical average for Wenatchee, Washington. While this statement conveys some useful information, it is not possible to determine whether or not that 15% deficit qualifies for any of the definitions of drought. The number of days with no precipitation is another simple index, but again must be considered in the context of historical data or water demand, and there is no standard definition for what number of days without precipitation would necessarily qualify under any of the four types of drought. Also, if an area receives a very small amount of precipitation (< 0.1 cm) during an otherwise unusually dry time period, a strict interpretation of this index would ‘reset the clock’, but in reality, the severity of the water deficit remains essentially unchanged. Complex phenomena, such as drought, require somewhat complex metrics to be measured in a meaningful way.
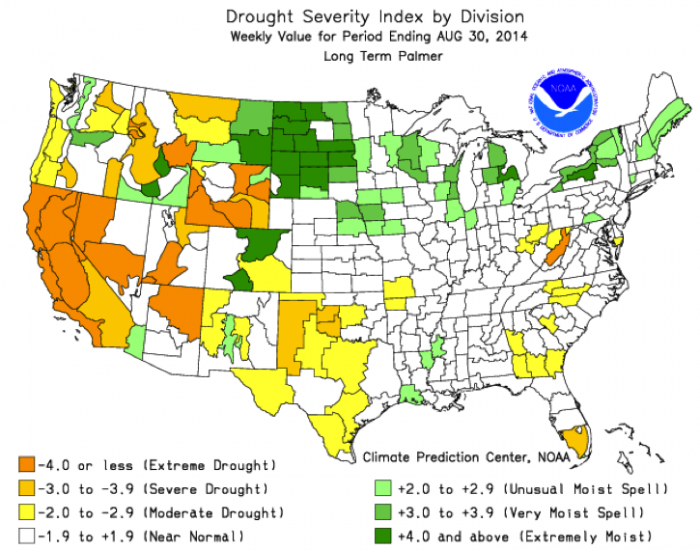
The Standardized Precipitation Index (SPI) is a slightly more complex measure of precipitation deficit that compares measured precipitation to the median historical precipitation over multiple timescales, ranging from one month to 24 months. As dry or wet conditions become more severe, SPI becomes more negative or positive, respectively. Several different indices of varying complexity have been developed to assess drought based on both water supply and demand using multiple environmental criteria. The most common index used to define and monitor drought is the Palmer Drought Severity Index (PDSI), which attempts to measure the duration and intensity of long-term, spatially extensive drought, based on precipitation, temperature, and available water content data. PDSI ranges from values exceeding 4.0, which are considered extremely wet, to values below -4.0, which are considered extreme drought (see Figure 12). Weekly maps of PDSI for the entire US (current and historical) can be viewed on the web page maintained by the National Weather Service Climate Prediction Center.
Related indices are the Palmer Z Index, which attempts to measure short-term drought on a monthly timescale, the Palmer Crop Moisture Index, which attempts to measure short-term drought and quantify impacts on agricultural productivity, the Palmer Hydrological Drought Index, which attempts to estimate the long-term effects of drought on reservoir levels and groundwater levels. An immense compilation of current and historical drought information for the entire US is freely available on the US Drought Monitor web page, maintained by the University of Nebraska National Drought Mitigation Center.
Increasingly, government and industry groups are using ‘cloud seeding’ techniques to induce precipitation and reduce the severity of a drought. One of the potentially limiting steps in the formation of precipitation is the presence of tiny particles (nuclei) on which water can condense and coalesce to form raindrops or ice crystals large enough to begin falling through the air. Cloud seeding is the practice of injecting nucleating agents, such as silver iodide (AgI), into clouds in an attempt to form precipitation. The effectiveness of these approaches is questionable, but under the right conditions, cloud seeding may increase the probability of rain and therefore it is practiced in some semi-arid regions, including the western US. However, questions remain regarding environmental and human health impacts as well as concerns regarding ‘stealing’ atmospheric moisture from would-be recipients downwind.
Learning Checkpoint
1. What was the Palmer Drought Severity Index for the week ending on Aug 30, 2014, for the following locations (see Figure 12 above):
St. Louis, Missouri
ANSWER: 0
Davis, California
ANSWER: -4
Miami, Florida
ANSWER: -3
2. Which of these three locations were likely experiencing socio-economic drought during this time, forcing them to actually change water use/management practices, at least temporarily?
St. Louis, Missouri
David, California
Miami, Florida
ANSWER: Definitely Davis, CA, probably Miami, Fl