
Forecasting and Predictions
Meteorologists have made excellent progress in the past few decades to improve our abilities to forecast when rain events might occur over the next week or so, which facilitates the short-term forecasting of floods and droughts discussed in the paragraph above. However, complex atmospheric dynamics prevent forecasts beyond more than a few weeks in advance. Nevertheless, we must have some basis for making decisions about development, infrastructure and agriculture (e.g., How big should we build a culvert under a road? What size retention basin is needed next to a new housing development? Which agricultural fields will require artificial drainage and which will require irrigation?).
For these longer-term predictions we can use statistics to determine how likely it is that a given location will experience, for example, more than 10 cm of rain in a day, or less than 5 cm of rain during a given month. Many million- and billion-dollar decisions about development and infrastructure are based on such predictions.
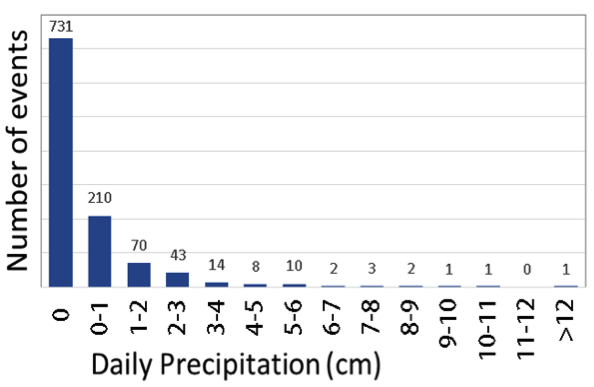
To make these predictions, hydrologists synthesize historical data and use a statistics-based approach to determine the likelihood that a given event might occur. While Figure 1 highlights the ‘messiness’ of precipitation events over time, reorganization of the data provides useful information. Figure 2 shows a histogram of the precipitation data presented in Figure 1. A histogram is a plot showing the number of events that fall within chosen data groups or “bins” (shown on the x axis). From these data you can quickly determine that Kingston, NY experiences no rain about 2 out of every 3 days (731 out of the total 1096 days in this record). Only 10 days in the record had rainfall that exceeded 6 cm, so from these data alone you would expect such large rainfall events to happen 10 days out of 1096, or about 1% of the time. On 210 days during this time period the amount of rainfall was between the minimum measurable (typically 0.025 cm or 0.01 inch) and 1 cm (0.4 inches).
Hydrologists tend to use the term ‘forecast’ when referring to a future projection for which we have a lot of information (and therefore relatively high certainty of when an event might occur and what magnitude it might be). In contrast, hydrologists use the term ‘prediction’ for future projections for which less information is available, and therefore uncertainty is greater.
| Daily Precipitation (cm) | Number of events |
|---|---|
| 0 | 731 |
| 0-1 | 210 |
| 1-2 | 70 |
| 2-3 | 43 |
| 3-4 | 14 |
| 4-5 | 8 |
| 5-6 | 10 |
| 6-7 | 2 |
| 7-8 | 3 |
| 8-9 | 2 |
| 9-10 | 1 |
| 10-11 | 1 |
| 11-12 | 0 |
| >12 | 1 |
Learning Checkpoint
The National Weather Service maintains a Precipitation Frequency Data Server (PFDS) website that allows you to look up the frequency of precipitation events of different duration and magnitude for most locations in the US. The PFDS website will open in a new window. Peruse the website and answer the following questions:
Zoom in on Logan, Utah and place the red crosshair directly over Logan. Below the map a table will appear showing the amount of precipitation associated with a range of time periods (durations shown in left column, ranging from 5 minutes to 60 days) and the average frequency with which such an event might happen (the recurrence interval, listed in years).
1. What is the amount of precipitation that you would expect to get in Logan, Utah on an annual basis, within a 24 hour time period?
(a) 0.1 inches
(b) 0.7 inches
(c) 1.2 inches
(d) 2.4 inches
ANSWER: (c) 1.2 inches
2. What is the amount of precipitation that you would expect to get in Logan, Utah on an annual basis, within a 60 minute time period with a frequency of once every 10 years?
(a) 0.1 inches
(b) 0.7 inches
(c) 1.2 inches
(d) 2.4 inches
ANSWER: (b) 0.7 inches
Zoom in on Chickamauga, Georgia and answer the following questions.
(a) 0.1 inches
(b) 1.3 inches
(c) 2.1 inches
(d) 3.3 inches
ANSWER: (d) 3.3 inches
4. What is the amount of precipitation that you would expect to get in Chickamauga on an annual basis, within a 60 minute time period with a frequency of once every 10 years?
(a) 0.1 inches
(b) 1.3 inches
(c) 2.1 inches
(d) 3.3 inches
ANSWER: (c) 2.1 inches