Transmission
The ability of an aquifer to transmit water – or of an aquitard to slow the flow of water – is the second essential ingredient controlling groundwater movement. It is also the most variable in natural materials; distances in astronomy are the only other quantity in nature that varies over a similar range! For example, the difference in groundwater flow rate for shale vs. gravel is a factor of 1,000,000,000,000 (yup…one trillion). That’s the difference between the size of an iPhone and the distance from the Earth to the Sun.
Groundwater transport properties are described by two related quantities. Hydraulic Conductivity, denoted by K, is a measure of the ability of a particular fluid (usually water) to flow through the rock or sediment. Permeability, denoted by a lower-case k, is often also termed “intrinsic permeability” and describes the ability of the geologic formation alone to transmit fluid. Although related, the key difference is that hydraulic conductivity combines properties of the geologic formation and the fluid, whereas permeability describes only the rock properties. As described in Sidebar 1, the basic concept of hydraulic conductivity emerged from a series of ingenious experiments conducted in the mid-1880s by Henri Darcy, a French Engineer. These experiments led to Darcy’s Law, which forms the foundation for much of modern hydrogeology and petroleum engineering.
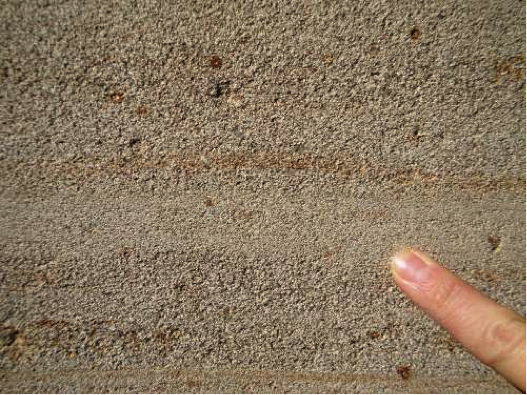
To illustrate the difference between K and k, consider the sandstone in Figure 14 below. The sandstone itself has a permeability, which is controlled by the size of the grains and pore spaces through which water can percolate, and the connectedness and geometry of the pores (more on that in a moment!). That permeability is a characteristic of the sandstone, regardless of whatever fluid might be moving through it, the temperature, or anything else. But the flow rate of water through this sandstone will be different than for oil, or for air, or any other fluid. So the same sandstone also has a hydraulic conductivity specific to a given fluid of interest.

