
Potential Energy and Hydraulic Head
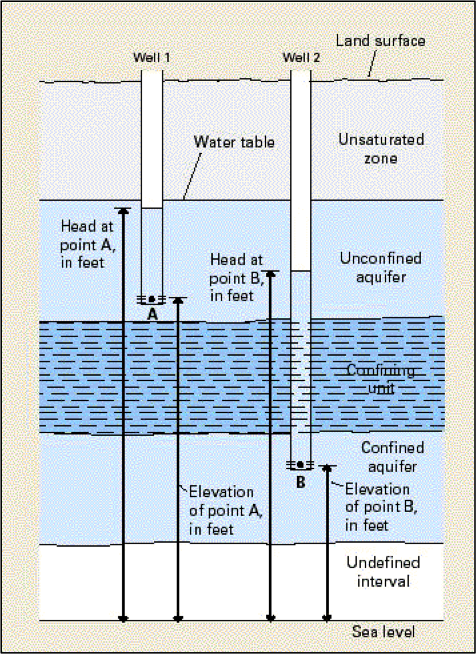
The flow of both surface water and groundwater is driven by differences in potential energy. In the case of surface water, flow occurs in response to differences in gravitational potential energy caused by elevation differences. In other words, water flows downhill, from high potential energy to low potential energy. In groundwater systems, things are a bit more interesting. Unlike surface water, which is in contact with the atmosphere and therefore rarely under pressure, water in groundwater systems is isolated from the land surface. This means that groundwater can also have potential energy associated with pressure. In extreme cases, water in confined aquifers may be under sufficient pressure to drive flow upward, against gravity. Artesian wells are one manifestation of this.
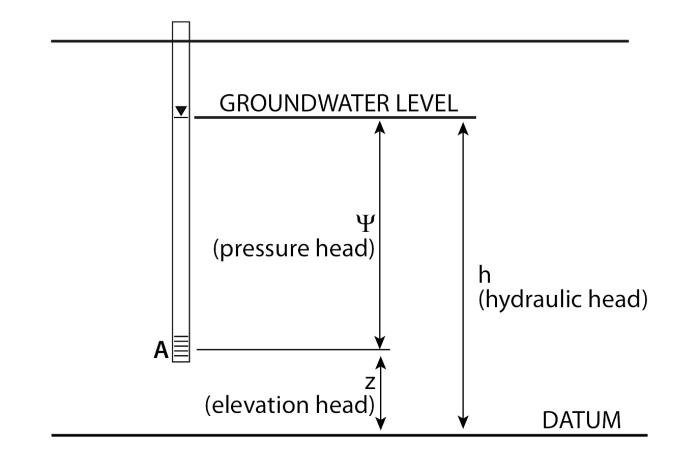
Fundamentally, groundwater and surface water are similar in that flow is in the “downhill” direction. But what does “downhill” mean in a groundwater system? To define the flow direction, we need to account for the two types of potential energy. Unfortunately, the potential energy of the water cannot be measured directly. However, we can measure a proxy for the potential energy by measuring the hydraulic head, or level to which water rises in a well (Figures 26 and 27). The hydraulic head combines two components: (1) potential energy contained by the water by virtue of its elevation above a reference datum, typically mean sea level; and (2) additional energy contributed by pressure. In a well, the value of hydraulic head represents the potential energy of the water at a particular point in three dimensions – at the depth where the well is open to the aquifer (Figures 26-27). This is analogous to a temperature reading taken at the tip of a thermometer, which provides a proxy for heat energy. Hydraulic head can be written as:
h = z + Ψ,
where z is the elevation energy, and Ψ is the pressure energy.
Click to expand to provide more information