Overdraft
Groundwater overdraft is a specific condition in which extraction greatly exceeds the influxes of water (mainly recharge). This produces an unsustainable condition characterized by sustained declining water levels. Much like overdraft of a bank account, groundwater overdraft is not a desirable state of affairs. Not only is it unsustainable in terms of management of the groundwater resource, but it also leads to long-lasting damages (a lot like what happens to your credit rating if your bank account is overdrafted!).
Depressurization of the aquifer, if large enough, may cause irreversible collapse and compaction. This reduces both storage (porosity) .and hydraulic conductivity. It can also lead to land subsidence, especially in cases where the magnitude of overdraft is large and the aquifer units are thick and highly compressible, as is common for unconsolidated or uncemented sedimentary aquifers. One well-known example of groundwater overdraft is the Central Valley of California (Figure 41). Another is the Ogallala aquifer, a major groundwater system spanning across eight states in the American Midwest (Figure 43; see The High Plains Aquifer section). Substantial overdraft and subsidence also occur in widespread areas of the southeastern U.S., the Gulf Coast, and parts of Arizona and Las Vegas (Figure 44).
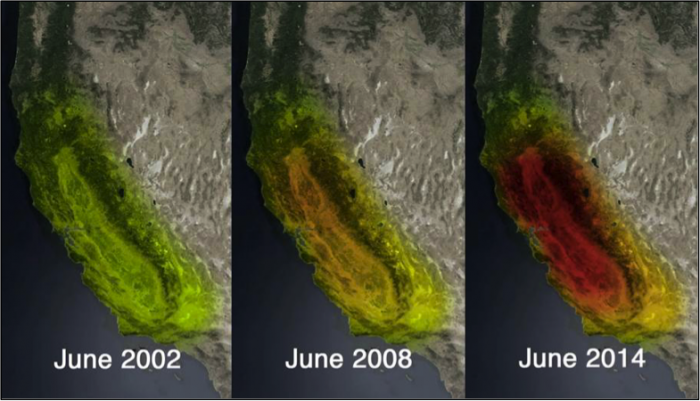
Figure 41. (Top) image showing satellite-based observations of changes in the Earth’s gravitational field that reflect a reduction in water storage in California, from June 2002 to June 2008, to June 2014. Colors progressing from green to red indicate increasing water loss. Most of the reduction is focused in the Central Valley, due to increased groundwater extraction for agricultural use. Over the period from 2011-2014, the change in water storage in the Central Valley equates to a loss of about 4 trillion gallons, or 12 million acre-feet of water each year – almost the entire flow of the Colorado River.
Source: NASA/JPL-Caltech/University of California, Irvine
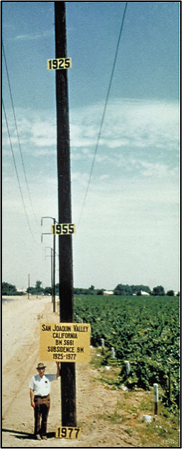
Figure 42. Photo from the region of maximum land subsidence in the Central Valley. The utility pole is marked to show the elevation of the land surface in 1925, 1955, and 1975. The total subsidence at this location exceeds 9 m.
Source: Image on bottom from USGS Multimedia Gallery
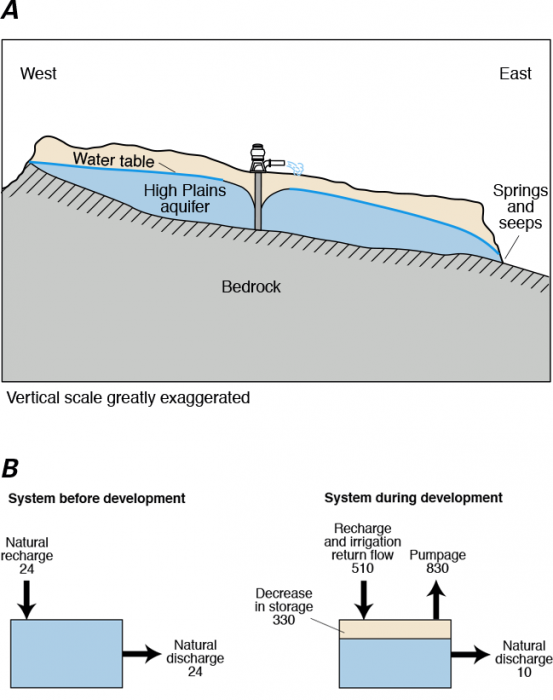
Figure 43. Diagram summarizing the water budget of the southern High Plains aquifer (of which the Ogallala is a major part). Pre-development influxes and outflows were balanced. Development of the central part of the aquifer, primarily for irrigation, has slightly reduced natural seeps and springs along its eastern edge (A). Total withdrawals grossly exceed natural recharge (by about 35 times); a large fraction re-infiltrates as irrigation return flow, but the deficit is over ten times the recharge (B). All units are million cubic feet per day.
Source: U.S. Geological Survey Circular 1186
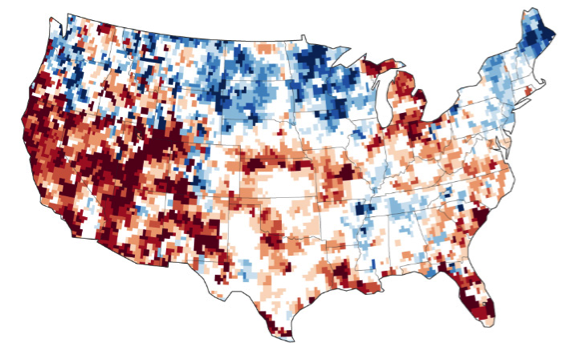
Figure 44. (Top) Areas of land subsidence in the U.S. associated with groundwater overdraft (from USGS Fact Sheet-165-00). (Bottom) Satellite-based estimates of groundwater stored in the subsurface on July 7, 2014, relative to the average from 1948 to 2009. Blue regions have more groundwater for this time of year than the average for this time of year, whereas red areas have less than the average. Note the correlation between areas of groundwater deficit and land subsidence.