Pricing Water
Pricing Water

Does water have value? If so, how do we set a price for it? And, if we agree that individual access to fresh water is a basic human right or expectation globally (is this generally agreed?), how do we treat water as a commodity? Do we really pay what water is worth?
Pricing Varies
Pricing Varies
You are likely all too familiar with bottled water—that convenient liter-sized plastic bottle containing some sort of water, commonly tap water, or filtered spring water, sometimes treated…it appears that, in the U.S., we pay for the convenience of "grab-and-go." For that convenience, we typically pay about $4/gallon, more than we presently pay for a gallon of gasoline! In most municipalities; however, the cost of water delivered in pipes to taps in homes costs far less ($0.003-0.006/gallon). A survey by CircleofBlue.org for 2014 water pricing in 30 cities across the U.S. found an average increase of 6.2% in monthly bills for a family of four using an average of 100 gals/day each (12,000 gals/mo or 45.4 m3/mo) from 2013 to 2014.
Monthly rates for some representative municipalities are shown in the table below, based on data in the CircleofBlue.org survey and information from water authority websites for some municipalities not covered in that survey (Pittsburgh, PA and State College, PA). Note the large range in rates that do not seem to make sense geographically. For example, arid Phoenix, AZ has the lowest rate, with Las Vegas, NV not far behind, whereas high precipitation, seemingly water-rich regions such as Seattle, WA and Atlanta, GA top the rate list. Note that Los Angeles, CA, Phoenix, AZ, and Las Vegas, NV all depend on Colorado River water, although Los Angeles also draws on northern California sources and all require significant transport infrastructure. So, in part, this disparity in rates results from the costs of maintaining infrastructure and the numbers of households served, as well as the local abundance of water.
| Municipality (city, state) | Monthly rate (12,000 gals) | Percentage change (2014-2013) |
|---|---|---|
| Phoenix, AZ | $38.75 | 0 |
| Chicago, IL | $39.72 | +14.9 |
| Las Vegas, NV | $42.27 | +2.8 |
| State College, PA | $47.40 | 0 |
| New York, NY | $57.28 | +5.6 |
| Philadelphia, PA | $65.88 | +5.0 |
| Los Angeles, CA | $75.98 | +14.5 |
| Atlanta, GA | $91.92 | 0 |
| Seattle, WA | $98.77 | +9.3 |
| Pittsburgh, PA | $100.81 | ? |
Chicago, IL, for example, has nearby Lake Michigan as a source and a large number of users and its rates are relatively low. Little State College, PA has a significant, sustainable groundwater resource (see Module 6), even though the user base is relatively small. Many municipalities have higher rates because they are financing necessary improvements in infrastructure, which can be quite costly.
Municipalities have adopted different methods for scaling water prices. Some, such as Philadelphia and Detroit, provide cost reductions for larger users (decreasing block), some, including New York, have uniform pricing, whereas others, such as Las Vegas and Atlanta, have implemented tiered pricing (block increases) that encourage conservation while trying to maintain the user base. The objective of all municipalities is to sustain income and provide for future infrastructure requirements.
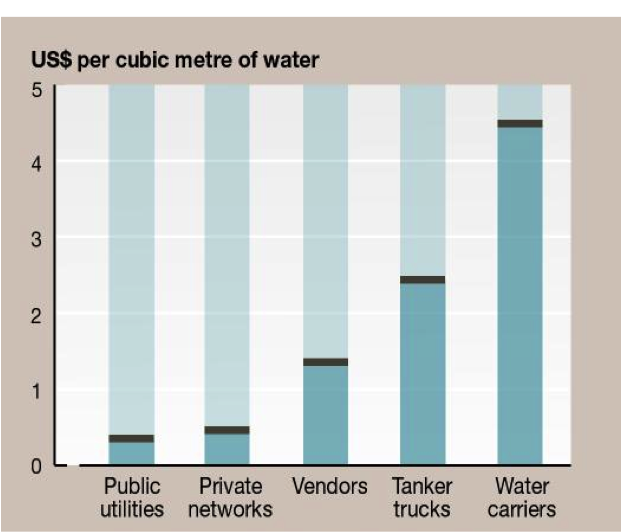
Internationally, pricing varies even more than in the U.S. Figure 22 illustrates average water prices (Kariuki and Schwartz, 2005) and the impact of non-public water suppliers on the cost to the consumer. Where public utilities are not available, the cost to the consumer can be a factor of 10 higher. In part, this occurs because of increases in cost to the water supplier to purchase water from a public or private supplier because of the large volumes purchased with prevailing block pricing increases. Figure 23 shows the step increases for several African and Indian cities. Recall that the average family of four in the U.S. would use about 45 m3/month, but average usage is probably much lower in many developing nations with lower standards of living. Step increases in block pricing appear to be a fair method of pricing to allow low cost for low-volume users and encouraging conservation by imposing higher costs for larger-volume users.
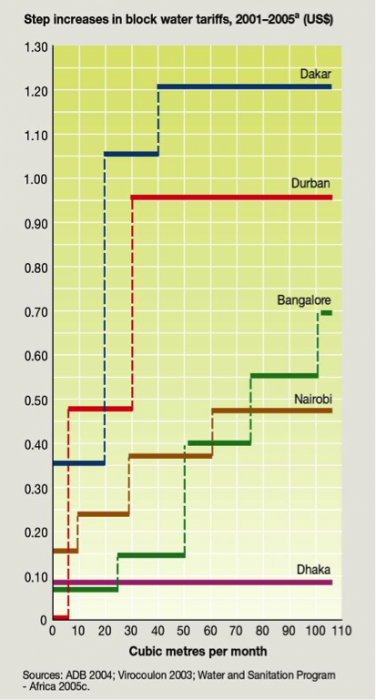
Click the link to expand for a text description of Figure 23
The Water and Energy Nexus
The Water and Energy Nexus
Considerations of water pricing are complicated because of the multitude of factors that must be taken into account. These include availability and dependability of water supply locally, state of the distribution infrastructure, and the distribution and size of the user base. Dependability is related to climate impacts, such as prolonged droughts that deplete water reserves. A recent study ( [2]Watergy Nexus: The Complex Relationship and Looming Crisis Between Our Thirst For Water and Our Hunger for Energy [2]) highlights an additional factor—the amount and cost of energy to acquire, transport, and treat water. This study argues that the cost of energy (usually electricity, but including fuel if the water is trucked in) must be considered in pricing water. The study uses data for 2013, a year of severe drought in much of the western and central U.S. to show how water prices should be adjusted to guarantee supply and cover costs of acquisition. Although the U.S. Geological Survey indicates that the average energy required to provide 1000 gallons (1 kgal) of water is 1.9kWh of electricity, water-stressed regions such as northern California (3.5 kWh/kgal) and highly stressed southern California (11.1 kWh/kgal) require far more (Figure 24). However, the study suggests that municipalities are not taking this factor into consideration in providing a durable and resilient water supply. During times of water stress, municipalities may have trouble meeting costs, and begin to examine other strategies, such as privatization. Of course, when water availability becomes restricted, costs can go up as in California with severe drought conditions (e.g., see the news article In dry California, water fetching record prices [3] about California water pricing: ).
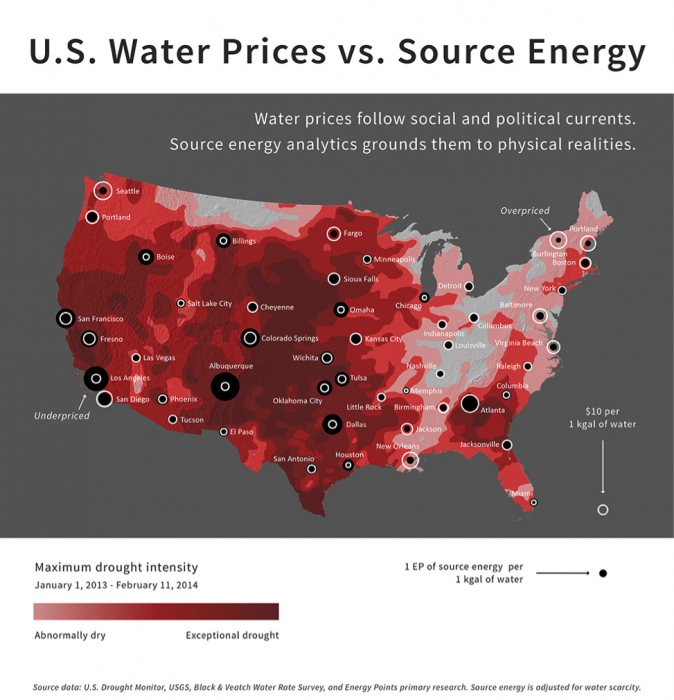
Click for a text description
Learning Checkpoint
1. What factors drive water pricing?
ANSWER: Factors that must be considered include: the availability and dependability of water supply locally, state of the distribution infrastructure and potential costs needed to improve or maintain it, cost of delivery – including energy, distribution, and size of the user base, and demand.
Privatization
Privatization
Cash-strapped municipalities with failing water systems might be tempted to contract with private companies to manage their water and sewer systems. Economic drivers, such as the collapse that occurred in 2008, affect users ability to pay for public water systems. In the U.S., about 20% of water supplies are privatized at present. In evaluating this option, one must keep in mind that corporations are for-profit entities, and will need to recoup the full costs of providing water while adding a margin for profit to benefit the corporation and/or their stockholders. Public utilities can be held responsible for controlling costs and providing clean water supplies, whereas it is more difficult for the public to do so for private companies.
There are a number of examples where privatization has apparently failed consumers. Pushed by the costs of renovating their failing water supply infrastructure, Atlanta, GA, for example, handed over control of their water system to United Water, which took over in 1999, with a 20-year contract. Atlanta had long-deferred most maintenance because their revenue was insufficient to cover the full cost of providing service, and because of rapid population growth and their aging system, expansion and improvement were required. Their sewage system was more of a problem than the water supply system, and they were being sued under the U.S. Clean Water Act for that problem as well.
But, in 2003, the city of Atlanta withdrew from the agreement because a number of issues with United Water (see What Can We Learn From Atlanta's Water Privatization [4] for the full story), which included costs, viewed as excessive, and poor performance in maintenance, meter installation, and bill collection.
The situation in Detroit has been much in the news of late (for example – see this MSNBC article, Detroit residents and national allies protest water shutoffs [5]). As a result of the economic downturn, the Detroit Water and Sewer Department has recently gone on a campaign to force users to pay their outstanding water bills with the threat of cutoffs. In addition, the city of Detroit is pursuing the possibility of privatizing its water and sewer systems. Although clearly having its own perspective and position, an interesting argument against water privatization in Detroit [6] is found on The Blue Planet Project website. One common argument against privatization is the rapid increase in the costs of water to consumers. Of course, in many cases, this may occur because the public purveyor was not charging for the full cost of providing the water in the first place.