Module 7: What is in Your Water?
Module 7: What is in Your Water?
Overview
Water is the "Universal Solvent." Virtually every element on the periodic table and many organic substances (molecules) are soluble (can be dissolved) to some degree in water. Many substances occur "naturally" in water—that is they are dissolved into water as it flows over rock surfaces or through aquifers in the subsurface or as it mixes with other waters. Some substances are "pollutants," having been added as the result of certain human activities, intentionally or unintentionally, including wastewater (untreated) disposal, drainage of acidic waters from abandoned mines, drainage from agricultural operations (e.g. manure, herbicides, pesticides), etc. "Water quality" implies an assessment of the degree of contamination of a water source by direct measurement of its dissolved components. Not all dissolved components in water are harmful to human health, but this depends, in part, on their concentration. In this module, we will explore some of the science and issues with respect to drinking water quality, a bit about the chemistry of natural waters, and the regulations that help ensure a satisfactory drinking water supply for the U.S. populace. In addition, we will outline some water quality issues that affect other parts of the globe.
Goals and Objectives
Goals and Objectives
Goals
- Describe the two-way relationship between water resources and human society
- Explain the distribution and dynamics of water at the surface and in the subsurface of the Earth
- Synthesize data and information from multiple reliable sources
- Interpret graphical representations of scientific data
- Identify strategies and best practices to decrease water stress and increase water quality
- Thoughtfully evaluate information and policy statements regarding water resources
- Communicate scientific information in terms that can be understood by the general public
Learning Objectives
In completing this module, you will:
- Calculate the concentration of contaminant in a reservoir
- Apply government drinking water regulatory standards to identify contaminant levels that might be harmful to human health
- Analyze concentration vs. time data for various dissolved components of river water and ground water
- Infer the processes responsible for seasonal trends in compounds of natural and human origin
- Propose and evaluate methods for mitigating human impacts on water quality
- Evaluate the tradeoff between agricultural productivity and water quality as a result of fertilizer usage and runoff
Units of Water Chemistry
Units of Water Chemistry
Elements and molecules have solubilities (the amount that can be dissolved in water before the water is saturated with that element and no more can be held in solution) that depend on their individual properties and styles of bonding to other elements. For example, common table salt (NaCl), when added to water, will dissociate into individual charged ions of Na+ and Cl-. These are held apart from one another "in solution" because they are surrounded and isolated by polar water molecules (Unique Properties of Water section).
Distilled water or "pure" water typically has near-zero concentrations of other components. If concentrations of dissolved elements or compounds are present, they are usually expressed in terms of mass (weight) of the component/unit volume of water, mass element/mass water, or moles element/mass or volume of water.
Typically, the volume of water referenced is a liter (1000 grams--1 kg by mass), and the elemental or component mass is in grams (or milligrams, mg). Milligrams/Liter (mg/L; 0.001g/1000g) or milligrams/kg (mg/kg) is the same as parts per million (ppm) as concentration. You will often see a concentration of a dissolved species in water expressed in either mg/L or ppm.
Molar concentrations, commonly used by chemists, are expressed as a decimal fraction of the mass of Avogadro's Number (a mole) of atoms (6.022 x 10²³) of a given element or elements in a compound, equivalent to atomic or molecular mass. For example, a mole of carbon (12C) has a mass of 12 grams, and a mole of carbon dioxide (CO2) has a mass of 44 grams (12C, 16O, 16O). So, if a liter water sample contains 0.044g of carbon dioxide (44 ppm), the carbon dioxide concentration would be 0.01 mole/kg.
Total dissolved solid concentrations (TDS; concentrations of all dissolved inorganic species) for water samples can be fairly accurately measured by
Learning Checkpoint
1. The Na concentration in a water sample is 10 ppm. What is the concentration expressed in g/kg?
Click for answer.
2. The mass of a mole of sodium (Na) is about 23 g. A water sample has a dissolved sodium concentration of 0.046 g/kg. What is the Na concentration expressed as moles/L?
Click for answer.
3. Read this article about a contaminated water supply [1]. After mixing in with the 38 million gallons of fresh water already in the reservoir, how many parts per million “contaminant” are there (in other words, what is the proportion of the contaminated water to the total volume)? Assume that the input of “contaminant” is 8 oz.
Click for answer.
Drinking Water Regulation
Drinking Water Regulation
Who Regulates Drinking Water Quality in the U.S.?
Public drinking water quality is regulated by the U.S. Environmental Protection Agency (EPA) by provisions of the Safe Drinking Water Act (SDWA), although individual states can apply and enforce their own standards if more stringent than those set by the EPA. The SDWA was originally passed by the U.S. Congress in 1974, and has been amended twice (1986, 1996) and now provides standards for drinking-water sources, treatment, and quality at the tap, as well as the disposal of wastewater underground. Private wells pumping groundwater that serve fewer than 25 people are not regulated. They should be tested regularly, however.
It is estimated that there are over 160,000 public drinking-water systems that fall under the aegis of the EPA standards. These standards are health-based and attempt to establish maximum levels (MCL—Maximum Contaminant Level) for possible contaminants that are below those that are thought to cause health problems (you can see specific contaminants and MCLs at EPA: Drinking Water Contaminants - Standards and Regulations [2]). Of course, there are many contaminants for which there are insufficient data to establish stringent limits.
Over the past decade, bottled water, usually sealed in "plastic" containers has become quite popular worldwide. In the U.S., over 10.1 billion gallons of bottled water were sold in 2013, (according to the International Bottled Water Association [3]), revenues were more than $40 billion, assuming an average price of $1 per liter. Although convenience is certainly a factor, the perception has been that such water must be safe to drink—perhaps more safe than tap water—also drives bottled water sales. In the U.S., bottled water is actually regulated by the U.S. Food and Drug Administration (FDA), not the EPA. The FDA regulates bottled water as a food (requiring compliance with the Federal Food, Drug and Cosmetic Act) and does not require certified lab testing or violation reporting, even though the FDA does inspect bottling plants and ensures that suitable source waters are used. The FDA also has generally adopted limits for contaminants established by the EPA. Nonetheless, the FDA does not require bottled water companies to disclose to consumers the source of the water, treatment processes, or contaminants it contains, whereas the EPA requires public water systems to report results of their testing annually.
Activate Your Learning!
Public water systems are required to analyze their water monthly for a number of possible contaminants and to meet standards set by the EPA. Download the most recent (4-page pdf) Report of the State College Borough Water Authority [4].
Read and then answer the question in the space provided. Click the "Click for answer" button to reveal the correct answer.
Questions
1. What is the difference between an AL (Action Level), MCL (Maximum Contaminant Level), and an MCLG (Maximum Contaminant Goal)?
Click for answer.
Maximum Contaminant Level (MCL) – The highest level of a contaminant that is allowed in drinking water. The MCL is enforceable by public health agencies.
Maximum Contaminant Level Goal (MCLG) – A level of a contaminant in drinking water that is thought to be a risk to human health, but not a certainty. Usually, MCLGs are not enforced by public health agencies.
Action Level (LA) – a level of exposure considered hazardous in water, or exposure to a harmful substance that requires remediation.
2. Were any dissolved constituents near the MCL? If so, which ones? What is the most likely source of contaminants for the State College water source?
Click for answer.
3. Look up the drinking water report for your hometown. Answer question 2 for your hometown. If you grew up in a rural community and used well water, was your water analyzed or treated? How?
Click for answer.
4. Do a bit of research online and briefly outline at least one significant difference between EPA drinking water regulations and FDA bottled water regulations (one not already outlined above).
Click for answer.
The Chemistry of Natural Waters
The Chemistry of Natural Waters
Natural waters have a broad range of total dissolved solids (TDS). Some fresh mountain streams might have TDS concentrations less than 250mg/kg. Seawater, on average, has TDS concentrations of nearly 35g/kg. Extreme TDS values are found in highly evaporated lake or isolated seawater basins and in the deep subsurface (so-called "formation waters"), with TDS of nearly 350g/kg (35% salt solution!). We will focus here briefly on the compositions of potential drinking water sources (rivers and lakes) and the origins of the dissolved species.
Flowing water, whether in aquifers or streams, interacts with rocks and soils and slowly dissolves some of their chemical constituents. The pH (hydrogen ion activity) of the water determines the rate of dissolution and solubility of many chemical species. However, we will not discuss chemical processes in any detail here. Some chemical substances, particularly redox-sensitive trace metals (e.g. Fe, Mn, Pb, As and others), are more soluble when natural waters are depleted in dissolved oxygen (see the section called Contaminant Example 2 below). Most chemical species in natural waters have both natural and pollutant sources of many types (Table 1).
| Ion (molecule) | Natural Source | Pollutant Source |
|---|---|---|
| Sodium (Na+) | 1, 2 | 8 |
| Magnesium (Mg+) | 1, 2 | 8 |
| Potassium (K+) | 1, 2, 3 | 8, 14 |
| Calcium (Ca+) | 1, 2 | 8, 9, 10 |
| Hydrogen (H+) | 13 | 10 |
| Chloride (Cl-) | 1 | 15 |
| Sulfate (SO42-) | 1, 2, 5, 6 | 8, 10 |
| Nitrate (NO32-) | 4, 5 | 8, 10, 11, 14 |
| Ammonium (NH4+) | 5 | 14, 5 |
| Phosphate (PO43-) | 2, 3, 5 | 8, 14 |
| Bicarbonate (HCO3-) | 7 | 7 (5, 8, 9, 10, 11, 12) |
| SiO2, Al, Fe | 2 | 12 |
Key for Table Above
- wind-blown sea salt
- soil dust
- biogenic aerosols
- lightning and N2 in atmosphere
- biological decay
- volcanic activity
- carbon dioxide in air
- biomass burning
- cement manufacture
- fuel combustion
- automobile emissions
- land clearing
- gas reactions
- fertilizers
- industrial chemicals
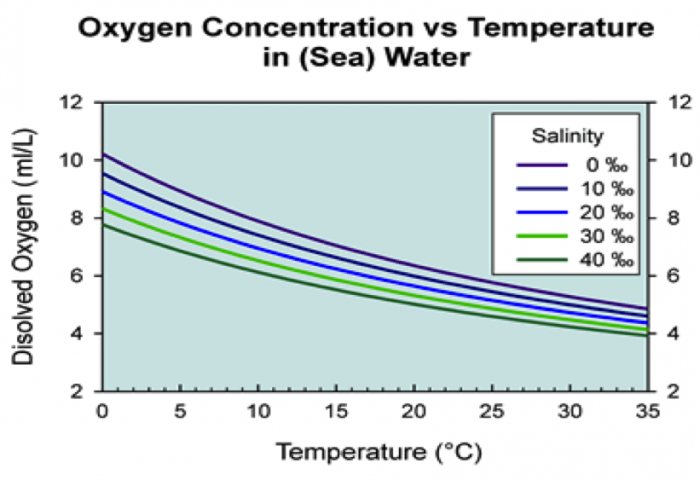
Natural waters also contained dissolved gasses. For example, carbon dioxide from the atmosphere is dissolved in water, and, through a series of chemical reactions, contributes to the total dissolved carbon in waters—primarily bicarbonate (HCO32-). Gas solubility is inversely proportional to temperature and TDS. For example, dissolved oxygen solubility is shown as a function of temperature and salinity in Figure 1. Note that the amount of oxygen that can be held in fresh water decreases nearly 50% from near freezing temperature to 35°C. These are maximum concentrations, but natural waters can have lower dissolved oxygen concentrations as the result of biological activity such as the metabolism of water inhabitants, including bacteria. Photosynthesis of algae and aqueous plants can add oxygen to the water in which these primary producers grow. However, the breakdown of organic material by bacteria consumes dissolved oxygen. Thus, in waters below the surface wind-mixed layer (usually tens of meters or more) or in stably stratified lakes or bays, for which rates of oxygen replenishment to deeper depths are slow, deficiencies in dissolved oxygen can develop, with anoxia (total depletion of dissolved oxygen) at the extreme. Excess nutrient supply can have the same impact on a water body (eutrophication: see Module 1 and Contaminant Example 2: "Dead Zones" and Excess Nutrient Runoff) with deleterious effects on the aquatic biota.
Activate Your Learning
Go to: the USGS Water Quality Watch website [5] and examine the various maps showing aspects of surface water quality for U.S. monitoring stations (Temperature, conductivity (salinity in ppm), pH, dissolved oxygen (D.O.), turbidity, nitrate (ppm), discharge).
Once you are ready, answer the questions in the spaces provided below. Click the "Click for answer" button to check your answer.
Questions
1. Animate the map for dissolved oxygen in surface waters for the past year (a clickable link). Watch the eastern half of the U.S. carefully and describe the trends in DO that you observe. Why does DO in this region vary the way it does (e.g., what is the main control and how does it work?).
Click for answer.
2a. Click on the map for nitrate. Notice that there are many fewer stations with such data because it is more difficult to routinely measure nitrate concentrations. The available stations are probably mostly monitored because the waterways are in some way impaired.
What are the states (three) with the highest nitrate concentrations? Speculate as to the possible causes(s) of high nitrate in waterways in these states.
Click for answer.
2b.Click on the State of Iowa. Then click on one of the monitoring stations (try Boone River near Webster, IA. What is the current nitrate concentration? Is this above or below drinking water standards? Click on "nitrate graph." How has nitrate varied over the past week? Why would nitrate concentration vary? Suggest a way to back up your answer with available data for that site; does it work?
Click for answer.
3a. Click on the map for specific conductance (μS/cm or microSiemens/cm, a measurement of TDS concentration if properly calibrated: use 1000 μS/cm = 640 ppm as TDS, and the scaling is roughly linear, e.g., 103 μS/cm = 6.4 x10³ ppm TDS).
Where are surface waters with the highest specific conductance? Why are they high? What is the approximate TDS value for the highest stations (above what value?).
Click for answer.
3b. Why are there a number of streams in the continental interior that have values above 2400 μS/cm? What is this minimum value in TDS? Check out North Dakota, for example. Does a stream with above 2400 μS/cm specific conductance meet drinking water standards? If not, where do you think the drinking water in that area comes from?
Click for answer.
3c. Many of the streams that have relatively high specific conductance observed in question 3b, vary over the year (animate the map and revise your answer to 3b if you see a pattern). However, the specific conductance of the Pecos River in Texas does not vary much (it stands out in southwest Texas) and is quite high. Provide possible reasons why (hint: think about types of rocks that might be in its drainage)?
Click for answer.
Contaminant Example 1: Arsenic in Groundwater
Contaminant Example 1: Arsenic in Groundwater
There are, of course, many possible contaminants in drinking water supplies—in part natural, but also induced by human activities. There are three main groups of contaminants with relation to anticipated health effects:
- Some contaminants produce no health effects until a threshold concentration is exceeded. Nitrate (NO3) is an example of this; OK at 50 mg/liter (50 ppm), but at higher levels, it produces methemoglobinemia (e.g., "blue baby" syndrome).
- The second group of contaminants has no apparent threshold for health effects. These include genotoxic substances. These include some natural and synthetic organic compounds, micro-organic compounds, some pesticides, and arsenic (see below) for example.
- A third group consists of elements essential to the human diet: fluoride, iodine, and selenium are good examples—their absence in the diet causes problems, but an excess of intake can create problems.
Arsenic is a good example of both natural and human-induced contamination, and it is important as well because of its toxicity at higher concentrations (as are lead and fluoride). In recognition of the potential toxicity of arsenic (As), the US EPA lowered the MCL in drinking water from 50 ppb to 10 ppb in 2001. For example, check out this short video on possible health effects of arsenic and the need to have private wells tested.
Video: In Small Doses: Arsenic (10:01)
The health effects of arsenic.
Click for a transcript of In Small Doses: Arsenic.
RICHARD WILSON: Arsenic has been known to be acutely toxic for millennia. If you take it at 700 parts per million in the water, then it will certainly kill you moderately quickly. But what was not known until fairly recently is continuous use in fairly low doses can be very bad. And that means continuously daily ingestion.
Arsenic is a very common element in the Earth's crust. It's number 20 or something like that. And the question is, how do you get it inside? And it's coming mostly through water.
BEN BOSTICK: The reason that's important, for example, in New England is maybe one-quarter of all the peoples' wells in New England have levels of arsenic that we might think of as not being safe.
JANE DOWNING: We have estimated that about 2.3 million people in New England use private wells as their source of drinking water. And in some states like Maine and New Hampshire, that's about 40% of the population.
BERNIE LUCEY: New Hampshire law does not require water testing at private homes, nor quantity requirements at private wells.
ANGELINE ANDREW: Low-dose arsenic exposure has been associated with skin cancer, bladder cancer, particularly in smokers, and possibly lung cancer.
JANE DOWNING: That's why it's particularly important for private homeowners with wells to test their wells periodically and to take action to protect their family. In 2001, EPA revised their drinking water standard for arsenic to 10 parts per billion. And that was done after many months and years of extensive testing and research.
JOSHUA HAMILTON: The drinking water standard in the United States for the levels that we used to think were safe was 50 parts per billion, which sounds like a really tiny number, and it is. It's 50 micrograms, which is a millionth of a gram for every liter of water. So it's a really, really tiny amount. And yet, we now know from epidemiology studies that that level is not safe. That if you drink that level for a lifetime, your disease risk is pretty substantial.
COURTNEY KOZUL: With the previous arsenic drinking water standard of 50 parts per billion, it was thought that the cancer risk was as high as 1 in 100, meaning 1 in 100 people drinking arsenic at 50 parts per billion would develop cancer.
BERNIE LUCEY: Normally for man-made contaminants, the acceptable risk rate for pesticides, herbicides, fuels, industrial solvents is one in a million.
JOSHUA HAMILTON: We now have laboratory studies and some emerging epidemiology studies that suggest 10 is not safe either. That we're seeing health effects at as low as 10 parts per billion.
COURTNEY KOZUL: So we're really interested in looking at these low levels and what's happening, so sort of asking the question of, how low is low enough for an appropriate drinking water standard?
JOE AYOTTE: Overwhelmingly, the evidence that we have suggests that the arsenic we see in groundwater originates from natural sources in the minerals in the rocks of the region. Apparently, there's two main factors that control whether arsenic ends up in your groundwater.
And that's having some arsenic in the rocks as a source, but also having the right geochemical conditions. And in New Hampshire, that equates to having water that's relatively high pH and water with relatively little dissolved oxygen. Those two factors together result in higher arsenic concentrations in water.
PRESENTER: In the world today, in Asia alone, about 100 to 120 million people suffer from arsenic-related illnesses.
PRESENTER: How arsenic causes disease is the big $64,000 question. Nobody really knows the answer to this. What we do know is that arsenic doesn't behave like any other chemical that we know.
COURTNEY KOZUL: My research focuses on the effects of low-dose arsenic exposure on the immune system, particularly the immune system within the lung. What we've done is developed a mouse model in which we exposed mice to arsenic in their drinking water at 100 parts per billion for five weeks.
100 parts per billion is not an uncommon level of arsenic to find in areas of New England, such as New Hampshire and Maine. Following that exposure, we infected the mice with a sub-lethal dose of influenza A, an H1N1 strain of flu.
And what we found was that the mice exposed to arsenic had an increased susceptibility to infection, and they also had an increased severity of infection, resulting in a severe morbidity observed in those arsenic-exposed mice.
In theory, there would be a dose threshold in which we would expect no effects for arsenic exposure. The problem is that we don't really understand what that dose would be. We've certainly seen effects following arsenic exposure at 10 ppb or even lower.
JOSHUA HAMILTON: In my laboratory, we've seen effects on endocrine disruption and some other endpoints that we measure at below one part per billion. So now, we're talking about parts per trillion, which is a hard number to even think about.
COURTNEY KOZUL: The question remains as to whether or not these effects are biological effects or toxicological effects, meaning, do they have an adverse outcome on human health or not?
BERNIE LUCEY: And so the issue is one to educate the homeowner on, in terms of the importance of having a comprehensive water quality test.
SHARI YOUNG: I go to the state. I get a little decanter free. And the test costs $10 to $15.
BRIAN JACKSON: The liquid is sprayed into the instruments, and it goes into the inductively coupled plasma, which is a hot ionized gas. It's 7000 degrees, which is hotter than the surface of the sun. So the sample, basically, is desolvated. You lose all the water.
And the molecules are broken up into the chemical elements. And those elements are extracted into the mass spectrometer. And then the mass spectrometer basically counts the atoms of any particular element. So we determine the element by its unique mass. And we count the number of atoms in that sample, and that's how they determine concentration.
SHARI YOUNG: It takes maybe two weeks to get the results back. It's a pretty easy process-- in and out. There are various ways to remediate arsenic, and they're pretty inexpensive for a household like ours.
PRESENTER: There are two different sizes of water treatment devices. One is called whole house and would deal with approximately 200 gallons of water each day. The other is called point of use and would only deal with the water that one would consume each day.
COURTNEY KOZUL: It's not thought that dermal exposures, such as you would get in the shower, is such an immediate concern when compared to ingestion through the drinking water.
SHARI YOUNG: We actually got ours at Sears and had a plumber come and put it in underneath the sink. So I think you can put them in yourself, though.
JOE AYOTTE: At the USGS in New Hampshire, our primary responsibility is to provide impartial science information on the nation's water resources. We know from our studies that certain parts of the state have 30% of wells where we see arsenic concentrations exceeding 10. By zooming in and looking more closely at specific geology, we see some places where every other well has arsenic greater than 10.
BEN BOSTICK: If arsenic is in a city water supply, the city takes care of it, generally, and at least tells you if there's a problem. If you have your own water in your own well, the city doesn't have to do that. So, in fact, it's your own responsibility to take care and figure out what that arsenic concentration is.
JOSHUA HAMILTON: So, really, the bottom line is that everybody has to test their well. There's no predictive power. It doesn't matter whether your neighbor does or doesn't have arsenic. Each well is individual and has to be tested individually.
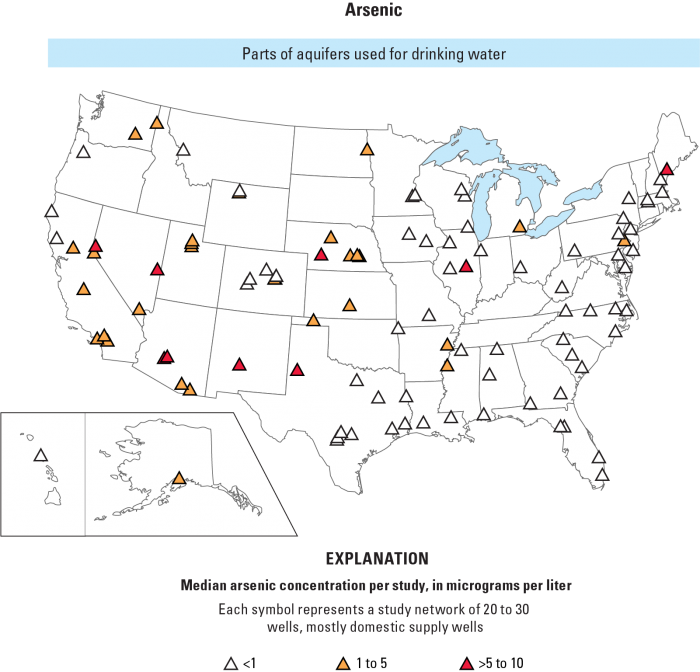
In the western US, groundwater As levels are particularly high (see Fig. 2) because of the types of bedrock the groundwater moves through. The high concentrations in Maine are due to more alkaline (high pH), low dissolved oxygen groundwater that leads to high solubility of arsenic in shallow aquifers of glacial origin. Contamination of aquifers can also occur from agricultural runoff, runoff from arsenic-bearing wood preservatives, improper disposal of chemicals containing As, and/or mining activities. See this article in The New York Times, The Arsenic in Our Drinking Water [6], for a summary of possible health effects in the U.S. and Bangladesh.
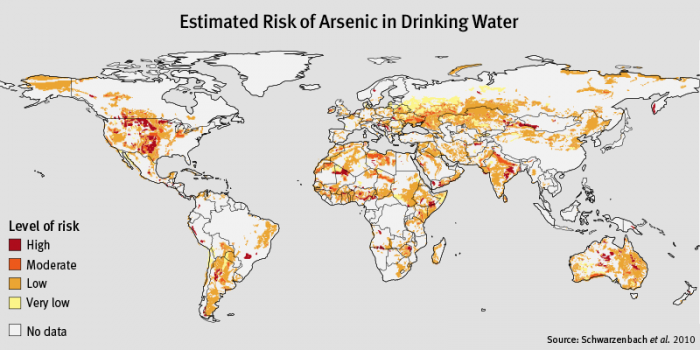
Global maps of the probability of arsenic concentrations in groundwater greater than 10 ppb can be viewed at Global fluoride and arsenic contamination of water mapped [8] and is based on research by M Amini et al (Environ. Sci. Technol., 2008, DOI:10.1021/es702859e. A more generalized map of risk for As in drinking water can be seen in Figure 3.
Serious Arsenic Problem in Groundwater: Bangladesh
Serious Arsenic Problem in Groundwater: Bangladesh
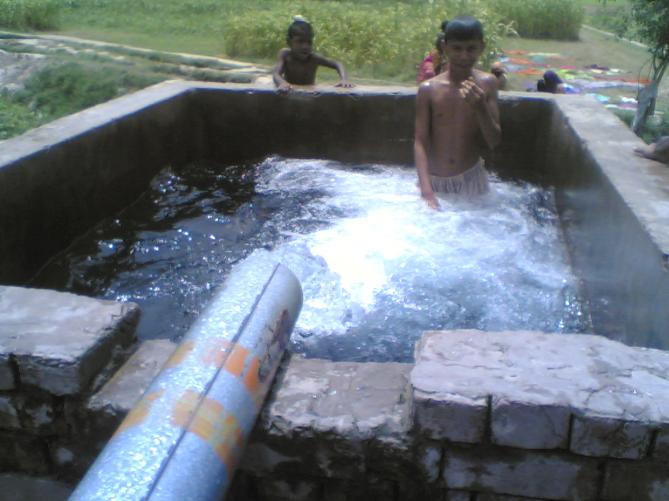
An example of a very serious arsenic problem in groundwater is that of Bangladesh. The issue there is related to high rates of groundwater extraction through shallow wells in conjunction with shallow groundwater pollution that caused anoxia at shallow depth (see Fig. 5). The arsenic is associated with the anoxic zone which has been tapped by hundreds of thousands of shallow "tube wells" since the 1980s (Fig. 4), an innovation that saved millions from potential disease, including death by cholera, associated with getting their water from shallow pits. Ultimately, the new deeper water source began poisoning them with arsenic (Bhattacharjee, et al., 2007, Science 315, p.1659) liberated from iron oxides that were "reduced" under anoxic conditions, thereby liberating adsorbed As into dissolved form in the groundwater.
Contaminant Example 2: "Dead Zones" and Excess Nutrient Runoff
Contaminant Example 2: "Dead Zones" and Excess Nutrient Runoff
A major issue in pollution of surface waters is the role that excess nutrient flows from polluted waterways into lakes, bays, and coastal zones play in creating excess biologic production in surface waters and dissolved oxygen at depth. In most cases, this nutrient-rich runoff results from agricultural operations, including the application of fertilizer to crops. Of course, such issues have already been briefly highlighted for the Chesapeake Bay in Module 1, but such so-called "Dead Zones" are globally widespread. It is, perhaps, easier to understand impacts on more restricted bodies of water (lakes, bays) with high fluxes of water from nutrient-laden rivers (such as the Chesapeake Bay setting). But, such issues also plague some coastal zones characterized by high river discharges. For example, the Gulf Coast "dead zone" has been recognized for over a decade and is attributed to high rates of nitrogen (and phosphorus) discharge through the Mississippi River system. Watch the following video from NOAA [11] that provides a dead zone 'forecast' for 2019 and explains in general how dead zones form in the Gulf of Mexico and their impacts on the region.
Video: Happening Now: Dead Zone in the Gulf 2019 (1:59)
Dead Zone 2019 forecast and explanation
Figure 6. Click for a transcript of Happening Now: Dead Zone in the Gulf 2019.
NARRATOR: The numbers are in. The 2019 Gulf of Mexico Hypoxic Zone, or Dead Zone, an area of low oxygen that can kill fish and marine life near the bottom of the sea, measures 6,952 square miles. This is the 8th largest dead zone in the Gulf since mapping of the zone began in 1985! It begins innocently enough. Farmers use fertilizers to increase the output of their crops so that we can have more food on our tables and more food to sell to the rest of the world. But it is this agricultural runoff combined with urban runoff that brings excessive amounts of nutrients into waterways that feed the Mississippi River and starts a chain of events in the Gulf that turns deadly. These nutrients fuel large algal blooms that then sink, decompose, and deplete the water of oxygen. This is hypoxia - when oxygen in the water is so low it can no longer sustain marine life in bottom or near bottom waters - literally a dead zone. When the water reaches this hypoxic state, fish and shrimp leave the area and anything that can't escape like crabs, worms, and clams die. So, the very fertilizers that are helping our crops are disrupting the food chain and devastating our food sources in the ocean when applied in excess. If the amount of fertilizer, sewage, and urban runoff dumping into the Gulf isn't reduced, the dead zone will continue to wreak havoc on the ecosystem and threaten some of the most productive fisheries in the world.
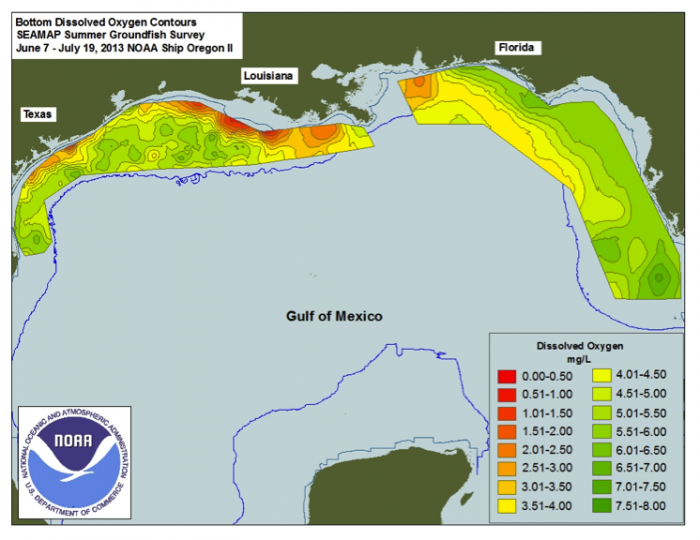
During summer, 2014, this area of hypoxia (less than 2 ppm dissolved oxygen in the water column near the bottom on the shelf) along the Louisiana and Texas coast was just over 13,000 km2 (>5000 mi2), somewhat smaller than that in 2013. Figure 6 illustrates the extent and severity of oxygen deficiencies during mid-summer, 2013. Coastal currents flowing westward mix and transport nutrients flowing from the Atchafalaya and Mississippi Rivers into the ocean.
But how do high nutrient fluxes promote oxygen deficiency in coastal regions? The availability of nutrients in shallow sunlit waters near the coast allows prolific blooms of marine plankton (primary photosynthesis) which produces large amounts of organic matter. Nutrients can be a good thing and can benefit the entire food chain unless the fluxes of N and P reach an extreme termed "eutrophic" conditions. As the organic matter sinks to the bottom, it is a food source for consumer organisms (both in the water column and on the bottom), including bacteria. Shrimp, bivalve, and fish catches can increase to a point. In the extreme, the metabolism of fish, bivalves, bacteria and other critters consumes available dissolved oxygen in the water column faster than it can be replenished by mixing from above or laterally by currents. Also, because the coastal waters are warming during summer, they can hold less dissolved oxygen initially. As long as high nutrient fluxes continue the hypoxia expands and the organisms that depend on oxygen to survive either flee if they can swim, or die if they are more sedentary.
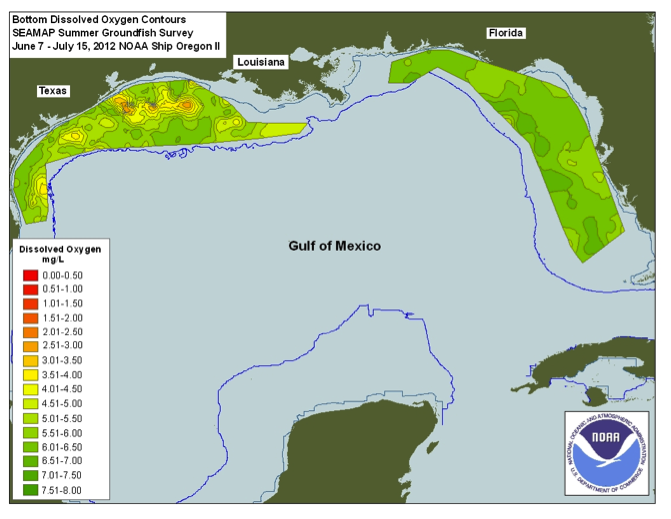
Observations over a number of years indicate that the extent of hypoxia can wax and wane from year to year. In 2012, Louisiana coastal hypoxia was much less extensive and less intense (Fig. 8, contrast with Fig. 7). A severe drought occurred in 2012 in the mid-continent U.S. The flow of the Mississippi River system was much reduced, and nutrient fluxes decreased commensurately.
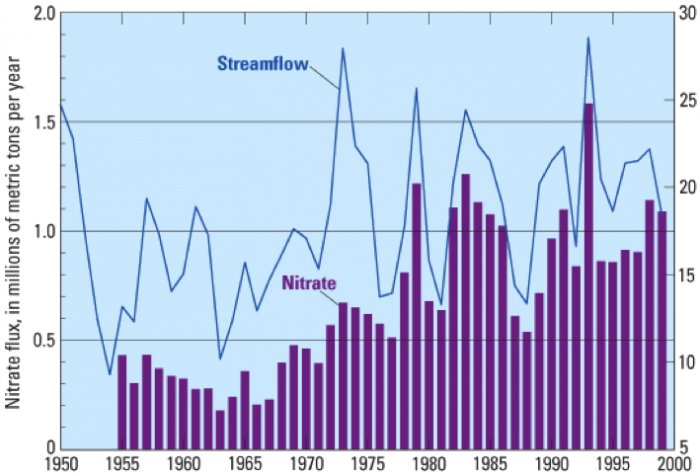
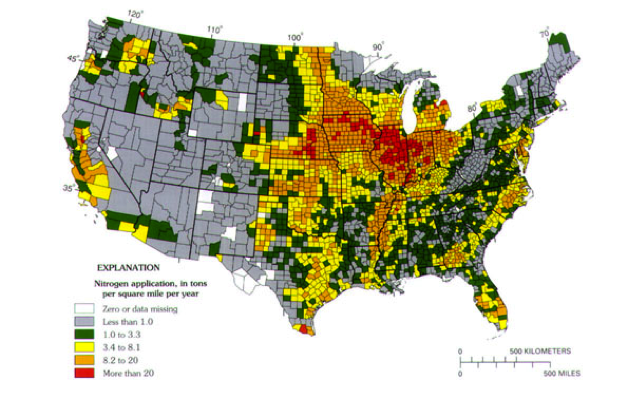
It is also clear from Figure 10 that very high rates of fertilizer application characterize the Mississippi River Basin. Think back to the section called Contaminant Example: Arsenic in Groundwater when you examined nitrate concentration variation in Iowa streams at present. It should be apparent that fertilizer applications and runoff are the main culprits in hypoxia in the Gulf of Mexico.