Floods
Floods
Video: Floods 101 | National Geographic (3:27)
This brief video from National Geographic describes the basics of flooding.
Narrator: Over the past hundred years, no other natural disaster in the US has caused more death and destruction than floods. They can happen any place, any day, any time. And they will likely only get worse. As people cluster around coastal regions and flood plains, our growing population will confront the awesome power of water. For thousands of years, farmers have depended on seasonal floods. The waters irrigated their crops and fertilized their lands. Today, excess water is channeled into reservoirs and power hydroelectric dams. But when water levels rise suddenly, far more than the ground can absorb, a flood occurs. Flash floods are a perfect example. Sudden storms unleash a torrential downpour. The runoff moves with surprising force. At a depth of two feet, the water can push aside a car. In fact, half of all deaths from flash floods involve vehicles. But floods occur in many other ways. Heavy rains and thawing snow fall can overwhelm rivers. Storm surge is caused by hurricanes and tsunamis inundate the coastline. Landslides and mudflows can displace large volumes of water. Dams break, levees fail.
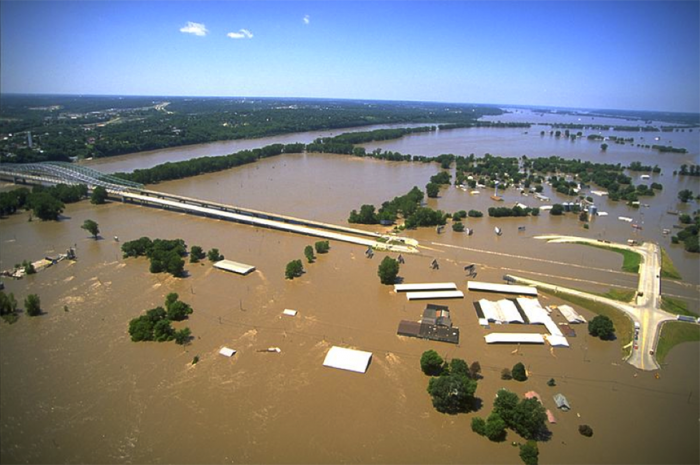
In the Great Mississippi Flood of 1993, several of these factors came into play. Over 10,000 square miles of the midwestern United States were overwhelmed with rain. In a cruel twist, the earthen dams known as levees. along the Upper Mississippi River, forced the water to flow downstream faster and stronger. Communities further downriver were hit with the full brunt of the Mississippi. Two-thirds of all the levees were breached. Though towns rallied to protect their lives and livelihoods, the damage was still immense. Over ten billion dollars in damages, 56,000 homes flooded or destroyed, and some 50 people were killed.
At the start of this century, another powerful flood wreaked havoc, this one coming from the sea. The storm surges of Hurricane Katrina submerged 80% of the city of New Orleans. Over 1,800 people died in the floods. The damage has been estimated at over eighty billion dollars. In some ways, the New Orleans disaster was unique. Much of the city lies below sea level and despite years of warning, the city was woefully unprepared to handle a breach of the levees which kept it dry. But we are still vulnerable. Sea levels may rise, coastlines could erode, rain patterns might change, snowpacks could melt, and then the waters would rush in.
Floods are rare events in which a body of water temporarily covers land that is normally dry. Following from module 3, we will mostly restrict our discussion to floods in rivers, but it is important to note that floods also occur around lakes, wetlands, and the sea coast. Indeed, coastal storm surge is among the most dangerous natural disasters expected to result from global warming and sea level rise. River floods occur naturally and in many cases are beneficial for ecosystem functioning because they allow the river to exchange water, sediment, and nutrients with the floodplain and cause scour and deposition that provides habitat for a wide range of aquatic and riparian organisms. However, floods often threaten human infrastructure and livelihoods and can cause severe economic damages.
River floods are typically caused by excessive rainfall and/or sudden melting of snow and ice. Most rivers overflow their banks with small floods about once every two years. Such are the floods that tend to determine the width and depth of a river channel, as discussed in module 3. Moderate floods might occur once every five to ten years and very large floods might only occur once in fifty or a hundred years. The average time period over which a flood of a particular magnitude occurs is called that flood’s recurrence interval, or return period. For example, the very large flood that only occurs, on average, once in a hundred years has a 100-year recurrence interval and is therefore called the 100-year flood. Relating this notion of recurrence interval to the section on probability, above, the recurrence interval is simply the reciprocal of the probability associated with an event (i.e., T = 1/p, where T is the recurrence interval and p is the probability that such an event will occur (or be exceeded), as computed by integrating under the dashed line shown in Figure 4, above the event magnitude of interest). The probability of a 100-year event occurring in any given year is 0.01, or 1%.
We should pay careful attention to our terms here. Note that we are talking about the average time period expected between events. Just because a 100-year event happened last year, there is nothing that says it cannot happen again this year. In fact, the probability of two 100 year floods occurring in back-to-back years is 0.01 times 0.01, or 0.0001. This suggests that, if everything stays the same, the 100-year event should happen in back-to-back years about once every 10,000 years. Of course, over 10,000 year time periods most things don’t stay the same. We’ll discuss this issue, termed non-stationarity, towards the end of the module.
Flash floods are typically caused by heavy rains falling on soils that are already wet or frozen (and therefore have limited capacity to absorb more water), or on land that is covered by snow (in which case the frozen soil has limited capacity to absorb water and the situation is compounded by the fact that melting snow adds to the runoff). Flash floods allow very little time for people downstream to be warned and are therefore especially dangerous. For example, flash floods caused by excessive rainfall from Tropical Storm Washi in the Philippines in December 2011 killed over 1200 people and caused tens of millions of dollars in damages.
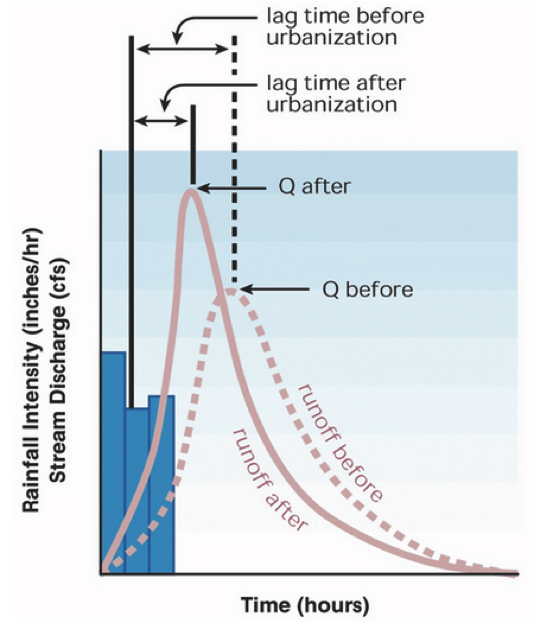
Expansion of urban areas can increase the frequency, magnitude, and flashiness of floods. Impervious surfaces (roads, parking lots, and buildings) route precipitation directly to stream channels and prevent draining of water slowly through soils to groundwater (Figure 5). The term flashiness refers to the rate at which the water levels rise and fall with faster rising and falling water levels considered flashier.
Hydrologic Versus Hydro-Geomorphic Perspectives
Hydrologic Versus Hydro-Geomorphic Perspectives
Scientists tend to think about floods in two different (but related) ways, one being strictly hydrologic and the other requiring an evaluation of the floodplain topography and how different flow regimes might impact the channel and surrounding areas. In module 3, we explored how hydrologic analyses (analyzing the patterns such as the frequency, duration, and magnitude of flood events) could be used to characterize the river flow regime (e.g., how often does the river exceed 800,000 cfs?). However, a hydrologic analysis does not provide information about the extent or duration of flooding across the landscape (e.g., which parts of the natural floodplain or streets will be flooded?). To predict how much of the floodplain might be inundated by a given flow, we need to consider the channel and floodplain topography (a hydro-geomorphic analysis). For example, a river system with low channel banks and a broad, flat floodplain will experience more frequent flooding of greater extent than a river system with tall banks and a narrow floodplain, given the same flow regime.
Because the size of a river channel can change over time, the relationship between the hydrologic flood frequency and hydro-geomorphic mapping of the area inundated may also change, as discussed in the later module section on hydrologic non-stationarity. For example, the Minnesota River (a major tributary of the Mississippi River) has widened by nearly 50% in the past 3-4 decades. Therefore a flood that may have inundated a significant amount of floodplain 50 years ago may now be entirely conveyed within the channel itself. Thinking back to the example of the Lehigh River in Figures 4 and 5 it is very likely that the 1941 flood (the lowest on record) did not fill the channel and inundate the floodplain. 1943 and 1944 had moderately high peak flows, but may also not have gotten out of the channel because the massive 1942 flood would have widened and deepened the channel. Over the following years, the channel would likely have narrowed again, in response to relatively smaller floods. Flood frequency analysis discussed below and in the exercise associated with this module, is strictly a hydrologic analysis. A hydro-geomorphic analysis is needed to estimate the risk of flood damage. Both types of analyses may be important for engineering plans and ecological studies. High-resolution topography data (elevation data with a vertical precision of about 15 cm and horizontal resolution of about 1 m, also known as ‘lidar’ for Light Detection and Ranging) is revolutionizing the way we make flood inundation predictions. Lidar data contains very detailed information about the ground surface, as well as vegetation on the floodplain, which exerts a strong influence on the velocity and depth of the water. Many states are revising their flood risk maps using this new high-resolution data.
Societal and Economic Implications of Floods
Societal and Economic Implications of Floods
Floods are consistently ranked among the most costly natural disasters around the world, with many billions of dollars in damages reported annually. For example, the Centre for Research on the Epidemiology of Disasters International Disaster Database [1] (EM-DAT) reports that floods accounted for four of the ten most deadly natural disasters in 2013, with confirmed global fatalities exceeding 9500 people (EM-DAT, (2013)). The same 2013 report documents $54 billion in damages directly related to river floods.
| Event | Country | Number of Deaths |
|---|---|---|
| Tropical Cyclone (Haiyan), November | Philippines | 7,354 |
| Flood, June | India | 6,054 |
| Heatwave, July | United Kingdom | 760 |
| Heatwave, April-June | India | 557 |
| Earthquake, September | Pakistan | 399 |
| Heatwave, May-September | Japan | 338 |
| Flood, August | Pakistan | 234 |
| Flood, July | China P Rep | 233 |
| Earthquake, October | Philippines | 230 |
| Flood, September-October | Cambodia | 200 |
| Total | 16,359 |
During late spring and summer of 1993 heavy rains all throughout the Midwestern US resulted in flooding along the upper Mississippi and Missouri river systems. The floods were the most costly in US history, causing about $15 billion in damages and forcing about 75,000 people from their homes. Heavy rains from Tropical Storm Irene in August 2011 caused approximately $10 billion in damages throughout the Caribbean and eastern United States (including flooding Kingston, NY during the wet period indicated in Figure 1). Notably, the numbers of fatalities associated with these extreme events were relatively low (~50 deaths each) due to remarkably accurate flood forecasting, highly effective emergency response systems and regulations that limit development in flood-prone areas.
Rivers that cannot transport their sediment load (sand and gravel) are particularly susceptible to flooding because sediment settles out in the river bed, causing the river channel to become shallower relative to its banks, thus increasing the chances of flooding. The Yellow River in China is one example of such a river. While the Yellow River has played a pivotal role in the Chinese economy for thousands of years, sedimentation has repeatedly caused the river channel bed and banks to actually build up higher than the surrounding floodplain. This is an especially dangerous situation that can cause the river to catastrophically flood, breach its banks, abandon its channel altogether, and ultimately form a new channel elsewhere within the floodplain, a process known as an avulsion. The Yellow River has caused many devastating floods, including a flood in 1332-1333 that killed an estimated 7 million people. Another Yellow River flood in September of 1887 inundated an estimated 130,000 km2 (50,000 square miles, an area approximately the size of Alabama!) and killed an estimated million people. Yet another flood in 1931 is estimated to have killed 1-4 million. Such catastrophic disasters have earned the Yellow River its nickname, ‘China’s Sorrow.’
Humans have made extraordinary efforts to reduce flood damages. In some cases, these efforts involve limiting development in flood-prone areas. In other cases, these efforts involve building structures meant to control the floodwaters. Flood control structures include dams and retention basins that store water and/or building levees, dikes, and floodwalls that attempt to keep floodwaters confined. Some of the most extensive flood control systems in the world include the floodway diversions on the Red River, which runs between Minnesota and the Dakotas and crosses the US-Canada border into Manitoba.
While we typically think of floods as dangerous and costly natural hazards, they can also provide benefits to society. For example, floods naturally deliver fresh, nutrient-rich sediments to their floodplains, which have historically benefited farmers in many places throughout the world. Yearly floods of the Nile River allowed the early Egyptian people to grow crops, which helped them thrive as a civilization for thousands of years. However, the severity of the floods was unpredictable and floods that were too large caused significant damage. Therefore, in the mid-1900s the Egyptians constructed a flood-control dam on the Nile River. The dam eliminated both the risks and benefits of annual flooding and therefore agricultural practices have had to adapt by using irrigation and petroleum-based fertilizers to replace the water and nutrients that are no longer delivered to the floodplain by the river.
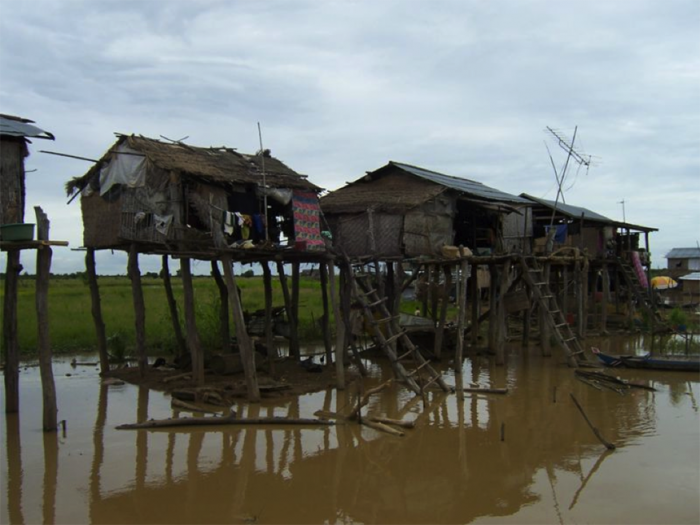
Flood control is not always feasible, given the unpredictable nature of these events as well as geographic or economic constraints. Nor is flood control necessarily desirable in many situations, given the potential environmental benefits for the river and floodplain discussed at the beginning of this section and discussed in greater detail towards the end of this section. In such cases, efforts can be made to reduce economic losses from floods. For example, in many places regulations limit the construction of permanent buildings on floodplains. Emergency response programs, such as the National Weather Service and Federal Emergency Management Agency (FEMA) help flood victims by improving methods to warn and evacuate people from flood-prone areas and to provide relief aid. In an alternative approach, communities in Tonle Sap, Cambodia have constructed their houses on floats and stilts to deal with the annual flooding of 8-9 m (26-30 ft) from the Mekong River.
In many places, flood insurance can be purchased to help cover costs associated with residential and commercial flood damages. However, the private insurance industry is somewhat limited because the number of potential claimants far exceeds the number of people who wish to ensure their property against flooding. As a result, the US Congress created the National Flood Insurance Program in 1968. The program is an effort to provide flood insurance to protect homeowners, renters, and business owners as well as an effort to encourage communities to adopt flood risk management policies established by FEMA.