Module 8.1: Cities in Peril: Dealing with Water Scarcity – History and Current Approaches
Module 8.1: Cities in Peril: Dealing with Water Scarcity – History and Current Approaches
In this first part of Module 8, we will focus on current strategies for addressing water scarcity. In part, these strategies have arisen within the confines of water laws that have shaped the history of water access and allocation, especially in the American West. After a primer on this legacy that defines the "water allocation landscape", you will learn about the wide-ranging portfolio of approaches utilized by Los Angeles and Las Vegas - cities at the vanguard of creative and modern water management - to hedge against water shortage.
Goals and Objectives
Goals and Objectives
Goals
- Describe the two-way relationship between water resources and human society
- Explain the distribution and dynamics of water at the surface and in the subsurface of the Earth
- Identify strategies and best practices to decrease water stress and increase water quality
- Thoughtfully evaluate information and policy statements regarding the current and future predicted state of water resources
Learning Objectives
In completing this module, you will:
- Compare land use in areas with contrasting access to fresh water
- Calculate the water needed to support a given population and compare with available resources
- Analyze water supply (scarcity) problems and solutions in the Western US
- Evaluate the policy of annexing water rights from both scientific and ethical perspectives
- Assess the sustainability of water banking as a solution to water scarcity in the event of sustained drought
- Assess the long-term effectiveness and scientific basis of the Colorado River Compact
Surface Water Allocation and Management
Surface Water Allocation and Management
In the U.S. there are some differences regionally in how surface water allocations are handled. In large part, these differences arose historically and have been modified and given legal standing.
Riparian Doctrine
Riparian Doctrine
This doctrine has its roots in the Code Napoleon (1804) and English Common Law and has been applied primarily in states east of the Mississippi River. The basic provisions in the early 1800s were that:
- so-called "Riparian water rights" extend to the center of a non-navigable water course;
- navigable water courses belong in the public domain and cannot be obstructed (although it appears that access from privately owned stream banks could be denied);
- mills or milldams could be developed by landowners with stream bank holdings and could be transferred upon sale of property;
- beyond use for millraces, excess water could not be removed and water returned must be equivalent to that removed in quantity and quality; and
- riparian landowners must be compensated for illegal capture of water by others. This last stipulation was interpreted by the U.S. Supreme Court (in 1827) in a way that gave riparian landowners (those with properties bordering a stream) the right to make "reasonable" use of water in a stream. However, they cannot claim ownership of the water, nor can they divert or dam a stream to the detriment of other riparian landowners.
All states (31 states) east of the Mississippi River have water allocation laws based on the Riparian Doctrine. Any waterway that can be used for navigation in its normal condition is considered navigable. If it is only used for intrastate commerce or transport, it is under control of that state. If used for interstate or foreign commerce or transport, it is under the control of the Federal government. There is no "water ownership" under the present Riparian Doctrine and principles of Reasonable Use and Correlative Rights are applied. Riparian landowners can use any quantity of water as long as it does not interfere with the rights of other landowners. They must also, therefore, share the total flow of stream water with other riparian landowners; for example, during a drought, restrictions on water extraction can be enacted to allow all owners (users) a reasonable share of the reduced flow in proportion to their ownership of stream bank property. During floods, riparian landowners can take exceptional action to protect their property, regardless of consequences for other landowners. In addition, the Riparian Doctrine is being altered in some states to allow permits to allocate water based on rates of use and other factors that can be changed by the state at any time. Courts or state water agency officials settle disputes over alleged injurious water use. The Riparian Doctrine works because water resources east of the Mississippi River are not, in general, limiting and irrigation for agriculture is not necessary.
Doctrine of Prior Appropriation
Doctrine of Prior Appropriation
This water law principle developed somewhat gradually in the western U.S. Many western streams had intermittent flows that were not amenable to the specifications of the Riparian Doctrine. Initially, the sparse settlement, general lack of competition for water resources, and seasonality of flow of western rivers allowed landowners to modify river channels to impound water for their use—first-come, first-served. Certainly, the Federal government did not anticipate widespread settlement of the West because it was so arid. By the early to mid-1800s, the influx of Mormon settlers in Utah required some solution to relatively sparse water resources in the face of increased agricultural activity. In response to the need and their religious principles, they established a water allocation system that favored shared use of that resource with a principle that favored beneficial use. However, the beneficial use philosophy was later replaced by that of the "Prior Appropriation Doctrine."
The Prior Appropriation Doctrine grew out of the California gold rush, and the need for gold miners to establish some system of mining claims and water use because of the limited water resources available. This is where the "first come, first served" aspect of water rights arose. California, which became a state in 1850, therefore adopted the Doctrine of Prior Appropriation that allowed diversion of water from a watercourse for use on non-riparian lands. In other words, if irrigation of crops or washing of mine tailings was required on lands with no direct stream access, these uses were permitted, with a priority (time of claim) basis. This doctrine established water rights, based on priority use, that could be sold or transferred as long as they did not interfere with another prior appropriation (" first in time, first in right" as long as this appropriation was properly filed). This doctrine prohibited "junior" (later claimants) users from using water if the resource was so limiting as to reduce that available to "senior" claimants below their allocation. Presently, the "California Doctrine" allows the application of both the Riparian Doctrine and the Doctrine of Prior Appropriation to operate (the so-called California Doctrine), depending on the availability of water resources (e.g., more water-rich northern California vs. arid southern California). Other states had somewhat different histories, but still made use of modified versions of the Doctrine of Prior Appropriation. Colorado, in particular, established the doctrine with respect to agricultural use for non-riparian lands. An interesting aspect of the Prior Appropriation Doctrine is the "use it or lose it" aspect. Once a claim is made, the water use must meet the stipulations of the claim annually, or, potentially, lose that claim. New claims relating to the expansion of irrigation, for example, are treated as "junior" claims that may or may not be honored, depending on the surface-water flow rate and other more senior claims.
Colorado, Alaska, Arizona, Idaho, Montana, Nevada, New Mexico, Utah, and Wyoming presently apply the strict Doctrine of Prior Appropriation as established in Colorado. California, Kansas, Nebraska, North Dakota, Oklahoma, Oregon, South Dakota, Texas, and Washington use the California Doctrine, whereas Hawaii applies its own version of priority depending on the water use.
Activate Your Learning: 2-Minute Essay
Read the question below and write about what you think for just two minutes.
If you raised crops on 100 acres in Pennsylvania and owned land that did not border a watercourse, how might your experience differ from farming 100 acres in Nevada if you did not own land bordering a perennial stream? Set a timer on your cell phone or computer for two minutes.
If you lived in Pennsylvania, you could drill a well to access groundwater to irrigate your crops. In Nevada, this would not be a feasible option. If your land didn't border a stream, you would need to divert water from somewhere else.
Cities in Peril: LA
Cities in Peril: LA
The Giant Straws of Los Angeles
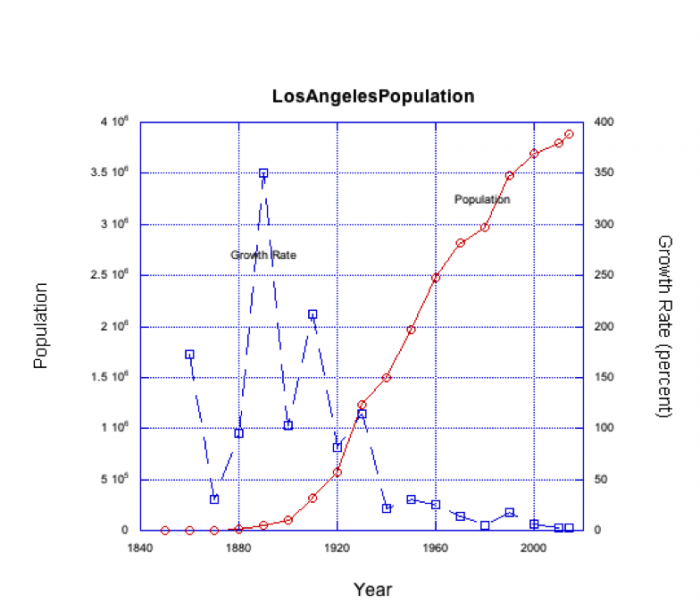
To see Los Angeles, with its lush landscaping and common swimming pools, one would never believe it to be water limited. Los Angeles is a sprawling agglomeration of towns and neighborhoods spread over nearly 470 sq. miles (1220 sq. km) of semiarid hills and valleys (precipitation is about 15 in--38 cm-- annually). One river, the Los Angeles River, runs through the city to the sea, but this watercourse flows only intermittently and--mainly for flood control--has now been straightened and confined to a concrete channel. The City of Los Angeles now has nearly 3.9 million people living within its borders, a far cry from the estimated 1600 people that lived there in 1850 when (a smaller footprint) LA was first incorporated (Fig 1). By 1900, LA's population had grown to over 100,000, and the local water supply was deemed inadequate. Thus began LA's quest for additional water resources. The subsequent history of water acquisition, especially that of Owen's Valley water and the LA aqueduct (see L.A. Aqueduct Centennial 2013 [1] for pics) engineered by William Mulholland, makes very interesting reading ("Cadillac Desert" by Marc Reisner, p. 54-107). Controversy still surrounds this acquisition. Table 1 shows the major aqueducts that now supply water to LA.
| Aqueduct | Year Complete | Year Construction | Length | $ Cost | Delivery |
|---|---|---|---|---|---|
| Owens Valley and LA Aq | 1913 | 5 | 223 mi | 23mill | 485 cfs |
| Second LA Aq. | 1970 | 5 | 137 mi | 89mill | 290 cfs |
| Colorado River Aq. | 1941 | 10 | 242 mi | 220mill | 1600 cfs |
| California Aq. and West Br* | 1973 | 1960 appop | 701 mi | 5200mill | 4400 cfs |
*California State Water Project: note that the length and cost is for the entire system, not just LA, and the cfs for the West Branch is not what LA alone receives. Source: California State Water Project At a Glance [2]
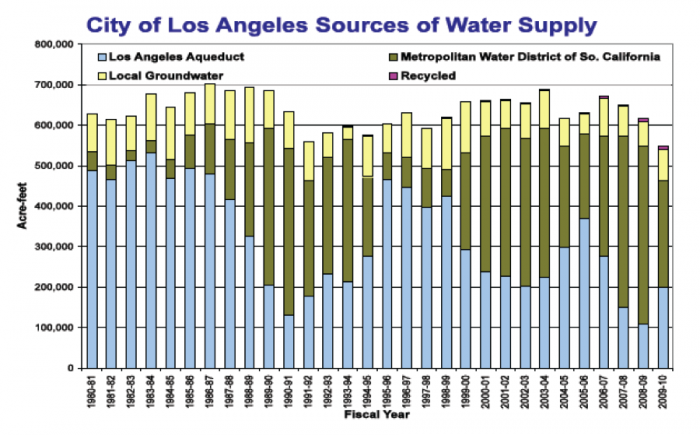
The second LA Aqueduct was built to take advantage of additional water taken from the Mono Lake drainage through an 11-mile tunnel drilled under the Mono Craters to connect to the Owens Valley system. Today, about 70% of LA's water comes from the Eastern Sierra. The two LA aqueducts supply nearly 430 million gallons per day (about 100 gpd per person in the City of Los Angeles today!). Groundwater wells in the San Fernando Valley and other local groundwater basins supply 15% of water needs, and purchases from the Metropolitan Water District (Colorado River Water and California State Water Project) supply the remaining 15%. Variation in use of each of these sources year by year (Figure 2) is a function of water supply available at the source resulting from drought, competing uses, and other factors. For example, the period between 1987 and 2004 required the purchase of considerably more water from MWD sources (at greater expense) because of severe drought/low snowpack in the eastern Sierra Nevada during that period.
Activate Your Learning: Think about it!
Imagine if your hometown annexed water rights from somewhere as far away as Mono Lake is from Los Angeles. Where would that water come from for your hypothetical case?
Water Use Trends in LA
Water Use Trends in LA
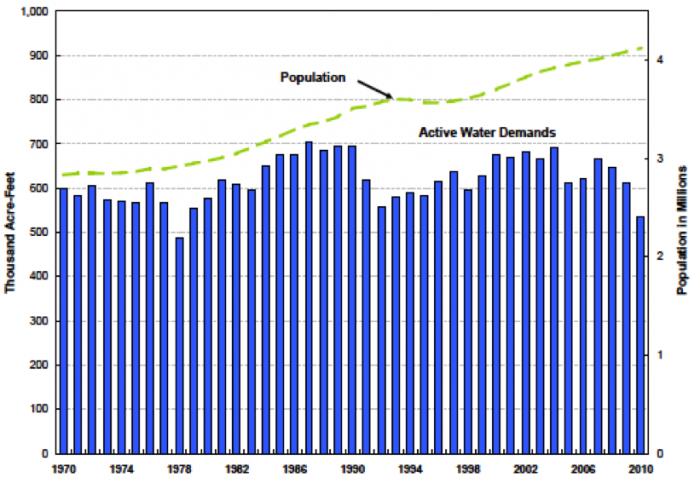
The trend in total water use for the City of Los Angeles (Figs. 3 and 4) is interesting because, although the population has increased significantly since 1970, average demand has remained relatively constant between 600 and 700 million acre-ft per year. This is a testimony to the effects of conservation and reuse because of source limitations (competing uses, drought) and rising costs. Economic downturns may also play a role. Certainly, one way to conserve water in LA is through limiting outdoor water use (car washing, landscaping/lawns). It is estimated that watering landscaping for individual homes is about 38% of total water use. Perhaps, like Las Vegas, LA should further encourage xeriscaping and graywater use for irrigating lawns and golf courses, but more on solutions in Module 8, Part 2 next week.
Cities In Peril: Las Vegas
Cities In Peril: Las Vegas
The Survival of Las Vegas
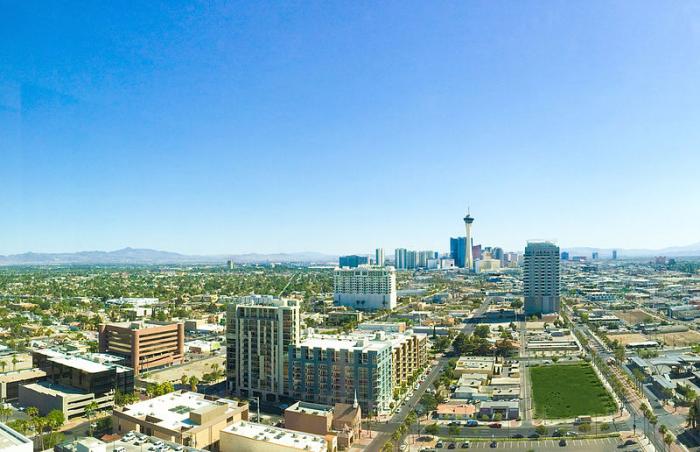
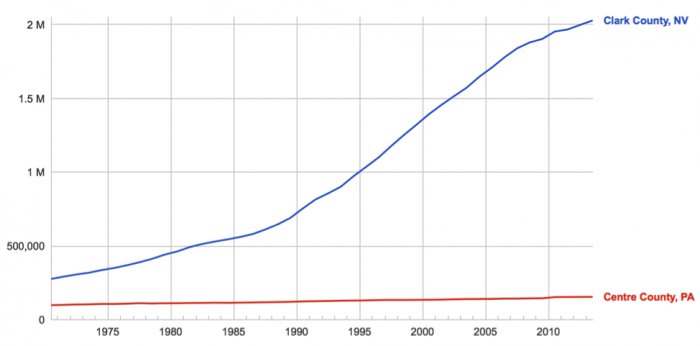
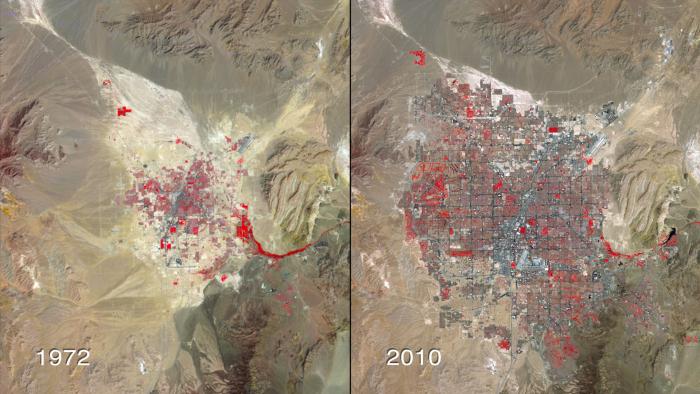
It’s hard to think about Las Vegas without images of stereotypical excess: gambling, bachelor(ette) parties, luxurious hotels, swimming pools, golf in the desert, posh fountains, celebrities, major music, and entertainment acts, and famous restaurateurs. On the one hand, it may seem incongruous that Las Vegas and the surrounding Clark County, which receive only 4 inches of rain per year on average and lie within one of the driest regions on Earth (Figure 5) (as discussed in Module 1), are also home to one of the fastest-growing populations in the U.S. (Figure 6; See also the interactive link in the caption below). On the other hand, it may be surprising that Las Vegas is among the most water-conscious cities in the nation, and as discussed below, despite rapid economic and population growth over the past two to three decades the city has managed to live within the limits of its relatively meager allocation of water from the Colorado River, the main water source for the region (see Colorado River Compact).
A Familiar History of Water and Population Growth
A Familiar History of Water and Population Growth
In the mid-1800s, early settlers named the area "Las Vegas", Spanish for "the meadows", because the Valley, fed by the Las Vegas Springs, was lush, grassy, and green. The springs yielded approximately 5,000 acre-feet of water per year. As you may recall, this is about the amount of water needed today to support 5,000 families of four, or a population totaling around 20,000. With a plentiful natural water supply, Las Vegas became a key stop and hub for the railroads: first the San Pedro, LA, & Salt Lake City Railroad, and later the Union Pacific.
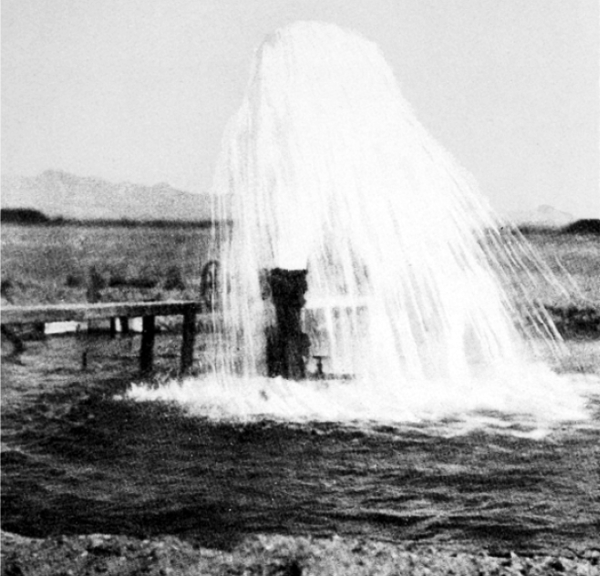
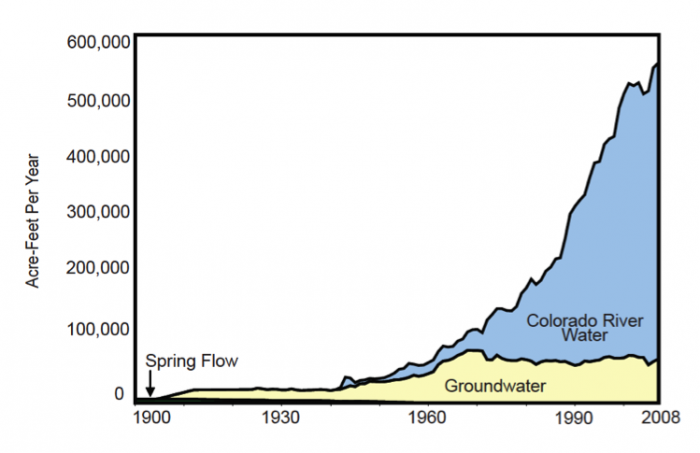
In the early 1900s, private wells drilled into the valley-fill confined aquifer became commonplace to augment the spring flows, as residents tried to turn the valley into productive farmland. Many of the wells were artesian but were left uncapped (Figure 7). By 1912, the 1000 residents of Las Vegas withdrew about 22,000 acre-feet of water per year from the springs and aquifer. By 1930, a combination of several dry years and increasing demand led to overdraft conditions. In the meantime, the Colorado River Compact of 1922 allocated a small amount of Colorado River water to Southern Nevada (see Sidebar: CO River Compact). However, Las Vegas continued to rely principally on groundwater, and aside from some industrial uses, the Colorado allotment went largely unused until the 1940s. (Note that Hoover Dam, the primary infrastructure that allows surface water storage and withdrawal for Clark County, was not completed until 1936.)
With a steadily growing population and water demand, withdrawals greatly exceeded natural recharge and overdraft of the aquifer worsened. In an effort to reduce groundwater extraction, the Las Vegas Valley Water District was created in 1947, in part to begin using the Colorado River allotment. Despite these efforts, by 1960 the valley’s population had swelled to over 110,000, and almost 50,000 acre-feet of water were extracted from the aquifer annually. The natural springs dried up in 1962, and sustained overdraft led the potentiometric surface to drop by a few feet per year on average. The pattern continued through 1971 until the Southern Nevada Water System began delivery of Colorado River water from Lake Mead for municipal supply – 24 years after the water district was created.
With a plentiful supply (300,000 acre-feet per year) of Colorado River Water ready for delivery and distribution, population growth accelerated, reaching almost 700,000 by 1990 (Figure 8), and about 2 million by 2012. Coincident with the shift to water supply from Lake Mead in 1971, dependence on groundwater gradually started to decline (Figure9). As discussed in more detail below, managed (induced) recharge of the groundwater system using surplus Colorado River water was begun on a small scale in the late 1980s; this “banking” of water in wet years or times of surplus is viewed as one strategy to cope with water shortages.
Current Water Use and Sources
Current Water Use and Sources
Currently, about 90 percent of Southern Nevada’s water comes from Lake Mead (the Colorado River) (Figure 9); the rest comes from groundwater. Because of the very limited natural recharge to the aquifer system, and the fact that no other surface water is available, Las Vegas depends almost exclusively on the Colorado River to sustain its population and economy. The city is essentially at the mercy of the Colorado River. When the Colorado River Compact was signed in 1922, the allotment of 300,000 acre-feet per year was viewed as generous for the sparsely populated state. However, as may sound like a familiar story, with a rapidly growing economy, combined with good weather and apparently plentiful water, population growth rapidly exceeded most projections (see Figure 5).
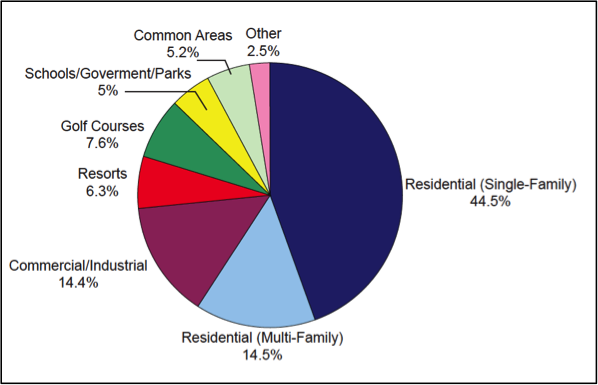
Of the water delivered by the Southern Nevada Water Authority, it may be surprising to note that most (almost 60%) goes to residential use (Figure 10). Of this, a large fraction is used consumptively for watering lawns. As discussed in detail in The Big Thirst, incentive programs for removal of turf from parks, common areas, and residences is one strategy to reduce water use. Golf courses and resorts, which are often the stereotypical poster children for water “waste” in Las Vegas, use about 14% combined.
The pie chart shown in Figure 10 provides the first blueprint for conservation efforts and potential re-use, by identifying the key water uses in the district. Moreover, there is also a recognition that not all water uses are “equal”: some require clean water (i.e. residential uses, many industrial uses, medical), whereas others do not (golf courses, parks). As a result, reclaimed and partly treated water may be used for many needs. In Las Vegas, water re-use – essentially getting two uses of the same water - is one part of a diverse strategy to maximize the limited allocation of Colorado River water (additional detail on treatment facilities and pricing for reclaimed water are described on the water district’s website [8].
Click for a text description
Dealing With Water Scarcity: A Diversified Portfolio
Dealing With Water Scarcity: A Diversified Portfolio
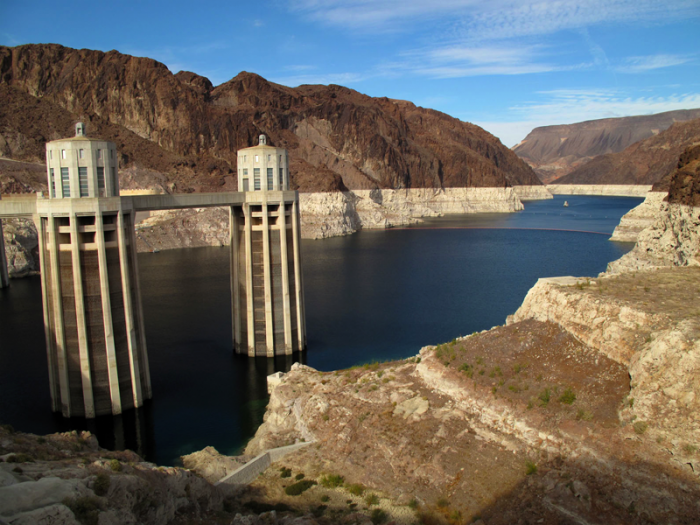
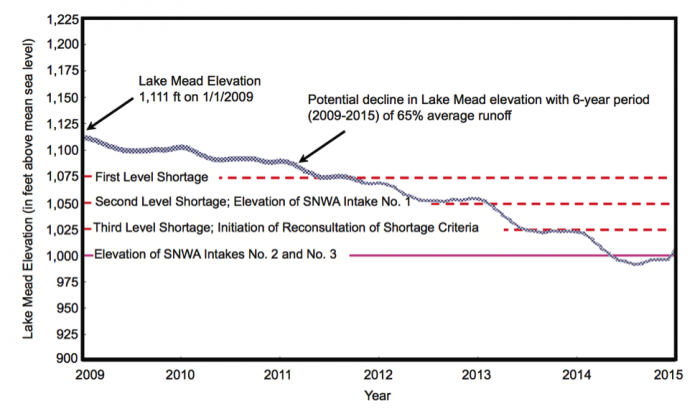
Due to a decades-long drought in the Colorado River system (see Sidebar: CO River Compact), the water level in Lake Mead has dropped by almost 140 feet since 2000 (Figure11). This corresponds to a decrease from ~25 million acre-feet of stored water to around 10 million acre-feet. If the lake water level drops to 1075 feet (as of Nov. 1, 2014, it is 1083 feet!), a federal shortage would be declared, triggering a reduction in Nevada and Arizona's allocations. To make matters worse, the two intakes in Lake Mead that withdraw water for Las Vegas cannot function if the lake level drops below 1050 feet (intake #1) or 1000 feet (intake #2). With the possibility of continued dry conditions, and because of their near sole dependence on Colorado River water, Las Vegas has developed a multi-pronged strategy to hedge against uncertainty due to future climate change coupled with likely increased demand due to growth and development in Clark County.
Conservation
Conservation
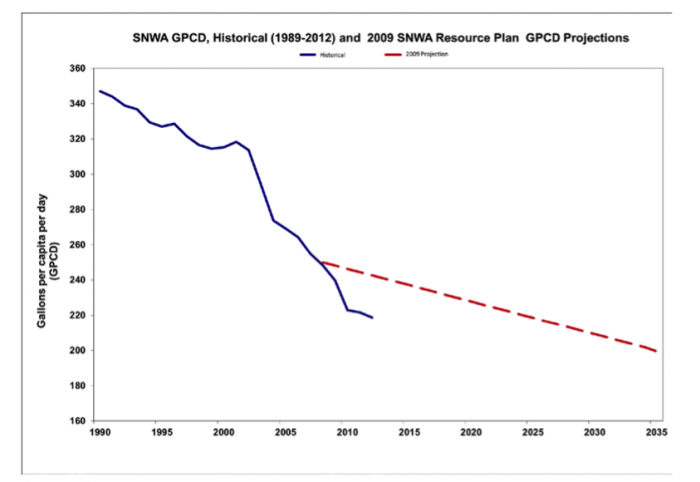
As you have read about in The Big Thirst: Dolphins in the Desert, Las Vegas has been aggressive in water conservation efforts. Part of these efforts focuses on simple reductions in household water use through education, regulation (i.e. watering restrictions), and incentivized removal of water-intensive landscaping. The city has also implemented GPS technology and pressure and acoustic sensors to monitor leaks in their pipelines to limit leaks and thus maintain high efficiency. As a result of these efforts, per capita, water use in Las Vegas has decreased substantially over the past 20 years or so, from over 340 gallons per day to less than 200 gallons (a 40% reduction!) (Figure 12). The SNWA has set a conservation target of 199 gallons per day fro 2035. As a result, Southern Nevada's total annual water use dropped by almost 90000 acre-feet (30 billion gallons) from 2002 to 2012, even as its population grew by 400,000.
Additionally, as noted above, Las Vegas treats wastewater for re-use, especially for applications that (a) don’t require high-quality water, like watering golf courses and parks; and (b) are consumptive. Re-use, incentivized by lower pricing, effectively allows the same water to be used twice, thus making the modest allotment of Colorado River water go further. Indeed, although Southern Nevada’s gross withdrawals from Lake Mead are almost 600,000 acre-feet per year (Figure 9), this is offset by the return of treated water to the Lake such that net withdrawals (consumptive use) remain at the 300,000 acre-feet limit.
New Sources: Tapping Groundwater
New Sources: Tapping Groundwater
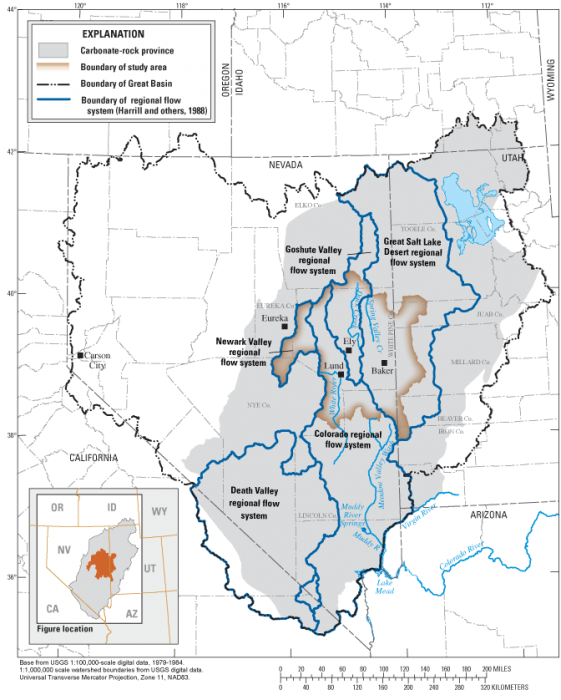
Despite a history of overdraft in Las Vegas itself, Southern Nevada has recently turned its eyes back to the underground as an additional water source – but this time in sparsely populated valleys to the North and Northeast of Clark County (Figure13). The rationale for the SNWA’s “Groundwater Development Project” is that groundwater recharge is partly a function of the area over which infiltration occurs, so distributed withdrawals of groundwater from several large valleys fill aquifers outside of Las Vegas may be more sustainable than focused withdrawals from only the local aquifer system. Additionally, the targeted aquifers are in sparsely populated areas, with relatively small water demand.
Nonetheless, as you might imagine, there has been strong opposition to the plan from both environmental groups and ranchers and residents of these valleys, especially when considering past examples of the annexation of water rights for large cities (e.g., Los Angeles and the Owens Valley) and the negative outcomes for the local communities.
Water Banking
Water Banking
As another hedge against water shortage and climate change, the Southern Nevada Water Authority has entered into a series of “Water Banking” agreements with other the Lower Basin Colorado River states, Arizona and California. In these agreements, Nevada pays the other Colorado River water rights holders to store unused water in times of surplus by injecting it into aquifers. Nevada then receives credits for the stored water; if the water is needed, Nevada uses the credits to draw the equivalent water from Lake Mead, and in exchange, the “banker” withdraws the same amount from the aquifer. Although pumping is energy-intensive, groundwater banking does not require the construction of large reservoirs, and the water is not subject to large evaporative losses.
In its water banking agreement with Arizona, the SNWA paid $100 M initially and began making yearly $23 M payments in 2009 that will continue through 2019. The agreement allows the SNWA to withdraw up to 40,000 acre-feet per year. In 2004, SNWA also began a water banking agreement with the Southern California Metropolitan Water District (the water district that serves L.A.) in which some of Nevada’s surplus Colorado River water is stored in an aquifer in Southern California. The agreement allows the SNWA to withdraw up to 30,000 acre-feet per year, provided that they give 6 months notice. Since 1987, Southern Nevada has also been banking its own surplus water – when available - in the valley’s aquifer for later use if needed. To date, about 330,000-acre feet have been stored.
Learning Checkpoint
1) How much is the cost of water banking per acre-foot? Do you think that’s worth it – and how does it compare to the cost of other water resources?
ANSWER:
2) Do you see a problem with the water banking approach to mitigating drought? Do you think it is sustainable in the long-term? Why or why not?
ANSWER:
The Third Straw
The Third Straw
In 2005, faced with the specter of prolonged drought and projected Lake Mead water level declines, the SNWA board of directors approved construction of the so-called “Third Straw”, a new $812 M intake from Lake Mead that would allow Southern Nevada to physically extract water from the lake at water levels as low as 1000 feet above sea level (Figure 14). Construction of the intake involves boring a 23-foot diameter tunnel through 3 miles of rock, with much of its length beneath one of the Earth’s largest man-made reservoirs!
The new intake will intersect the lake at 860 feet above sea level but will share a pumping station with intake #2, so will only be able to operate at water levels of 1000 feet (the same as for intake #2). The primary purpose of the third straw is to maintain overall system capacity if Lake Mead falls below the 1050 ft water level limit for operation of intake #1. It also will access the deepest parts of Lake Mead, where water quality is highest. The initial plan for the third intake included a separate pumping facility but was removed to cut costs. It is always possible that the $200 million pumping station and pipelines could be added in the future, though if the Lake Mead water level were to drop much below 1000 feet, there would be much bigger problems throughout the lower Colorado River basin.
The Colorado River Compact
The Colorado River Compact
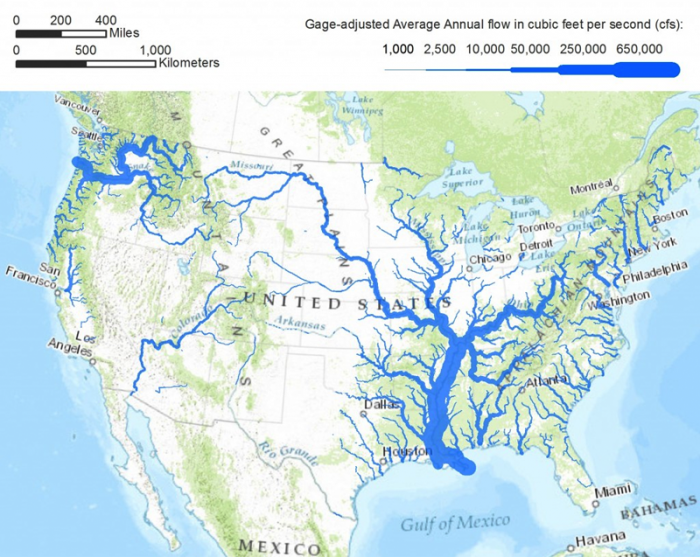
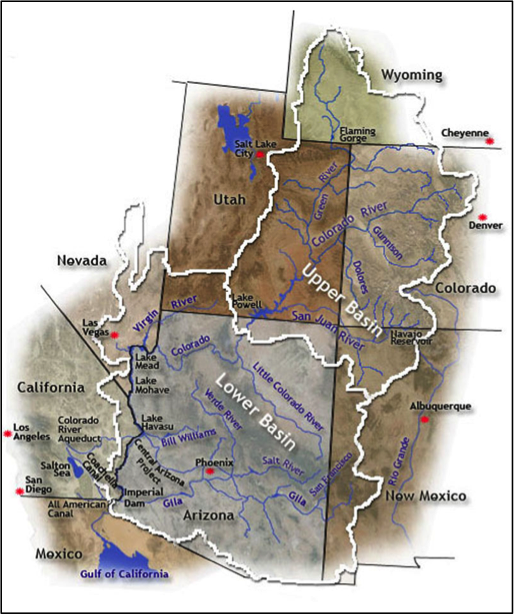
The Colorado River flows almost 1500 km from its headwaters in Wyoming, Colorado, Utah, and New Mexico, through Nevada, Arizona, and California, before crossing the border to Mexico and flowing to the Gulf of California. It is the lifeblood of the American Southwest, serving almost 30 million people and enabling cities, industry, and irrigation-based agriculture to thrive in one of the direst climates on Earth (see Figure 1 in Module 8.2). The river also provides hydroelectric power that spurred much of the 20th-century development of the Southwestern U.S.
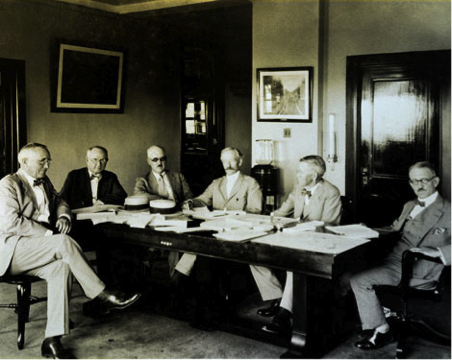
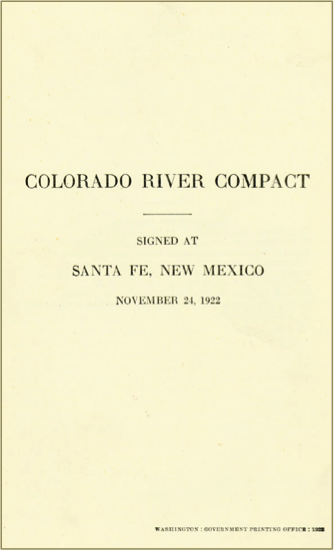
In 1922, these seven western states and the federal government negotiated an agreement, the Colorado River Compact (Figure 15) to allocate water rights on the river. First and foremost the compact partitioned water between Utah, New Mexico, Wyoming, and Colorado (the Upper Basin States) where most of its discharge originates as snowmelt); and Arizona, Nevada, and California (the Lower Basin States), where population growth and water demand were increasing rapidly (Figure 16).
The compact was borne in part out of the Upper Basin States’ unease that water projects and use of the river (e.g., by construction of the planned Hoover Dam) by the Lower Basin States at the time would, if interpreted through the lens of the doctrine of prior appropriations, impact their future claims to water from the river. The compact specifies that the Upper and Lower Basin would each have the rights to 7.5 million acre-feet of water per year. To accomplish this while recognizing that not all years would be the same, the delivery of 7.5 million acre-feet per year to the Lower Basin is evaluated based on a ten-year running average (i.e. the Upper Basin must deliver 75,000,000 acre-feet for any span of ten consecutive years). In fact, the primary purpose of Glen Canyon Dam, unlike Hoover Dam, which generates hydroelectric power and serves as the distributary dam for the Lower Basin States, is to serve as a large “capacitor” in the river system to help ensure that this agreement can be met. Later amendments to the agreement included the 1928 Boulder Canyon Project Act, the 1944 Mexican Water Treaty, and the 1948 Upper Basin Compact. In combination, these amendments spelled out the allocation of water between the individual states, and also allocated 1.5 million acre-feet for Mexico (Table 1).
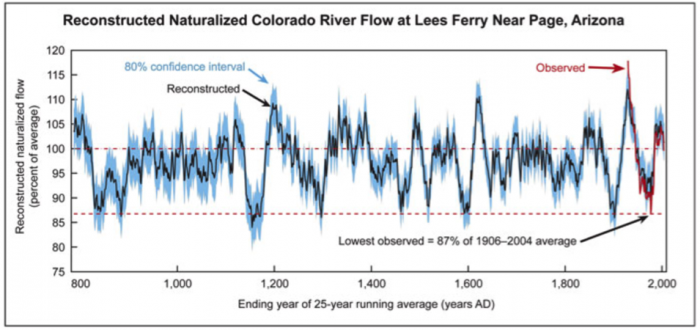
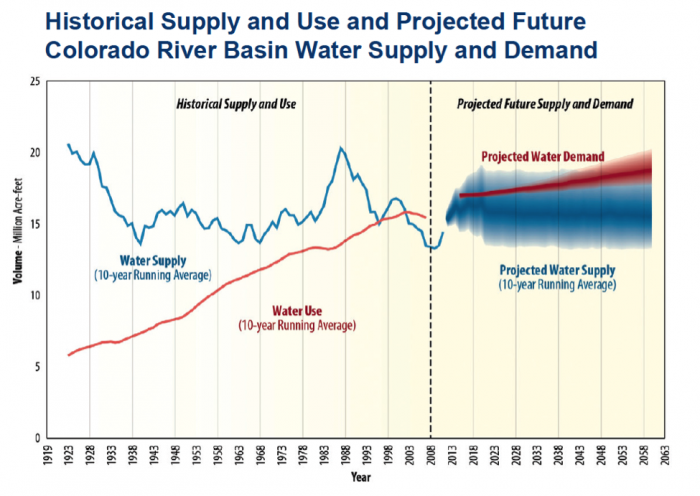
Of course, the specification of an absolute amount of water to each of the states and Mexico has raised a few serious problems that remain contentious. First, the river is over-allocated. The 1920’s – coincidentally the time that the Compact was negotiated was an anomalously wet period with annual flows as high as ~20 million acre-feet (Figures17-18). In contrast, the long-term mean discharge of the river is about 15 million acre-feet, yet 16.5 million are allocated. Furthermore, the river flow is highly variable and based on historical data and tree ring reconstructions, it seems that decades-long dry periods with flows less than 13-14 million acre-feet may be common. Second, climate projections indicate that the region will become drier in the long-term, and some have suggested that we have already entered an era of steadily declining river flows along the Colorado. Fourth, improved understanding and renewed interest in the environmental impact of decades of dramatically reduced flow have spurred new pressures to allocate some discharge for the natural system. Finally, demand is likely to increase as populations in the region continue to grow, further stressing the already over-allocated river (Figure 18).
Colorado River Allocations (Million Acre-Feet per year, ten-year running average)
| Colorado | 3.9 |
|---|---|
| Utah | 1.7 |
| Wyoming | 1.0 |
| New Mexico | 0.85 |
| Nevada | .30 |
|---|---|
| Arizona | 2.85 |
| California | 4.4 |
| Mexico | 1.5 |
|---|---|
| Total | 16.5 |
Total of Colorado River Allocations(in Million Acre-Feet per year) = 16.5
Summary and Final Tasks
Summary and Final Tasks
Summary
In the first part of Module 8, you’ve learned about the water appropriation laws that have shaped access to water in much of the U.S. As you’ve seen, cities, especially in the arid American West, now must operate within the limits of these water appropriations, regardless of population or economic growth they have accommodated in recent decades. The tension between finite water allocation (i.e. from the CO River) and continued growth has motivated a diverse portfolio of strategies in place to cope with water scarcity and potential shortage. You are now well versed in these approaches, and should be able to describe them, and discuss the costs and benefits of each. In the second part of Module 8 (Module 8.2), we will build upon this knowledge and introduce another risk factor for water supply - that of climate change.
Reminder - Complete all of the Module 8.1 tasks!
You have reached the end of Module 8.1! Double-check the to-do list on the Module 8.1 Roadmap [16] to make sure you have completed all of the activities listed there before you begin Module 8.2.
References and Further Reading
The Big Thirst Chapters 5 and 7
Southern Nevada Water Authority 2015 Water Resource Plan [17]