Water Distribution on Earth
Water Distribution on Earth
Where is water distributed on Earth?
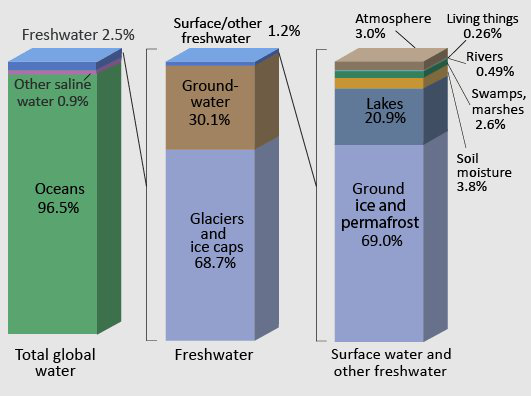
Earth is often called the “Blue Planet”, because of its abundance of liquid water. As we’ve already covered in Module #1, this water is distributed in the oceans, ice caps and glaciers, surface water (streams, lakes, and rivers), groundwater, soil moisture, the atmosphere, and in biomass. However, these reservoirs of Earth’s water are not static; water is constantly fluxing between them. We see this transport of water every day, for example in the form of flowing rivers, rain and snow, and groundwater springs.
| Type | Percentage |
|---|---|
| Oceans | 96.5 |
| Other saline water | 0.9 |
| Freshwater | 2.5 |
| Type | Percentage |
|---|---|
| Glaciers and ice caps | 68.7 |
| Groundwater | 30.1 |
| Surface/other freshwater | 1.2 |
| Type | Percentage |
|---|---|
| Ground ice and permafrost | 69 |
| Lakes | 20.9 |
| Soil moisture | 3.8 |
| Atmosphere | 3 |
| Swamps, marshes | 2.6 |
| Rivers | 0.49 |
| Living things | 0.26 |
Systems Thinking and the Hydrologic Cycle
Systems Thinking and the Hydrologic Cycle
Throughout this course, we will be dealing with complex systems and “Systems Thinking”. What is Systems Thinking, you may ask? According to Peter Senge, author of The Fifth Discipline Fieldbook, “Systems thinking is a way of thinking about, and a language for describing and understanding, the forces and interrelationships that shape the behavior of systems”. Some systems are very complex, but all systems can be simplified to help understand the relationships between systems components. Systems can be "modeled" to help investigate their dynamics. We do not expect you to become system modelers, per se, but simple models can begin to help you understand how changes in one parameter might influence changes in another. Let's consider a simple system in which we have a bathtub, fed by a faucet, and drained at its lower level. We could diagram this simple system as follows…
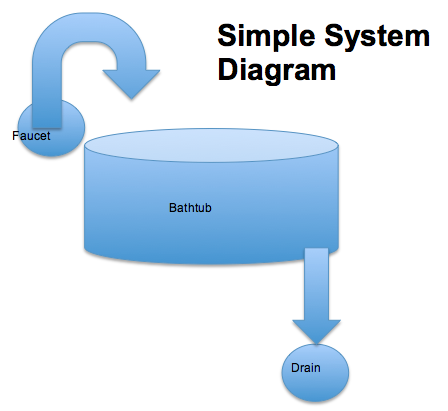
In this system there is a reservoir (the bathtub), an input (the faucet), and an output (the drain). The relationships in this system are simple and, hopefully, intuitive. If you want to run water into the tub for a long time to keep it quite warm, but not have it run over, what are your choices? You could keep the drain closed and run a very slow trickle of warm water into the tub from the faucet, letting it fill gradually, or, you could fill the tub quickly to some level, then open the drain to allow water to leave the tub at the same rate as it is being added to prevent further rise in the water level. Cold water is more dense than warm, so perhaps cooler water would drain preferentially and this would keep the tub water warmer overall. You could also evaluate the time it would take to fill the tub, or drain it, knowing the tub volume (gallons), the maximum input rate through the faucet (gallons/minute), and the maximum drain rate (gallons/minute).
Learning Checkpoint
Let's try a couple of simple model calculations to get you thinking about systems dynamics. First, we should establish some volumes and rates for this simple system. The tub (reservoir) will hold 30 gallons of water. The input and output values are outlined below:
1) If the faucet (input) will supply 3 gallons of water per minute, and the drain is closed (no output), how long will it take to fill the tub to the brim with water if the tub is empty to begin with?
ANSWER: The tub will fill in 10 minutes (30 gallon capacity divided by 3 gallons per minute input).
2) If the faucet supplies 3 gallons per minute, the tub is empty to begin with, but the drain allows 3 gallons per minute to leave the tub, how long will it take the tub to fill?
ANSWER: The tub will never fill because it starts empty and input = output!
3) If the faucet supplies 3 gallons per minute, the tub is empty to begin with, and the drain allows 1 gallon per minute to escape, how long will it take to fill the tub?
ANSWER: The tub will fill in 15 minutes (30 gallons capacity divided by (3 gallon/minute input minus 1 gallon per minute output).
Hydrologic Cycle
Hydrologic Cycle
The movement of water between these reservoirs, primarily driven by solar energy influx at the Earth’s surface, is known as the hydrologic cycle.
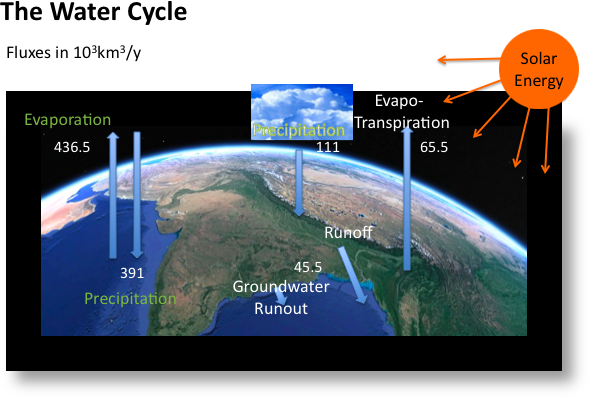
| Component | Fluxes in 103 km3/ year |
|---|---|
| Evaporation | 436.5 |
| Precipitation | 391 |
| Groundwater Runout | 45.5 |
| Evapo-transpiration | 65.5 |
The hydrologic cycle is a conceptual model that describes the fluxes of water between the oceans, surface water bodies (lakes, rivers, and streams), groundwater in subsurface aquifers, the atmosphere, and the biosphere. One important aspect of the cycle is that no water is gained or lost: water moves between reservoirs but the total mass remains the same. Another way to say this is that the water that currently exists on Earth is the same water that has been here since the time the Earth formed. (Technically, there are small fluxes of water from the Earth’s interior to the surface and atmosphere through volcanism and venting, and small influxes of water from comets and debris, but these are negligible in comparison to the mass of water in the primary reservoirs shown above.)
Activate Your Learning
1. There are five processes that control the movement of water between reservoirs in the hydrologic cycle. Looking at Figure 6 above, what do you think they are? Name as many as you can.
ANSWER: The processes include evapo-transpiration, precipitation, runoff, infiltration, and groundwater outflow. Read on for further description.
The movement of water between reservoirs, or the “limbs” of the hydrologic cycle includes five primary processes:
- Evapo-transpiration: the movement of water from oceans or land to the atmosphere, through the combined processes of evaporation and transpiration. Evaporation and transpiration both involve a change in state, from liquid to vapor, which requires an input of energy. Evaporation is simply the change from liquid to vapor as a result of molecular motion, and is affected by temperature and ambient humidity. Transpiration is the movement of water to the atmosphere by plant respiration. In most terrestrial basins, transpiration is the dominant process by which water moves from the Earth’s surface to the atmosphere, whereas over lakes and the oceans, evaporation dominates.
- Precipitation: the movement of water from the atmosphere to the land surface or oceans, in the form of rain, snow, sleet, ice pellets, etc... Precipitation involves a change in state from vapor to liquid, known as condensation. This change in state releases heat energy. After precipitation falls on the land surface, it may flow into surface water bodies (lakes or streams), or percolate through soils and rock into the groundwater system.
- Runoff: the movement of water from the land surface to the oceans in streams or rivers.
- Infiltration: the percolation of water from the land surface or from surface water bodies through soils and into the subsurface. Water that infiltrates becomes part of the groundwater system, and is also known as groundwater recharge.
- Groundwater outflow, also known as subsea outflow: the seepage of water from the groundwater system directly into the oceans. The flux of groundwater outflow is the least constrained component of the hydrologic cycle, and is often estimated by balancing the other fluxes in the cycle.
Because the changes in state that accompany evaporation and precipitation also take in and release energy, the movement of water through the hydrologic cycle is paralleled by redistribution of heat and energy.
Uneven Distribution
Uneven Distribution
Why is water distributed unevenly across the Earth’s surface?
As you probably know, things are far more interesting than a hypothetical case of evenly distributed precipitation! Both precipitation and evaporation vary widely over the Earth’s surface. This unequal distribution of water on the planet drives a diversity in climate and ecosystems (or biomes); water availability for human life, industry, and agriculture; and is fundamentally and intimately tied to the history of politics, economics, food production, population dynamics, and conflict – both in the U.S. and globally.
The abundance of water in some areas and scarcity in others follows systematic and predictable patterns. As part of this module, we’ll explore the physical processes that shape the overall distribution of precipitation - and thus water resources.
Learning Checkpoint
Note: The questions below are not graded. They may show up as summative evaluation questions on mid-term or final exams.
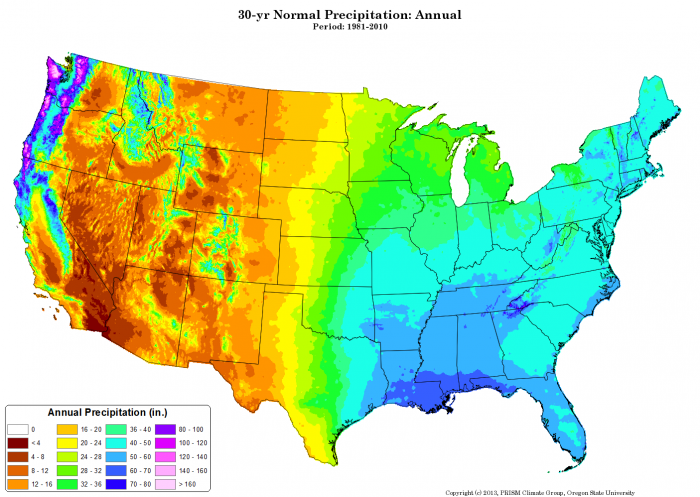
1) Look at Figure 7 above. What is the annual mean precipitation in Southern Nevada?
- 32 in/yr
- greater than 80 in/yr
- 0 in/yr
- 4-8 in/yr
ANSWER: d. 4-8 in/yr
2) Look at Figure 7 above. What is the annual mean precipitation in Coastal Washington State?
- a. 32 in/yr
- greater than 80 in/yr
- 0 in/yr
- 4-8 in/yr
ANSWER: b. greater than 80 in/yr
3) Why do you think Nevada and Eastern Oregon are deserts?
- a. They are far North of the equator.
- They are far from the ocean.
- They are in the rain shadow of mountains.
- They are subject to large annual temperature fluctuations.
- They are at high elevation.
ANSWER: c. They are in the rain shadow of mountains.
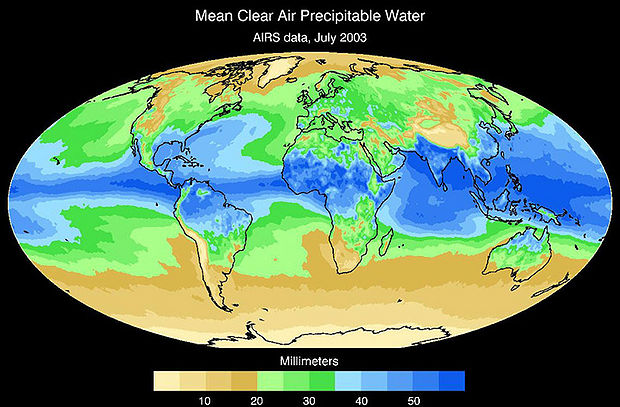
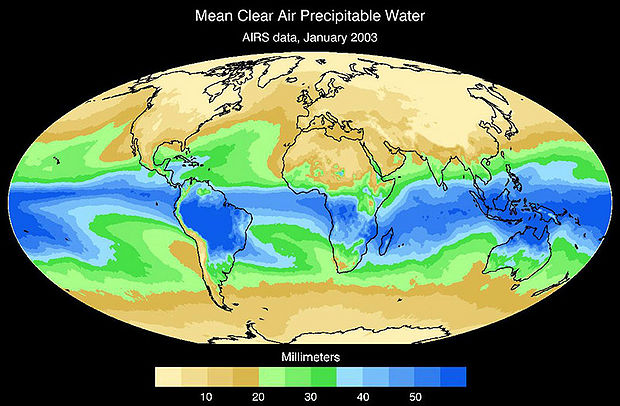
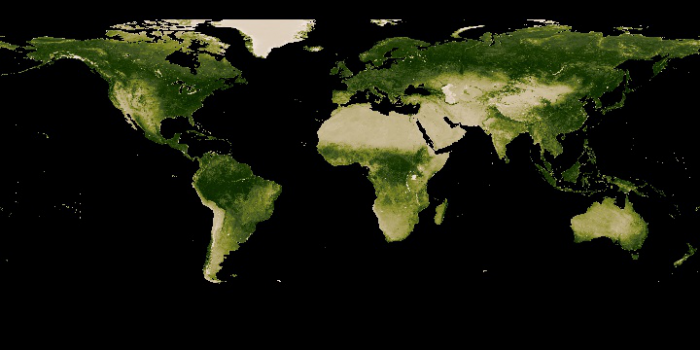
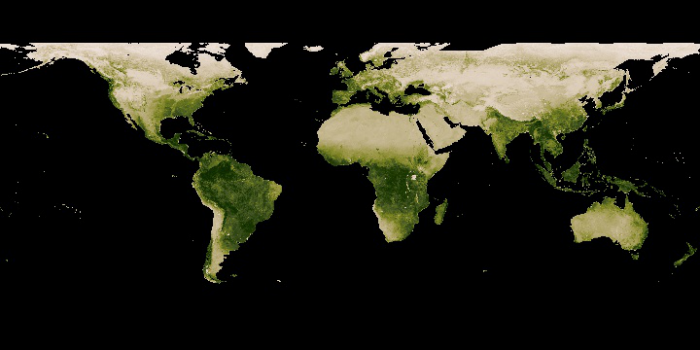
4) Look at Figure 8. What do you think is the global pattern of precipitation?
- a. It rains most South of the equator.
- There is East-West "banding" of climate/precipitation.
- There is North-South "banding" of climate/precipitation.
- There is snow in the Southern Hemisphere year-round.
ANSWER: b. There is East-West "banding" of climate/precipitation.
Note the contrasting patterns in the two images in Figure 8 above, based on global satellite coverage. Vegetation in the southern hemisphere, which has relatively more ocean area (and less land area) than the northern hemisphere, changes little seasonally, whereas vegetation distribution in the northern hemisphere undergoes large changes. Why is that? There are probably two impacts on vegetation distribution—precipitation and temperature. Examine the figure below that illustrates the available moisture seasonally (summer vs. winter) and compare to the distribution of vegetation for the same seasons. Think about the role of temperature, precipitation, and soil moisture (water availability to plants), as well as the availability of sunlight for photosynthesis. Yes, there is a more complex relationship between plant growth and other factors, but the hydrologic cycle plays a major role.