Module 8.2: Cities in Peril: Future Climate Change, Population Growth, and Water Issues
Module 8.2: Cities in Peril: Future Climate Change, Population Growth, and Water Issues
Introduction
As has been discussed throughout this course, the relationship between humans and water resources has a long and complicated history. Water has played a central role in how and where human civilizations have developed. Proximity to high quality, reliable water sources provides a firm foundation for a thriving society. Societies that have established near unreliable or unpredictable water sources that may dry up during droughts and/or flood unexpectedly and uncontrollably) have struggled and occasionally suffered catastrophic losses. In other cases, societies have suffered more chronic problems with water quality. Advances in engineering have greatly improved accessibility and reliability of water resources, to an extent that is difficult to overstate. In some cases, however, a combination of highly effective engineering and risky (or ill-informed) decision-making has created some sketchy and unsustainable situations, as discussed in the first half of this module. What does the future hold? How, when and where might the legacy of our past decisions cause us severe problems in the future? What new problems might we anticipate as a result of climate change and population growth? Will technology save us? Or will more ecosystem-focused planning provide a more resilient water future for humans? How much of Earth’s water should humans feel entitled to? How much should be left for nature? These are some of the questions we’ll address in part 2 of this module.
Goals and Objectives
Goals and Objectives
Goals
- Describe the two-way relationship between water resources and human society
- Thoughtfully evaluate information and policy statements regarding the current and future predicted state of water resources
- Communicate scientific information in terms that can be understood by the general public
- Predict how human interaction with water on Earth is expected to change over the next 50 years
- Interpret graphical representations of scientific data
Learning Objectives
In completing this module, you will:
- Argue one of the many viewpoints on climate change.
- Identify the causes of global warming and climate change over the past ~250 years, including anthropogenic and natural influences.
- Assess whether mathematical models are a sound basis for making policy decisions.
- Evaluate the implications of climate change on future water resources for specific locations in the US.
- Devise a water plan for Phoenix, AZ, projecting forward from 1915
Water Use, Water Stress, and Population Growth
Water Use, Water Stress, and Population Growth
Module 1 discussed the who, how and where of water use throughout the US and the world. In the US and most industrialized countries, the dominant water uses are industry and agriculture. Domestic and municipal water use typically comprises only 15-30% of water use. In developing countries, per capita, water use tends to be lower in general, with a smaller proportion dedicated to industrial use and a larger proportion dedicated to domestic uses (see Module 1, Figures 8 and 9).
It is also useful to remember that we don’t actually see most of the water needed to sustain our daily activities. In the US, average per capita ‘direct’ use of water (domestic or municipal, for watering your yard, taking a shower, flushing the toilet, etc.) is 156 gallons per day, but the per capita ‘indirect’ use of water (including water used for energy production, manufacturing, food production, etc.) is 1230 gallons per day. So we really only ever see about 12% of the water that is used to sustain our quality of life. This ‘invisibility’ (as Charles Fishman refers to it in “The Big Thirst”) of our dependency on clean, reliable water is one of the challenges in planning for the future. Often we’re not even aware of what we stand to lose!
Population growth was also discussed in module 1. The population is expected to grow by nearly a third of what it is today, to around 9.6 billion by 2050. For an engaging look at population increase in real-time, see the US Census Bureau Population Clock [1]. It is all the more concerning that some of the most rapid population growth in the world (India and Africa) is expected to occur in places that are already experiencing water stress. Add to this the legacies of past policies and infrastructure as well as future projections of climate change and it seems that we have a lot of work and planning to do!
Climate Change
Climate Change
What do and don’t we know about climate change?
Global warming and climate change: Both of these phrases have been used, often interchangeably, to discuss what is currently happening to our climate system. The term ‘global warming’ was coined by a Columbia University geochemist and climatologist by the name of Wallace ‘Wally’ Broecker in a 1975 Science article entitled “Climatic Change: Are we on the brink of a pronounced global warming?” Global warming, in the strict definition, refers to the observation that Earth’s average surface temperature is rising due to increased levels of greenhouse gases. The term ‘climate change’ includes global warming, but also considers the myriad other changes to Earth’s climate system that are caused by rising temperatures, including changes in precipitation and evaporation, movement of air currents (be they frontal systems or convective systems, hurricanes or a polar vortex), etc..
There is virtually no disagreement among climate scientists that both global warming and climate change are happening and is primarily due to human emissions of greenhouse gases. Broad agreement on these points among the science community is not because scientists tend to be an agreeable group. To the contrary, scientists are typically quite quick to disagree with one another and discuss their disagreements ad nauseam, in great detail and based on all available evidence, from empirical observations or theoretical physics and chemistry. Scientists also have large incentives to prove one another wrong. If, for example, a scientist was able to provide compelling evidence that increased greenhouse gases are not causing a systematic change in Earth’s climate system (or that evolution is not the driver of biodiversity, or that the Earth is not 4.6 billion years old), he or she would be famous as the likes of Galileo, Darwin or Einstein (all of whom toppled earlier scientific understanding), their work would be well funded (we would consequently have a lot of new questions that would need to be answered!), their book would be a best-seller, they would probably pick up a Nobel Prize and most notably, they would be interviewed by all of the most reputable talk show hosts. But no scientist has made such a compelling case. To the contrary, the case for significant climate change is compelling in both the empirical observations as well as the theoretical predictions. Those who proffer the opinion that climate change is not happening or is a hoax presumably do so out of sheer ignorance and/or because they have a financial incentive to believe (or to have others believe) that to be the case.
Distinct from the question of whether or not climate change is occurring, many questions remain regarding the effects of climate change on societies and economies. Certainly, there are positive effects. Warmer temperatures and increased carbon dioxide levels mean increased plant and crop productivity. Some places are expected to receive increased amounts of precipitation, potentially relieving water stress (though perhaps also increasing flood risk). Other places will most certainly not be so lucky and generally speaking, the risks and expected losses associated with climate change are expected to far outweigh the benefits. A comprehensive review of climate science and climate change is not possible within the scope of this course, but we will review a few of the key points as they relate to water, science, and society. We refer students to the most recent reports from the Intergovernmental Panel on Climate Change for more detailed and updated information.
Who Does Climate Science?
Who Does Climate Science?
Just about anyone could do climate science. Agencies, particularly in the US and Europe, have made an immense amount of weather and climate data available and with a modest amount of training and software anyone could perform rudimentary analyses of temperature or precipitation trends (e.g., see ncdc.noaa.gov or weather.gov or prism.oregonstate.edu). Of course, such analyses don’t answer all the questions. Tens of thousands of highly trained, independent scientists around the world collect and analyze climate data and develop models of global or regional climate change, which are typically tested using historical data and projected into the future. To provide a forum for discussion and debate that could be synthesized to represent our best understanding of climate change, the United Nations Environment Program (UNEP) and the World Meteorological Organization (WMO) established the Intergovernmental Panel on Climate Change (IPCC) in 1988. Thousands of scientists contribute data, analyses, and model results to the IPCC and provide critical peer review of any climate-related research, all on a volunteer basis. Five major assessment reports have been generated by IPCC, with the most recent report released in 2014.
What is Causing Global Warming?
What is Causing Global Warming?
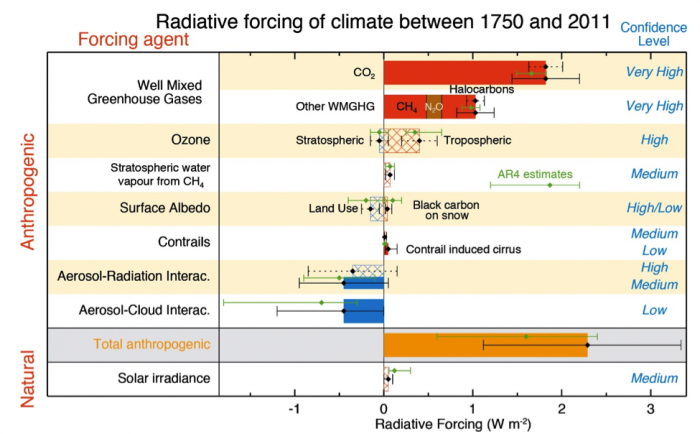
While it is not our intent in this module to explore this question in detail, it is worth pointing out that many human activities clearly affect the climate system. Most notably, emissions of greenhouse gases, especially carbon dioxide and methane, are causing more heat to be trapped within Earth’s atmosphere. This effect, called the greenhouse effect, has been well understood since it was discovered by Svante Arrhenius in 1896. Figure 1 below, taken from the 2014 IPCC Working Group 1 Technical Summary shows the relative amount of heating or cooling of the climate system that can be attributed to the various factors that have changed between 1750 and 2011. Solar irradiance (bottom) is the one natural factor that has changed measurably (if only slightly), contributing a small amount to warming. The anthropogenic modifications to the climate system, enumerated in the top 7 rows of the figure, and summed in the either (gold) bar of the figure, greatly outweigh the changes due to natural changes in solar irradiance. The IPCC is quite careful to note the level of confidence associated with any given piece of knowledge (see confidence levels indicated on the right side of figure 1). They are also transparent and are quick to point out when new understanding has significantly changed estimates or predictions, as has happened with our understanding of stratospheric water vapor, which was thought to be a significant contributor to warming in the Fourth IPCC Assessment Report (AR4, released in 2007), but has recently been found to be less significant.
Learning Checkpoint
According to Figure 1 above, total warming (i.e., positive radiative forcing) caused by human activities between 1750 and 2011 is equivalent to about:
(a) 0 W/m2
(b) 1 W/m2
(c) 2 W/m2
(d) 3 W/m2
(e)This cannot be determined from the graph.
ANSWER: (c) 2 W/m2
According to Figure 1, total warming (i.e., positive radiative forcing) caused by natural processes between 1750 and 2011 is equivalent to about:
(a) 0 W/m2
(b) 1 W/m2
(c) 2 W/m2
((d) 3 W/m2
(e)This cannot be determined from the graph.
ANSWER: (a) 0 W/m2
According to Figure 1, total warming (i.e., positive radiative forcing) caused by natural processes between 1750 and 2011 is equivalent to about:
According to Figure 1, the single biggest anthropogenic contributor to global warming is:
(a) Greenhouse gas emissions
(b) Changes in surface albedo
(c) Aerosol emissions
(d) Tropospheric ozone emissions
ANSWER: (a) Greenhouse gas emissions
According to Figure 1, the biggest anthropogenic contributor to global cooling is:
(a) Greenhouse gas emissions
(b) Changes in surface albedo
(c) Aerosol emissions
(d) Tropospheric ozone emissions
ANSWER: (c) Aerosol emissions
What Are the Implications of Global Warming for Precipitation and Water Availability?
What Are the Implications of Global Warming for Precipitation and Water Availability?
So what does all this human-induced warming mean for the water cycle and water availability? Thinking back to module 2, you learned that warmer air can hold more water (i.e., warmer air has a higher saturation vapor pressure). Therefore it is reasonable to expect higher amounts of water vapor in the air. This is supported by observations that show a 3.5% increase in water vapor in the past 40 years as the climate has warmed about 0.5°C, with relative humidity remaining approximately constant.
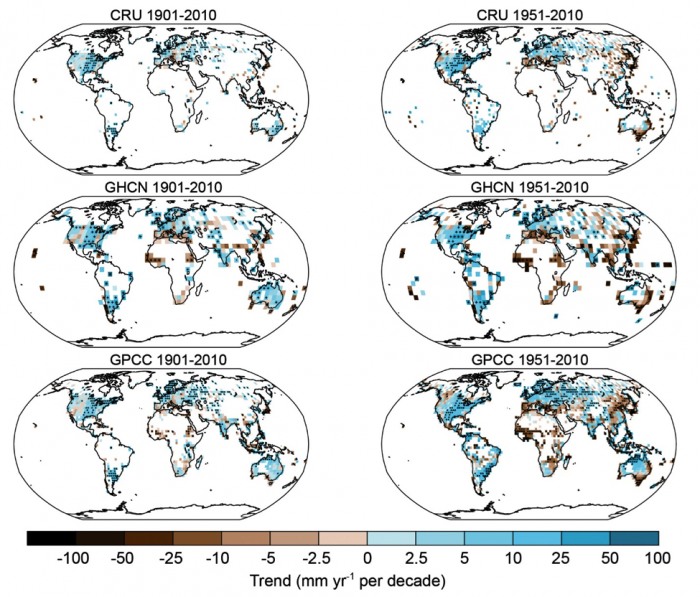
Changes in precipitation are harder to measure (or predict) compared with changes in atmospheric water vapor content because of the immense temporal and spatial variability of precipitation. Nevertheless, patterns of precipitation change can readily be observed from historical records (Figure 2), with many areas seeing increases greater than 25 mm/year per decade (i.e., going from 300 mm/yr to 325 mm/yr over the course of a decade) and other places (particularly Africa and Southeast Asia) seeing decreases in precipitation at rates greater than 10 to 25 mm/year per decade. With increasing temperatures, it naturally follows that a greater proportion of precipitation would fall as rain, rather than snow, which has also been documented by the IPCC.
Learning Checkpoint
According to Figure 2, all three models indicate that, on average, precipitation throughout the conterminous US has ___________ from 1901 to 2010 (see left column of maps).
(a) increased
(b) decreased
(c) remained about the same
ANSWER: (a) increased
According to Figure 2, all three models indicate that, on average, precipitation throughout the conterminous US has ___________ from 1951 to 2010 (see right column of maps).
(a) increased
(b) decreased
(c) remained about the same
ANSWER: (a) increased. Note that the rate of increasing precipitation has gone up compared to the time period from 1901-2010.
Historical Precipitation Records and Climate Models
Historical Precipitation Records and Climate Models
What can the historical precipitation records and climate models tell us about the future?
But what can the historical precipitation records and climate models tell us about the future? Simulating future changes in precipitation patterns is one of the most difficult elements of climate modeling because precipitation and evaporation (there are feedbacks between the two so you have to model both) are driven by complex, non-linear processes. So climate models do not attempt to predict detailed representations of precipitation for any given location and climate models are generally not capable of predicting changes in precipitation intensity or frequency of extreme events, other than the likely sign (+ or -) of expected change. Nevertheless, all global climate models attempt to capture general trends in precipitation and considerable agreement exists among all the many competing models. In the broadest perspective, the IPCC makes the following important projections:
“Changes in the global water cycle in response to the warming over the 21st century will not be uniform. The contrast in precipitation between wet and dry regions and between wet and dry seasons will increase, although there may be regional exceptions.”
“Extreme precipitation events over most of the mid-latitude land masses and over wet tropical regions will very likely become more intense and more frequent by the end of this century, as global mean surface temperature increases (see Table SPM.1).”
“Globally, it is likely that the area encompassed by monsoon systems will increase over the 21st century. While monsoon winds are likely to weaken, monsoon precipitation is likely to intensify due to the increase in atmospheric moisture. Monsoon onset dates are likely to become earlier or not to change much. Monsoon retreat dates will likely be delayed, resulting in lengthening of the monsoon season in many regions.”
“There is high confidence that the El Niño-Southern Oscillation (ENSO) will remain the dominant mode of inter-annual variability in the tropical Pacific, with global effects in the 21st century. Due to the increase in moisture availability, ENSO related precipitation variability on regional scales will likely intensify. Natural variations of the amplitude and spatial pattern of ENSO are large and thus confidence in any specific projected change in ENSO and related regional phenomena for the 21st century remains low.”
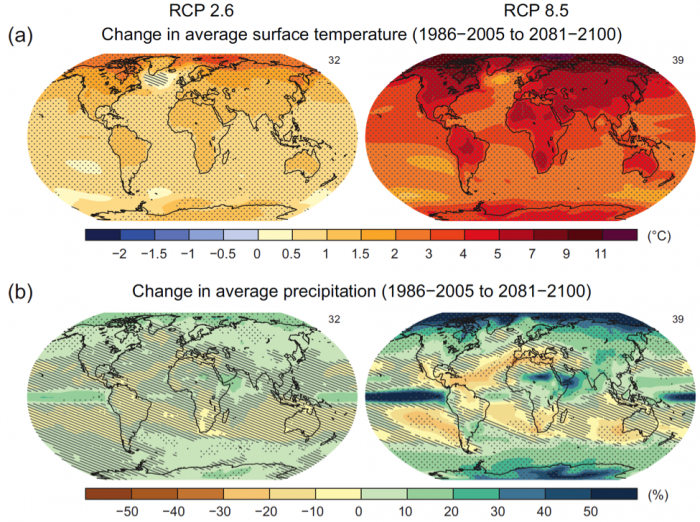
Figure 3 shows the average temperature and precipitation results of many different competing models for two different scenarios, comparing observations in 1986-2005 to the projected time period 2081-2100. The number of competing models used is shown in the top right of each panel (32 or 39). The two scenarios, called ‘Representative Concentration Pathways’ (RCPs) 2.6 and 8.5 are the two end-members of greenhouse gas emissions, with RCP 2.6 assuming that greenhouse gas emissions peak in 2010-2020 time period and decrease aggressively thereafter and RCP 8.5 assuming that greenhouse gas emissions increase throughout the 21st century. Notice that the warming (top plots) is not uniform throughout the world. The higher latitudes, especially in the northern hemisphere are expected to heat up considerably more than the temperate or tropical latitudes. We often hear numbers of the global average increase in temperature (estimated 1-2°C or 2-3.5°F by 2050), but this average value does not represent what is expected to happen at high latitudes. A 3-4°C (5-7°F) increase in the arctic, as indicated by RCP 2.6, represents a dramatic transformation of this ecosystem. A 10-12°C (18-21°F) increase in the arctic, as indicated by RCP 8.5, would represent a complete transformation of this ecosystem. What do you think would be the potential benefits and damages caused by such a transformation?
Changes in precipitation are also not expected to be uniform. In general, increases or decreases in precipitation are expected to be more drastic in the high greenhouse gas emission scenario (RCP 8.5) with some areas receiving 30-40% changes relative to 1986-2005. What ecosystem, economic or social changes might you expect to see as a result of a 30-40% increase or decrease in precipitation in the arctic? In Spain? In South Africa? In Chile?
Click for a text description
Projected Changes
Projected Changes
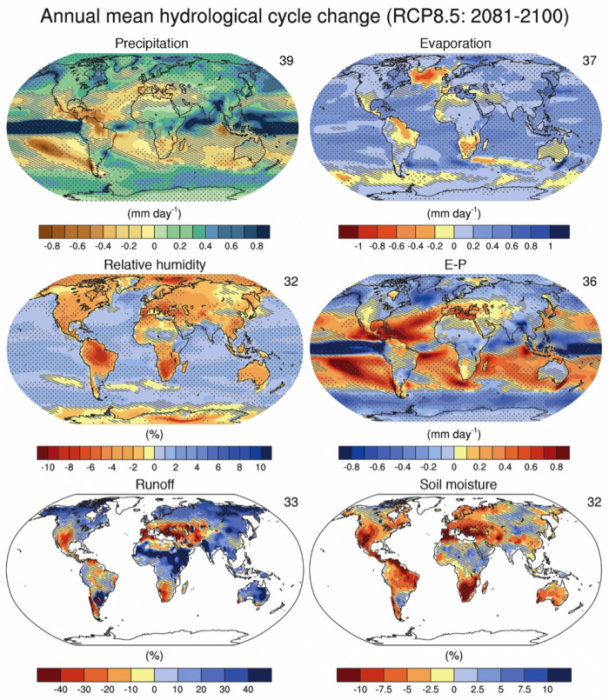
Figure 4 illustrates projected changes in other parts of the hydrological cycle during the time period 2081-2100 relative to 1986-2005 according to the high greenhouse gas emissions scenario (RCP 8.5). Note that the number of competing climate models represented for each panel of the figure is indicated by a number in the top right (range: 32-39 different models are averaged for each prediction). Future projections of water runoff or soil moisture are dependent on precipitation, which, as discussed earlier, is itself subject to substantial uncertainties. Nevertheless, it is worth considering what the variety of competing climate models have to say. For example, note the general (if slight) decrease in relative humidity over most land masses and a slight increase in relative humidity over the oceans (middle panel, left column). The middle panel in the right column shows changes in the difference between evaporation and precipitation with blue colors indicating a relatively wetter future (more precipitation relative to evaporation) and red colors indicating a relatively drier future (more evaporation than precipitation). The bottom panel in the left column predicts changes in surface water runoff. Note the significant declines in runoff throughout the southwestern US and southern Europe/northern Africa and parts of South America. This same trend is amplified in predictions of soil moisture, which is a primary control on plant growth (bottom panel, right column).
Click to expand a text description
All Water Problems Are Local
All Water Problems Are Local
It is useful to know how climate change is likely to impact the water cycle at the global scale and IPCC reports represent our best understanding of those impacts over the next few decades to a century. But as we have discussed elsewhere, all water problems are local. In very few situations is it even feasible, let alone prudent, to transfer water long distances. Every place has its own set of challenges, institutional and infrastructure legacies, financial or other resource constraints, and concepts of social acceptability.
Generally speaking, places currently experiencing water stress or expecting to experience water stress in the foreseeable future have only a few basic options: a) have fewer people, b) force/incentivize people to use less water, c) increase storage and/or minimize losses within the system, d) reuse water, or e) get water from elsewhere. The capacity to cope with water stress (short or long-term) generally increases with wealth, though in wealthier countries more infrastructure is potentially at risk. As major population centers have already begun to struggle with water shortages it has become clear that massive investments in water technology and security infrastructure can allow wealthy nations to offset higher levels of water stress without remedying their underlying causes. Less wealthy nations, on the other hand, remain vulnerable and have fewer options in water development.
Salt Lake City
Salt Lake City
Salt Lake City: A case study in water development history and planning for the future
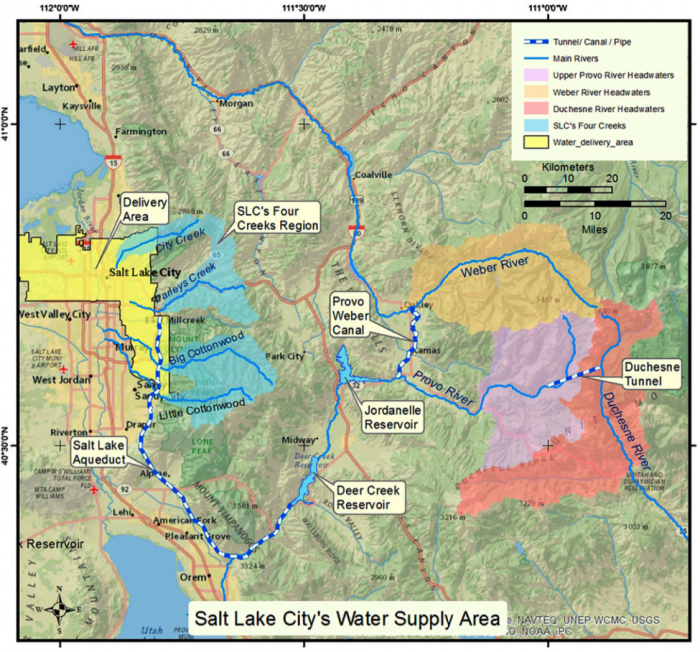
Salt Lake City (SLC) provides an interesting case study in terms of the history and future of water resource development. The first permanent settlers of Salt Lake Valley arrived in 1847 and immediately began diverting water from City Creek (northernmost of the four watersheds highlighted in blue in Figure 5). It is estimated that the early settlers hand-dug 1000 miles of ditches in the first few decades to distribute the water to agricultural fields, Salt Lake City and nearby settlements. By 1879 the population of Salt Lake County had grown to nearly 32,000 and the city authorized construction of the Jordan and Salt Lake City Canal, which was completed in 1882 with a capacity of 150 cubic feet per second, expected to provide enough water for 100,000 residents. The canal is still in use today. Several major dams were constructed as early as 1892 to 1907. Following a major water shortage in 1924, Mayor John Bowman proclaimed that ‘a city can never be greater than its water supply’ and initiated an ambitious water development program to supply reliable water for more than 400,000 residents. Several other large dams were constructed from the 1940s to as late as the 1990s to keep ahead of the rapidly growing population, but options for additional water storage via new reservoirs are now very limited.
Today Salt Lake City’s water supply is derived from several mountainous watersheds to the east of the city, in the Wasatch Front and western Uinta Mountains (Figure 5). About 50-60% of the water is derived from the four creeks just to the east of SLC (highlighted in blue), with the remaining portion delivered from the Weber, Provo, and Duchesne rivers via inter-basin transfers (tunnels, canals, and aqueducts shown as blue and white dashed lines in Figure 5) and extracted from groundwater. Around 70-80% of Salt Lake City’s water supply originates as snowmelt. Thus, the storage of water as snowpack, the timing of snowmelt, and water storage capacity within the system are all critical to ensuring reliable water supply.
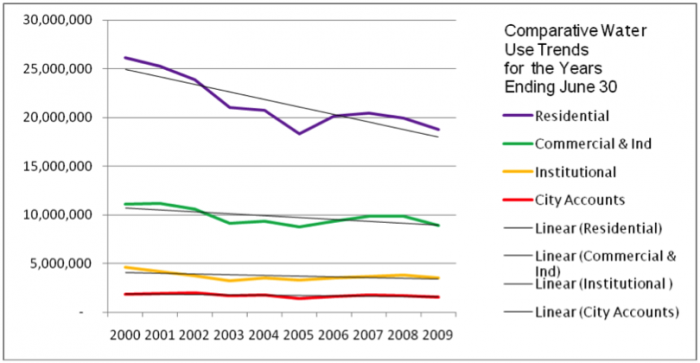
Public utilities water use has remained relatively steady at 80,000 acre-feet of water per year since 1980. To put that number in perspective, imagine a tank of water an acre at its base and 80,000 feet (15 miles) tall, or the equivalent of a tank the size of Central Park in New York City flooded 100 feet deep. The fact that total public water use has remained steady over the past three decades is an impressive feat considering the population of Salt Lake County has nearly doubled from 620,000 in 1980 to nearly 1.1 million in 2014. Much of the Greater SLC area is populated by members of the Mormon religion, which has traditionally emphasized large families. More recently the size of families has decreased, but the population as a whole continues to grow.
Despite a growing population, total water use has started to decline in the past decade despite the fact that this time period includes three of the hottest summers on record, due to effective public education and water conservation campaigns (Figure 6).
Climate Change Further Complicates the Water Situation
Climate Change Further Complicates the Water Situation
Climate change further complicates Salt Lake City’s water situation. Peak supply from the four creeks typically occurs in early June and is expected to shift earlier in the year, to mid-May, in the coming decades. However, peak water demand typically does not occur until late July or early August. Hence the need for significant amounts of water storage. Temperature increases over the past few decades have already resulted in more winter precipitation falling as rain, rather than snow, thus reducing snowpack. The increased proportion of precipitation falling as snow, combined with an earlier snowmelt threaten the system’s ability to maintain adequate water supply through late summer. The total amount of water runoff is also expected to decrease as the climate warms. Every degree Fahrenheit of warming in the Salt Lake City region could mean a 1.8 to 6.5% drop in the annual flow of rivers that provide the city’s water supply. The semi-arid region is also known to experience frequent and sometimes prolonged drought. With a growing disparity in the timing and potentially the volume of water supply/demand, clearly, some changes are needed. Options currently being considered are further reductions in demand, additional water storage within the system, or extraction of groundwater.
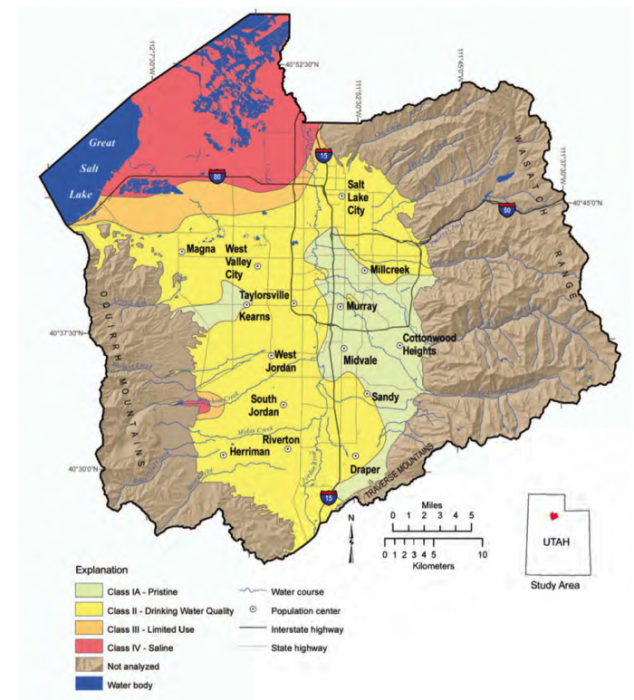
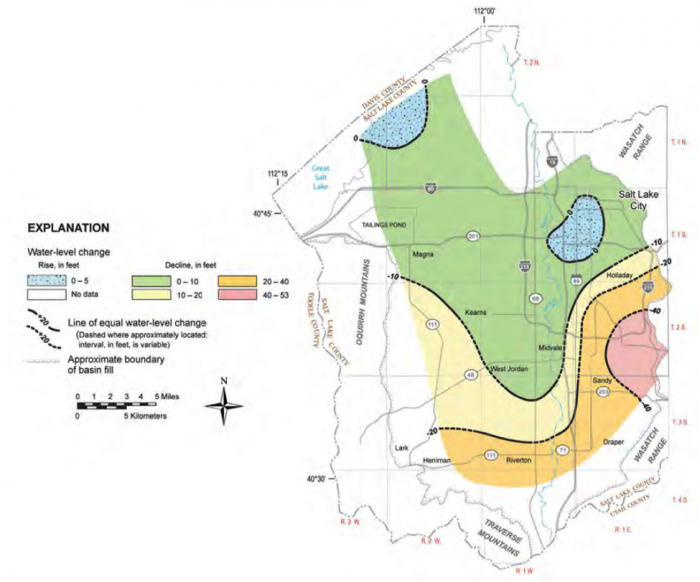
Unfortunately, groundwater reserves are not in great shape. The shallow, unconfined aquifer underlying much of the valley is contaminated from uranium mine leachate, chloride, sulfate, iron, uranium, volatile organic compounds, and pesticides. Recent water quality testing from the shallow, unconfined aquifer found all samples to be below acceptable standards for drinking water. There is a deeper, confined aquifer that is in much better shape, with more than 80% of water meeting or exceeding water quality standards. However, excessive pumping of this aquifer has drawn down the water level by as much as 30-50 feet in places, from 1975 to 2005.
With the Great Salt Lake immediately adjacent to the city it might seem like desalination might be an option. Desalination, also called desalinization, is the process of removal of salt and other minerals to produce fresh water for consumption or irrigation. This is most commonly achieved by boiling water in a process called vacuum distillation or a process called reverse osmosis in which water is forced through a permeable membrane that strips out the salts. Either approach requires a considerable amount of energy and is therefore typically more expensive than most any other alternative. Considering that the Great Salt Lake is 3-8 times more saline than the ocean, this solution is currently not economically feasible to do on a large scale, though some desalination is currently done to treat partially saline groundwater.
People are, of course, not the only organisms that require access to clean and reliable freshwater. More than 75% of the wetlands in the state of Utah are found in Salt Lake Valley, which contains a wide variety of plant species, play an important role in regulating water quality, and provide habitat for a variety of birds, amphibians, and other animals. In addition, several threatened and endangered fish and bird species are dependent on the perennial flowing streams and rivers in the area. Water-stressed trees within the urban forest of the Greater SLC area have become more susceptible to disease. Lower precipitation in the mountains has increased the number and severity of wildfires.
Led by Mayor Ralph Becker, Salt Lake City has taken a proactive stance to adapt water resource management practices and mitigate the effects of climate change. Mitigation involves reducing the magnitude of the problem itself, whereas adaptation involves limiting one’s vulnerability to expected impacts. As part of the Water Conservation Master Plan, the city is attacking the problem from multiple angles. As a preventative measure, the city is purchasing and protecting large tracts of land in the watersheds that provide drinking water. SLC is also incorporating future climate scenarios into city and water development planning efforts, which is quite progressive for a state whose legislature passed a resolution in 2010 proclaiming that climate change was essentially a hoax.
The city is also attempting to bolster local resilience and reduce dependency on external sources of food, recently having passed several ordinances that promote local food production and community gardens. Also, the city is developing a water re-use program to provide water for city parks, golf courses, and the urban forest.
Recognizing that energy demand is a large and growing water use sector, the city is providing incentives for individuals and businesses to minimize the use of all forms of energy and invest in energy-efficient upgrades. Incentives are also in place for the use of solar energy (photovoltaic cells) and solar hot water heaters. The city has promoted net-zero building approaches (meaning that the amount of energy used by the building on an annual basis is roughly equal to the amount of renewable energy created on-site). And they have been willing to put their money where their mouth is…SLC’s Public Safety Building, completed in July 2013, is the first public safety building in the nation to be designed as a net-zero building and one of the first to meet the US Green Building Council’s LEED Platinum certification criteria. Climate change scenarios are being considered in many aspects of infrastructure planning, including building roads and sewers to handle higher runoff volumes and warmer temperatures. In recognition of the progressive direction, he has taken Salt Lake City Mayor Becker was appointed to President Obama’s climate adaptation task force in November 2013.