Climate Change
Climate Change
What do and don’t we know about climate change?
Global warming and climate change: Both of these phrases have been used, often interchangeably, to discuss what is currently happening to our climate system. The term ‘global warming’ was coined by a Columbia University geochemist and climatologist by the name of Wallace ‘Wally’ Broecker in a 1975 Science article entitled “Climatic Change: Are we on the brink of a pronounced global warming?” Global warming, in the strict definition, refers to the observation that Earth’s average surface temperature is rising due to increased levels of greenhouse gases. The term ‘climate change’ includes global warming, but also considers the myriad other changes to Earth’s climate system that are caused by rising temperatures, including changes in precipitation and evaporation, movement of air currents (be they frontal systems or convective systems, hurricanes or a polar vortex), etc..
There is virtually no disagreement among climate scientists that both global warming and climate change are happening and is primarily due to human emissions of greenhouse gases. Broad agreement on these points among the science community is not because scientists tend to be an agreeable group. To the contrary, scientists are typically quite quick to disagree with one another and discuss their disagreements ad nauseam, in great detail and based on all available evidence, from empirical observations or theoretical physics and chemistry. Scientists also have large incentives to prove one another wrong. If, for example, a scientist was able to provide compelling evidence that increased greenhouse gases are not causing a systematic change in Earth’s climate system (or that evolution is not the driver of biodiversity, or that the Earth is not 4.6 billion years old), he or she would be famous as the likes of Galileo, Darwin or Einstein (all of whom toppled earlier scientific understanding), their work would be well funded (we would consequently have a lot of new questions that would need to be answered!), their book would be a best-seller, they would probably pick up a Nobel Prize and most notably, they would be interviewed by all of the most reputable talk show hosts. But no scientist has made such a compelling case. To the contrary, the case for significant climate change is compelling in both the empirical observations as well as the theoretical predictions. Those who proffer the opinion that climate change is not happening or is a hoax presumably do so out of sheer ignorance and/or because they have a financial incentive to believe (or to have others believe) that to be the case.
Distinct from the question of whether or not climate change is occurring, many questions remain regarding the effects of climate change on societies and economies. Certainly, there are positive effects. Warmer temperatures and increased carbon dioxide levels mean increased plant and crop productivity. Some places are expected to receive increased amounts of precipitation, potentially relieving water stress (though perhaps also increasing flood risk). Other places will most certainly not be so lucky and generally speaking, the risks and expected losses associated with climate change are expected to far outweigh the benefits. A comprehensive review of climate science and climate change is not possible within the scope of this course, but we will review a few of the key points as they relate to water, science, and society. We refer students to the most recent reports from the Intergovernmental Panel on Climate Change for more detailed and updated information.
Who Does Climate Science?
Who Does Climate Science?
Just about anyone could do climate science. Agencies, particularly in the US and Europe, have made an immense amount of weather and climate data available and with a modest amount of training and software anyone could perform rudimentary analyses of temperature or precipitation trends (e.g., see ncdc.noaa.gov or weather.gov or prism.oregonstate.edu). Of course, such analyses don’t answer all the questions. Tens of thousands of highly trained, independent scientists around the world collect and analyze climate data and develop models of global or regional climate change, which are typically tested using historical data and projected into the future. To provide a forum for discussion and debate that could be synthesized to represent our best understanding of climate change, the United Nations Environment Program (UNEP) and the World Meteorological Organization (WMO) established the Intergovernmental Panel on Climate Change (IPCC) in 1988. Thousands of scientists contribute data, analyses, and model results to the IPCC and provide critical peer review of any climate-related research, all on a volunteer basis. Five major assessment reports have been generated by IPCC, with the most recent report released in 2014.
What is Causing Global Warming?
What is Causing Global Warming?
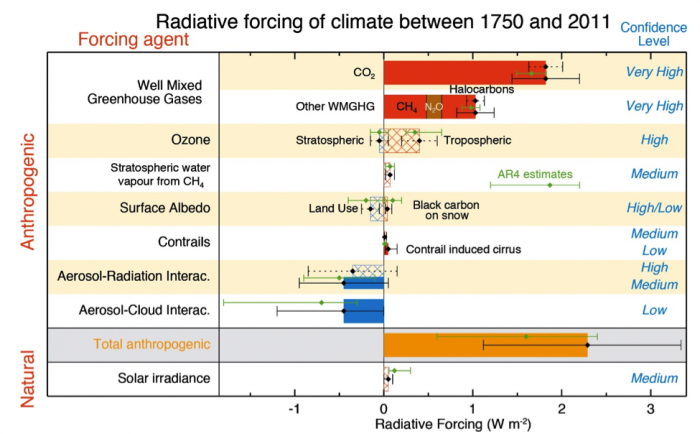
While it is not our intent in this module to explore this question in detail, it is worth pointing out that many human activities clearly affect the climate system. Most notably, emissions of greenhouse gases, especially carbon dioxide and methane, are causing more heat to be trapped within Earth’s atmosphere. This effect, called the greenhouse effect, has been well understood since it was discovered by Svante Arrhenius in 1896. Figure 1 below, taken from the 2014 IPCC Working Group 1 Technical Summary shows the relative amount of heating or cooling of the climate system that can be attributed to the various factors that have changed between 1750 and 2011. Solar irradiance (bottom) is the one natural factor that has changed measurably (if only slightly), contributing a small amount to warming. The anthropogenic modifications to the climate system, enumerated in the top 7 rows of the figure, and summed in the either (gold) bar of the figure, greatly outweigh the changes due to natural changes in solar irradiance. The IPCC is quite careful to note the level of confidence associated with any given piece of knowledge (see confidence levels indicated on the right side of figure 1). They are also transparent and are quick to point out when new understanding has significantly changed estimates or predictions, as has happened with our understanding of stratospheric water vapor, which was thought to be a significant contributor to warming in the Fourth IPCC Assessment Report (AR4, released in 2007), but has recently been found to be less significant.
Learning Checkpoint
According to Figure 1 above, total warming (i.e., positive radiative forcing) caused by human activities between 1750 and 2011 is equivalent to about:
(a) 0 W/m2
(b) 1 W/m2
(c) 2 W/m2
(d) 3 W/m2
(e)This cannot be determined from the graph.
ANSWER: (c) 2 W/m2
According to Figure 1, total warming (i.e., positive radiative forcing) caused by natural processes between 1750 and 2011 is equivalent to about:
(a) 0 W/m2
(b) 1 W/m2
(c) 2 W/m2
((d) 3 W/m2
(e)This cannot be determined from the graph.
ANSWER: (a) 0 W/m2
According to Figure 1, total warming (i.e., positive radiative forcing) caused by natural processes between 1750 and 2011 is equivalent to about:
According to Figure 1, the single biggest anthropogenic contributor to global warming is:
(a) Greenhouse gas emissions
(b) Changes in surface albedo
(c) Aerosol emissions
(d) Tropospheric ozone emissions
ANSWER: (a) Greenhouse gas emissions
According to Figure 1, the biggest anthropogenic contributor to global cooling is:
(a) Greenhouse gas emissions
(b) Changes in surface albedo
(c) Aerosol emissions
(d) Tropospheric ozone emissions
ANSWER: (c) Aerosol emissions
What Are the Implications of Global Warming for Precipitation and Water Availability?
What Are the Implications of Global Warming for Precipitation and Water Availability?
So what does all this human-induced warming mean for the water cycle and water availability? Thinking back to module 2, you learned that warmer air can hold more water (i.e., warmer air has a higher saturation vapor pressure). Therefore it is reasonable to expect higher amounts of water vapor in the air. This is supported by observations that show a 3.5% increase in water vapor in the past 40 years as the climate has warmed about 0.5°C, with relative humidity remaining approximately constant.
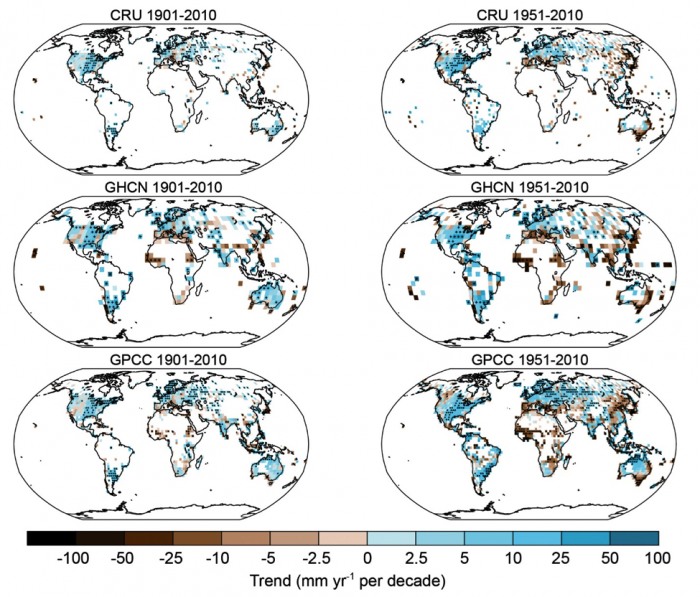
Changes in precipitation are harder to measure (or predict) compared with changes in atmospheric water vapor content because of the immense temporal and spatial variability of precipitation. Nevertheless, patterns of precipitation change can readily be observed from historical records (Figure 2), with many areas seeing increases greater than 25 mm/year per decade (i.e., going from 300 mm/yr to 325 mm/yr over the course of a decade) and other places (particularly Africa and Southeast Asia) seeing decreases in precipitation at rates greater than 10 to 25 mm/year per decade. With increasing temperatures, it naturally follows that a greater proportion of precipitation would fall as rain, rather than snow, which has also been documented by the IPCC.
Learning Checkpoint
According to Figure 2, all three models indicate that, on average, precipitation throughout the conterminous US has ___________ from 1901 to 2010 (see left column of maps).
(a) increased
(b) decreased
(c) remained about the same
ANSWER: (a) increased
According to Figure 2, all three models indicate that, on average, precipitation throughout the conterminous US has ___________ from 1951 to 2010 (see right column of maps).
(a) increased
(b) decreased
(c) remained about the same
ANSWER: (a) increased. Note that the rate of increasing precipitation has gone up compared to the time period from 1901-2010.
Historical Precipitation Records and Climate Models
Historical Precipitation Records and Climate Models
What can the historical precipitation records and climate models tell us about the future?
But what can the historical precipitation records and climate models tell us about the future? Simulating future changes in precipitation patterns is one of the most difficult elements of climate modeling because precipitation and evaporation (there are feedbacks between the two so you have to model both) are driven by complex, non-linear processes. So climate models do not attempt to predict detailed representations of precipitation for any given location and climate models are generally not capable of predicting changes in precipitation intensity or frequency of extreme events, other than the likely sign (+ or -) of expected change. Nevertheless, all global climate models attempt to capture general trends in precipitation and considerable agreement exists among all the many competing models. In the broadest perspective, the IPCC makes the following important projections:
“Changes in the global water cycle in response to the warming over the 21st century will not be uniform. The contrast in precipitation between wet and dry regions and between wet and dry seasons will increase, although there may be regional exceptions.”
“Extreme precipitation events over most of the mid-latitude land masses and over wet tropical regions will very likely become more intense and more frequent by the end of this century, as global mean surface temperature increases (see Table SPM.1).”
“Globally, it is likely that the area encompassed by monsoon systems will increase over the 21st century. While monsoon winds are likely to weaken, monsoon precipitation is likely to intensify due to the increase in atmospheric moisture. Monsoon onset dates are likely to become earlier or not to change much. Monsoon retreat dates will likely be delayed, resulting in lengthening of the monsoon season in many regions.”
“There is high confidence that the El Niño-Southern Oscillation (ENSO) will remain the dominant mode of inter-annual variability in the tropical Pacific, with global effects in the 21st century. Due to the increase in moisture availability, ENSO related precipitation variability on regional scales will likely intensify. Natural variations of the amplitude and spatial pattern of ENSO are large and thus confidence in any specific projected change in ENSO and related regional phenomena for the 21st century remains low.”
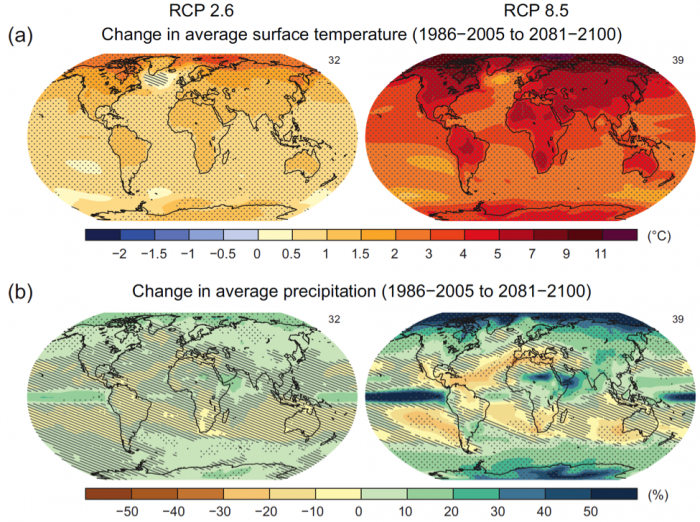
Figure 3 shows the average temperature and precipitation results of many different competing models for two different scenarios, comparing observations in 1986-2005 to the projected time period 2081-2100. The number of competing models used is shown in the top right of each panel (32 or 39). The two scenarios, called ‘Representative Concentration Pathways’ (RCPs) 2.6 and 8.5 are the two end-members of greenhouse gas emissions, with RCP 2.6 assuming that greenhouse gas emissions peak in 2010-2020 time period and decrease aggressively thereafter and RCP 8.5 assuming that greenhouse gas emissions increase throughout the 21st century. Notice that the warming (top plots) is not uniform throughout the world. The higher latitudes, especially in the northern hemisphere are expected to heat up considerably more than the temperate or tropical latitudes. We often hear numbers of the global average increase in temperature (estimated 1-2°C or 2-3.5°F by 2050), but this average value does not represent what is expected to happen at high latitudes. A 3-4°C (5-7°F) increase in the arctic, as indicated by RCP 2.6, represents a dramatic transformation of this ecosystem. A 10-12°C (18-21°F) increase in the arctic, as indicated by RCP 8.5, would represent a complete transformation of this ecosystem. What do you think would be the potential benefits and damages caused by such a transformation?
Changes in precipitation are also not expected to be uniform. In general, increases or decreases in precipitation are expected to be more drastic in the high greenhouse gas emission scenario (RCP 8.5) with some areas receiving 30-40% changes relative to 1986-2005. What ecosystem, economic or social changes might you expect to see as a result of a 30-40% increase or decrease in precipitation in the arctic? In Spain? In South Africa? In Chile?
Click for a text description
Projected Changes
Projected Changes
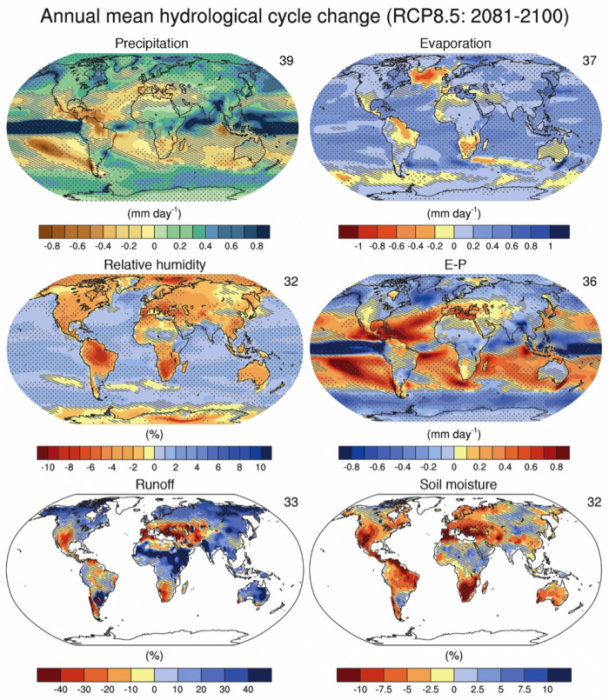
Figure 4 illustrates projected changes in other parts of the hydrological cycle during the time period 2081-2100 relative to 1986-2005 according to the high greenhouse gas emissions scenario (RCP 8.5). Note that the number of competing climate models represented for each panel of the figure is indicated by a number in the top right (range: 32-39 different models are averaged for each prediction). Future projections of water runoff or soil moisture are dependent on precipitation, which, as discussed earlier, is itself subject to substantial uncertainties. Nevertheless, it is worth considering what the variety of competing climate models have to say. For example, note the general (if slight) decrease in relative humidity over most land masses and a slight increase in relative humidity over the oceans (middle panel, left column). The middle panel in the right column shows changes in the difference between evaporation and precipitation with blue colors indicating a relatively wetter future (more precipitation relative to evaporation) and red colors indicating a relatively drier future (more evaporation than precipitation). The bottom panel in the left column predicts changes in surface water runoff. Note the significant declines in runoff throughout the southwestern US and southern Europe/northern Africa and parts of South America. This same trend is amplified in predictions of soil moisture, which is a primary control on plant growth (bottom panel, right column).
Click to expand a text description