Lesson 1: Preinstructional Activities
Overview
Did you complete the Course Orientation?
Before you begin this course, make sure you skim through the Course Orientation (see the "Orientation" menu).
About Lesson 1
My training is in research science, not education. One of my objectives in this lesson is to find out what your opinions are about teaching science and the state of science education in general. I also want you to practice reading articles, discussing them with the class, and making plots. These are all skills that you'll need later on in the course and in the other courses in this program.
What will we learn in Lesson 1?
By the end of Lesson 1, you should be able to:
- Read a scientific article and discuss it with the class using our discussion boards
- Map yourself using Google maps
- Take a quiz in Canvas
- Make an acceptable-looking plot of a dataset using a plotting program of your choice
What is due for Lesson 1?
Lesson 1 will take us one week to complete. 26 Aug - 3 Sep 2019.
| Requirement | Submitted for grading? | due date |
|---|---|---|
| Read articles and discuss them with the class | Yes—Your discussion board participation counts toward your Lesson 1 grade | regular participation spanning 26 Aug - 3 Sep |
| Map yourself | No-Optional but fun! Place yourself on a map of current and former M.Ed. in Earth Sciences students and faculty | |
| Create plots of data sets | Yes—This exercise will be submitted to a Canvas assignment and will count toward your Lesson 1 grade | 3 Sep |
| Pre-instructional quiz | Yes—Taking this Canvas-based quiz will count toward your Lesson 1 grade (you will not be graded on the correctness of your responses, only on whether you answered all the questions) | 3 Sep |
Questions?
If you have any questions, please post them to our Questions? discussion forum in Canvas (not e-mail). I will check that discussion forum daily to respond. While you are there, feel free to post your own responses if you, too, are able to help out a classmate.
Learning Science
To begin, I would like you to read two articles and discuss their merits with the rest of the class in a discussion forum. This discussion will last throughout the week, so be sure to read the articles early and check in to the discussion forum often. See the Lesson 1 Overview page for specific dates.
Learning Science Reading Discussion
Required Reading
Read the following articles, which are linked directly from the Lesson 1 Paper Discussion board in Canvas.
- Bloom, P., & Weisberg, D. S. (2007). Childhood Origins of Adult Resistance to Science. Science, 316, 996-997. doi: 10.1126/science.1133398.
- Kastens, K. A., et al. (2009). How Geoscientists Think and Learn. Eos, 90, 265-266.
Submitting your work

Once you have finished the readings, engage in a class discussion as described below. This discussion will take place over the entire week devoted to Lesson 1 and will require you to participate multiple times over that period.
- Find the "Learning Science" reading discussion forum, accessed from "One: Preinstructional Activities" module in Canvas.
- You will see the four questions below already there:
- What common scientific misconceptions do your students or other acquaintances have? How do you try to teach these concepts or correct the misconceptions?
- Do you agree with the statement made by Bloom & Weisberg that people evaluate the trustworthiness of the source when it comes to scientific concepts they've never heard of before?
- What are some examples from your own teaching and learning experiences of the "cascade of inscriptions" idea mentioned by Kastens et al.?
- Kastens et al. identify feedback loops, deep time, and spatial thinking as important for success in geosciences. Does this ring true for you? Are there any concepts/skills/habits of mind you'd add to this list?
- A separate thread for each question has been created. Respond to each thread with a meaningful response. If you feel that your response has already been "said" by another student, then post a response to someone else's remarks that expands on what has already been said, asks for clarification, asks a follow-up question, or in some other way furthers the discussion. By the end of the activity, I would like you to post at least one original thought/opinion/question and at least one thoughtful response to somebody else's post. These discussion questions are aimed at people who are practicing teachers, but if you are not one, never fear! You can still further the discussion in an intelligent way, or just think hypothetically, or recall your own school experience.
Grading criteria
You will be graded on the quality of your participation. Please see the rubric for teaching/learning discussions. [1]
Map of M.Ed Earth Sciences Program Students
Please follow the instructions below to place a pin on the map indicating where you live.
- Use the following link to access the Penn State M.Ed. Earth Sciences Program - Student Map. [2]
- In order to place a pin on the map, you need to be logged into your Google account.
- If you are not logged into a google account, you should see a window similar to the image below:
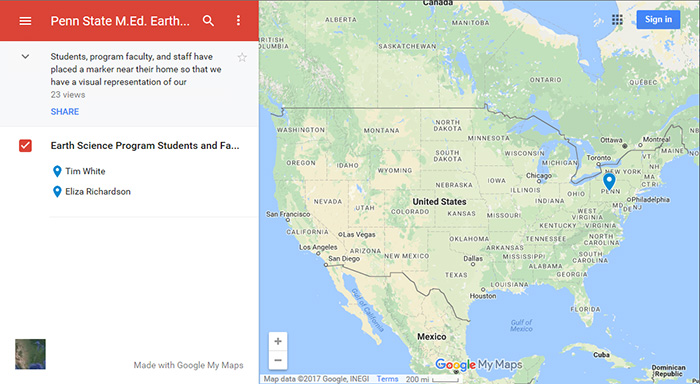 Figure 1.1 - Student Map when not logged into Google.Source: Google Maps
You can sign in by clicking on the "Sign in" link in the upper right-hand corner of the map window.
- If you are logged into a Google account, you should see a window similar to the image below:
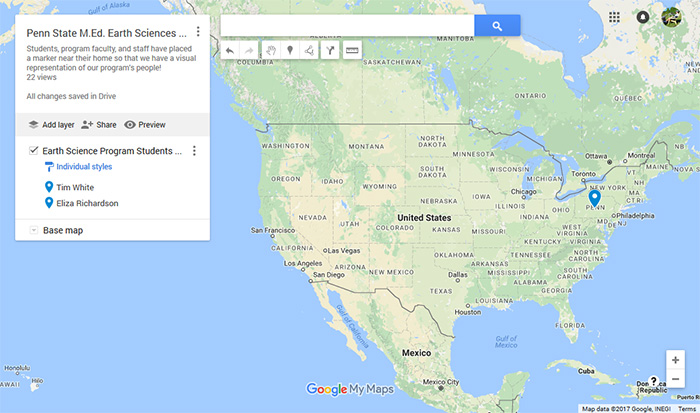 Figure 1.2 - Student Map when logged into Google.Source: Google Maps
- If you are not logged into a google account, you should see a window similar to the image below:
- To add a pin to the map, click on the "Add marker" icon in the toolbar just below the search field.
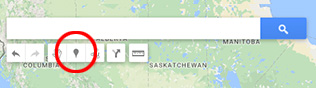 Figure 1.3 - The "Add Marker" tool in the Google Maps windowSource: Google Maps
 - Zoom into the map to locate where you live and then click on the map where you want to place the pin.
- When you click on the map, a window will open up where you can edit the name of the marker. Please change the "Point #" to your name and include a brief message about yourself in the text field below.
- Click on the "Save" button when you are finished.
Plotting, Part I
When you have your students make plots of data in your classes, what medium do they use? Do they use a computer program, a graphing calculator, or pencil and paper? Something else? I actually find pencil and paper to be extremely instructive. When I use a pencil and paper, it means I have to think about how to draw my axes and what the plot will probably look like before I begin. However, I think we all expect our own students to be a little savvier about computer use than we were at their age (even though they might not be -- they just think they are!). When I make plots for my research I use Processing, MATLAB or sometimes Numbers. I expect many of you have access to or regularly use Microsoft Excel. (I find that most plots produced in Excel look ugly or have incomprehensible labels, or both. However, if you can make a good plot with Excel, go for it! If you don't know what I mean by good, then don't use Excel.)
On the next page of this lesson, you will complete an activity that involves reproducing three plots using the graphing program of your choice. For this course, it does not matter to me what program you choose to use. What does matter to me is that you are able to generate a dataset and make a plot of it that looks adequate for a 500-level college class. So first, you need to figure out which program you would like to use! If you already have a program you like to use, by all means, use it. If you don't, or you want to check out some other possibilities, here are some links to other programs.
It is also okay with me if you like to make your plots by hand, but you do have to have some way to submit them electronically. Also, later on in the course you will have to make plots of large datasets and in that case, the tedium of setting 100+ points by hand outweighs the instructiveness of that method, I think. So why not bite the bullet and check out some of the programs below.
Freely available programs
- SoftIntegration [3]
- Chartpart [4]
- NCES create-a-graph [5] This one is pitched at kids but it got good reviews from former students
- GCalc: Java mathematical graphing system [6]
Open OfficeThe program you want here is called "calc" [7] - Matlab [8] available via PSU WebApps to registered students, so not a solution for your classroom
- Mathematica [8] available via PSU WebApps to registered students, so not a solution for your classroom
- Google docs [9] has a spreadsheet program that can make plots, free and intuitive but still a spreadsheet
Programs with a free demo available
- Kaleidagraph [10]
- Deltagraph [11]
Plotting, Part II
Now that you have identified the software you want to use to create plots of datasets, I want you to reproduce three plots and submit these to me for review.
This activity will be graded based on participation only (either you made three plots or you didn't). I will provide constructive feedback to you about the way your plots look. Even though I will not grade this particular exercise for accuracy, the rest of the lessons in this course (as well many lessons in other courses in the program) will require you to make some plots. Your grades on those activities will in part depend on your ability to produce a clear and satisfactory plot, so consider this exercise free practice.
Reproduce 3 Plots
Directions
-
Below is the first plot you have to reproduce. Graph the functions y = x2 and y = 2x on the same set of axes. The satisfactory plot will include a title, labeled axes, axes' tick marks and labels, two different line styles (doesn't have to be color) to differentiate the functions, and a correct legend identifying the two functions. All fonts should be large enough to be legible. You may choose the range of your axes, the aspect ratio of your plot, and the line style of each function.
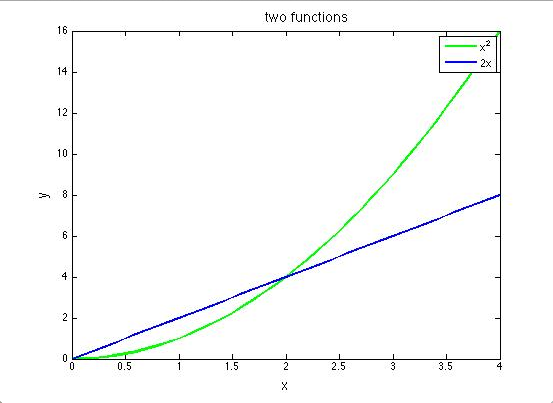 Figure 1.4 - Line plot of the functions y=2x (blue) and y=x2(green)E. Richardson, created with MATLAB
 - Next shown is the second plot you have to reproduce. Penn State's Beaver Stadium is second only to Michigan Stadium in Ann Arbor ("The Big House") in terms of attendance capacity. The official capacity of Michigan Stadium, after recent renovations, is 109,901. The plot below shows a scenario in which Michigan Stadium is filled to capacity at the start of a hypothetical football game between PSU and Michigan, but each time PSU scores a touchdown, half the fans leave. You must envision PSU scoring touchdowns until only one fan is left in the stadium. Generate such a dataset (a table of x and y values) and make a plot from it showing the number of touchdowns vs. the number of fans at Michigan Stadium. Remember, no fractional people! Always round down to the nearest whole number for your y values. I have made a sample table of values and filled in the first few for you. Continue your own table until there is just one fan left.
Table of values for Exercise 2 Number of PSU touchdowns Number of fans at the Big House 0 109,901 1 54,950 2 27,475 3 ? 4 ? 5 ? This plot should be made on linear axes. The satisfactory plot will include a title, labeled axes, axes' tick marks, and labels. Since you are plotting discrete data points that are part of a time series, please plot them with a symbol and connect the symbols with a line. All fonts should be large enough to be legible. You may choose the aspect ratio of your plot and what kind of symbol and line style to use.
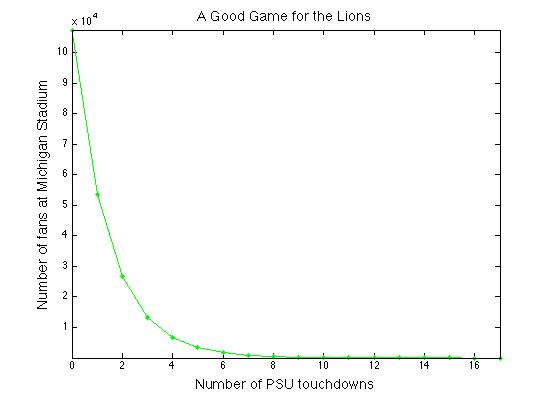 Figure 1.5 - Example linear line plot of the table of values in Exercise 2E. Richardson, created with MATLAB
 - For your third plot, use the table of values you generated in Exercise 2 to make the same plot, but using a logarithmic y-axis. The satisfactory plot will include a title, labeled axes, axes' tick marks, and labels. Since you are plotting discrete data points that are part of a time series, please plot them with a symbol and connect the symbols with a line. All fonts should be large enough to be legible. You may choose the aspect ratio of your plot and what kind of symbol and line style to use. *Alternative: If you have trouble making log axes, you may instead take the log (base 10) of each y-value in your table and plot the resulting dataset instead. Your plot should still look like the plot below, but if you choose this option, you must label your y-axis accordingly.
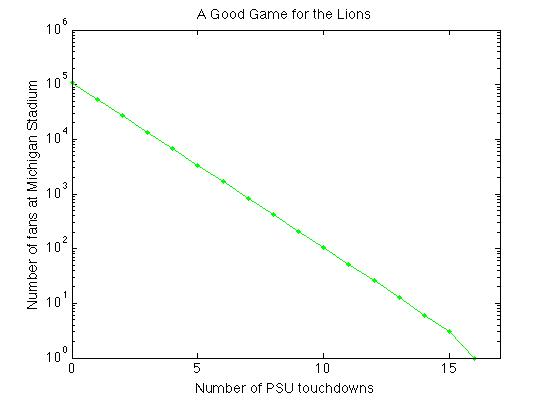 Figure 1.6 - Example log-linear plot of the table of values from Exercise 2E. Richardson, created with MATLAB
Submitting your work
You may choose to submit these plots one of two ways: you may save them as graphics files (.jpg, .pdf or .tiff) or, if you use a web plotting program that allows you to save your plot as a link, then you may submit the links to the plots.
Save your three plots in the following format:
L1_plot1_AccessAccountID_LastName.jpg (or .png or .pdf or .tiff).
For example, Cardinals outfielder Marcell Ozuna's file would be named "L1_plot1_mio13_ozuna.jpg"
Submit your three plots to the Canvas assignment in Preinstructional Activities called "Three Plots." Try to get this done by the due date listed on the first page of this lesson.
Grading criteria
As I mentioned at the top of the page, this activity will be graded based on participation only (either you made three plots or you didn't). However, I will provide constructive feedback to you about your plots.
What is Your Earth Science Background?
Background knowledge quiz
Go to Canvas and take the "Pre-instructional background quiz," which you can find in the Pre-instructional Activities module.
Submitting your work
The quiz is entirely self-contained in Canvas. When you submit your quiz, it will be shared with me.
Grading criteria
This quiz is NOT graded for accuracy, only for participation. I just want to get a sense of your Earth science background, relevant to the lessons we'll cover in this course. You should get feedback right away, but don't worry if Canvas gives you a bad grade. I will go to the gradebook and override it. Just read the feedback and you'll be fine. Try to get it done by the due date listed on the first page of this lesson.
Summary and Final Tasks
Okay, enough with the background stuff, let's move on to Lesson 2 and do some science!
Reminder - Complete all of the lesson tasks!
You have finished Lesson 1. Double-check the list of requirements on the Lesson 1 Overview page to make sure you have completed all of the activities listed there before beginning the next lesson.